https://doi.org/10.3926/jiem.2792
A Novel Classification of Supply Chain Risks:
Scale Development and Validation
Muhammad Saeed Shahbaz , Raja Zuraidah RM Rasi , MD Fauzi Bin Ahmad Universiti Tun Hussein Onn Malaysia (Malaysia)
[email protected], [email protected], [email protected]
Received: November 2018 Accepted: January 2019
Abstract:
Purpose: Supply chain has become an essential element for any organization but risks are the major obstacles in achieving the performance even it can disrupt not only the organization but a whole system. Thus, it is compulsory to manage the risks efficiently and effectively. Risk cannot be managed until properly identified, there are numerous studies on risk identification, after comprehensive literature, it has been revealed that the study that identifies overall supply chain risk is scaring. The manufacturing sector of any country is considered as the backbone of any economy, in Malaysia it is the second largest sector in economic contribution and highest in productivity level. The aim of this study is to provide a reliable tool to assess the overall supply chain risks of Malaysian manufacturing through a systematic process.
Design/methodology/approach: A detail literature review has been done for categorization of overall supply chain risk sources. Then an instrument has been developed from a pool of items. The questionnaire was purified through pretesting, pilot testing (by the exploratory view) and reliability and validity tests. The data were collected by email from Federation of Malaysian Malaysia (FMM-2017) through systemic probability sampling. Total 132 final responses have been considered for exploratory factor analysis through SPSS 23.
Findings: The finding of this study revealed that overall supply chain risks can be categories into seven constructs that are supply side risks, process side risks, demand side risks, logistic side risks, collaboration side risks and environment side risks and the final questionnaire is consisting of 57 items.
Research limitations/implications: This study covered tier 1 members of the supply chain. Secondly, the supply chain of manufacturing organizations only has been considered.
Practical implications: This study will help the managers to understand what kind of risk sources they can face and which type of risks under these risk sources they should consider while decision making. This study will update the managers about the identification of risks and their potential negative effects.
Originality/value: This article will justify the need for Malaysian manufacturing by providing a validated and reliable instrument for the identification and assessment of their risks under major supply chain risk sources.
To cite this article:
Shahbaz, M.S., Rasi, R.Z.R.M., & Ahmad, M.D.F.B. (2019). A novel classification of supply chain risks: Scale development and validation. Journal of Industrial Engineering and Management, 12(1), 201-218.
https://doi.org/10.3926/jiem.2792
1. Introduction
The aim of supply chain is to create value by empowering compatibility between internal and external processes. Hence, manufacturing organization’s effectiveness is transformed into supply chain activities because of demands for responsiveness, cost reductions and innovativeness in the customer demands (He, Zhu, Feng & Amin, 2017). Meanwhile, in a current global scenario where businesses continuously try to expand their boundaries, coverage new markets as well as distribute and seek inexpensive manufacture sites, it is essential to be well informed about possible risk that can interrupt the system and possible ways to mitigate the risks. Thus, organizations need to be able to enumerate and visualize the potential risks in order to efficiently and effectively manage it (Tazehzadeh, 2014). Accordingly, it has been argued that managing risks has become increasingly challenging because of greater uncertainties, shorter product, globalization of markets, and technology life cycles, outsourced manufacturing, distribution, and logistics make it more complex and fragile (Rao & Goldsby, 2009). This complexity and interconnectedness have a greater chance of disruption and these disruptions can badly influence the performance of the organization even a whole system. Numerous exertions have been made to quantify the risks in supply chains but no studies that identify all kind of risks in very rare, particularly risk identification in Malaysian manufacturing is scared.
The current study has two objectives first; topology supply chain risks into the dimensions/constructs and second is to identify sub-dimensions/items under these constructs. In the past many researches have categories supply chain risk sources in to various constructs like operational and disruption risks (Wagner & Bode, 2008), Operational, network and external risks (Lockamy III & McCormack, 2010) or Environmental risk, Supply risk, Demand risk and Process (Prakash, Soni, Rathore & Singh, 2017). However, after comprehensive literature it has been revealed that most of the researches categories overall supply chain risk based on the three major categories internal to organization also called organizational factors, external to organization but internal to network also known as industry factors and lastly external risk sources also called environmental factors (Basole, Bellamy, Park & Putrevu, 2016; Ellis, Shockley & Henry, 2011; Lockamy III & McCormack, 2010). Organizational factors can be categories into three kinds of flow information, financial and material flow, this flow creates information side risk, financial side risk, and logistic side risk, whereas industrial factors that include suppliers, manufacturers, and customers that can create supplier side risks, process side risks, and demand side risks. Lastly, environmental factors produce environmental side risks. Conclusively, this study argues that overall supply chain risks can be categories into seven constructs that are supply side risks, process side risks, demand side risks, logistic side risks, collaboration side risks, financial side risks, and environment side risks. Hence to confirm this argument there is sewer need to empirically prove this, for empirically verification this study develops an instrument.
There are various processes for instrument development, the current study adapts the process by (Punniyamoorthy, Thamaraiselvan & Manikandan, 2013). A pool of items has been gathered from literature review than purify them by pretesting and pilot testing from industry experts, researches and real respondents. Lastly, data final questionnaire has been distributed to all respondent industries, listed in the Federation of Manufacturing Malaysia (FMM) 2017 by email. After many reminders, 132 valid responses have been considered for data analysis. Additionally, SPSS 23 has been used for missing values, outliers, linearity, reliability and validity.
2. Literature Review
2.1. Supply Chain Risk
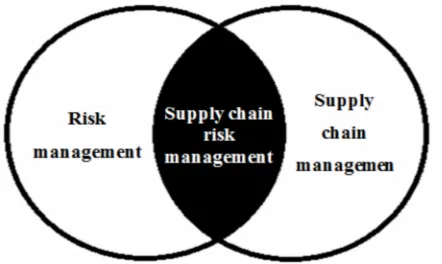
Supply chain risk management (SCRM) is a new field that came from the juncture of the supply chain (SC) and risk management (Tazehzadeh, 2014). Being a relatively new area SCRM is being assumed as a confused and orderless field (Trkman & McCormack, 2009). Even though this area has attracted many researcher’s attention still it does not have a clear definition (Ponomarov & Holcomb, 2009). The above definitions reveal that the objectives of risk management are very vast and meanwhile the supply chain but supply chain risk management has its own intentions. SCRM main objectives are an assessment of potential risks and develop an appropriate plane to avoid or mitigate it (Yaakub & Mustafa, 2015). According to the adopted definition of supply chain it focus on relationship with all upside and downside of organization that is why this study adopts the definition of supply chain risk management “the identification and evaluation of risks and consequent losses in the global supply chain, and implementation of appropriate strategies through a coordinated approach among supply chain members with the objective of reducing the risks (Manuj & Mentzer, 2008b).
Figure 1. Supply chain risk management adapted from (Vilko, 2012)
2.2. Supply Chain Risk Sources
Identification, categorization, and mitigation are essential for the success of any supply chain. It is only possible when risks are well identified. Supply chain risk management can be categories according to its risk sources (Lockamy III & McCormack, 2010). There are numerous definitions for risk sources but the definition that best match with operational definitions is (Jüttner, 2005) risk sources are “any variables which cannot be predicted with certainty and from which disruptions can emerge” and finding of this research discovered, by consensus, that risk sources have become more essentials as supply chain become more complex and modern.
Broadly supply chain risks also known as supply chain risk sources (Wagner & Bode, 2008) can be divided into two categories internal risks/ operational risks and external risks/ disruption risks (Olson & Wu, 2011) furthermore internal risk divided into operational activities like, information risks and capacity related problem, customer demand, quality related issues and etc. Whereas external risks can be divided into the competition, economic issues, political instability, natural disasters, terrorist attacks and etc. (Shahbaz, Rasi, Zulfakar, Ahmad & Asad, 2018). Additionally, from the operational definitions of this study, the supply chain not only deals internal operations but essentially considered an external relationship with their partners. Therefore, most of the researchers categories overall supply chain risks into three internal to organization also called organizational factors, external to organization but internal to network also known as industry factors and lastly external risk sources also called environmental factors (Basole et al., 2016; Ellis et al., 2011; Lockamy III & McCormack, 2010).
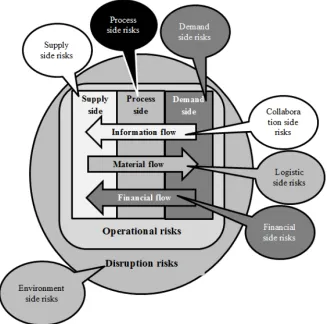
information side risks (Tang & Musa, 2011). Additionally, most of the researchers use information risk to cover information flow risks but this study argues that information side cover information related risks and miss relational risk like coordination or etc. to cover all these issue current study use collaboration side risk and this argument is supported by (Basole et al., 2016). Lastly, to cover external factors current study considers environmental factors like natural disasters, global issues and etc. the detail description can visualize from Figure 2.
Figure 2. Distribution of all risks according to their sources (Musa, 2012)
This topology is supported by (Punniyamoorthy et al., 2013) that divide overall supply chain risks into six factors, but this study misses the financial side of risk and (Musa, 2012) this study also categories overall supply chain risks into six factors and missed logistic side risks. Finally, it can conclude to cover all supply chain risks, the organization must consider seven sides that are supply side, process side, demand side, logistic side, collaboration side, financial side and environment side risks, Figure 2 explain all these seven risk sources according to their origin. Explanation of these seven is mention below.
2.2.1. Supply Side Risks
2008a). The supply side risks normally are poor logistics performance of suppliers, supplier quality problems, sudden default of a supplier (e.g., due to bankruptcy), poor logistics performance of logistics service providers and capacity fluctuations, shortages on the supply markets and etc.
2.2.2. Process Side Risks
Imperfect production is an important element that can impact significantly the performance of the company, firms can have a massive loss not only financial but also reputation (Paul et al., 2016). Process side risks/Infrastructure risk/operational risk is “loss resulting from inadequate or failed internal processes, people and systems or from external events” (Basel Committee on Banking Supervision, 2006). Process side risks may be inefficiency in the manufacturing process, high level of changing in the process, material shortage, outdated technology and etc. (Manuj & Mentzer, 2008a; Shahbaz, Rasi, Ahmad & Rehman, 2017). The focus of this study is downtime or loss of own production capacity due to local disruptions (e.g., labor strike, fire, explosion, industrial accidents), Perturbation or breakdown of internal IT infrastructure (e.g., caused by computer viruses, software bugs), loss of own production capacity due to technical reasons (e.g., machine deterioration) and Perturbation or breakdown of external IT infrastructure (Wagner & Bode, 2008).
2.2.3. Demand Side Risks
Demand side risks derived from downstream of the supply chain, or from the customer sides issues (Jüttner, 2005). Demand risk is defined as “the possibility of an event associated with outbound flows that may affect the likelihood of customers placing orders with the focal firm, and/or variance in the volume and assortment desired by the customer” (Manuj & Mentzer, 2008a). Demand risks may be delays, lazy in new product development, wrong forecasting, variation in demand, inaccurate information, industrial factors further explore as input market uncertainties, product market uncertainties, and competitive uncertainties. Lastly, organizational factors also have a group of uncertainties like operating, liability, research and development, credit, and behavioral uncertainties (Rao & Goldsby, 2009). Paul et al. (2016) reveals that very limited literature is available on demand fluctuation in the supply chain. The side risks are unanticipated or very volatile customer demand and Insufficient or distorted information from your customers about orders or demand quantity and etc.
2.2.4. Logistic Side Risks
Logistics uncertainty is viewed as an uncertainty factor that causes a delay or an interruption originating from own or partners logistics system or natural disasters throughout the logistic process (Tse et al., 2016). Logistic side risks are considered, the material flow of goods from the supply side and to demand side, usually, little attention has been paid for logistic Although, it has been noted that logistic disruption is ‘‘quickly cripple the entire supply chain’’ (Punniyamoorthy et al., 2013; Shahbaz, Rasi, Ahmad & Sohu, 2018). Normally, logistic side risks originates from cargo damage, supply side constrictions or warehouse problem (Wilson, 2007), Delay in delivery (Wang, Jie & Abareshi, 2014), improper packaging (Zubair & Mufti, 2015), labor disputes, natural disasters, terrorist activities, and transportation infrastructure failures (Thun & Hoenig, 2011), Wrong Choice of mode of transportation (Punniyamoorthy et al., 2013), transportation complexity (Wagner & Neshat, 2012).
2.2.5. Collaboration Side Risks
operations, lack of trust, level of information accuracy, information system security and disruption, intellectual property, and information outsourcing (Basole et al., 2016). Meanwhile, leakages of core competencies by suppliers to competitors (Sharma & Bhat, 2012), Delay or unavailability of the information and communication infrastructure (Punniyamoorthy et al., 2013) or Breakdown of external/internal IT infrastructure (Wang et al., 2014).
2.2.6. Financial Side Risks
The financial side risks occur due to the flows of cash among organizations, the incurrence of expenses and the use of investments for the entire network, Accounts Payables, settlements and Accounts Receivables (Faisal, 2009). Financial side risks can also be defined as “The risk that a potential event will have a financial impact. For example, if the company is in the retail software business, then a potential patent infringement claim can occur that may result in legal costs, loss of business and etc. (Handfield & McCormack, 2008). There are various types of financial side risks, initially risk was associated with embedded costs, differing costs of capital and rates of expense incurrence, and cash movements and settlements from one firm to the next (Cavinato, 2004) and financial side risks also include interest rate fluctuations, credit rating for company’s bonds, changes in currency exchange rates and changes in accounting and tax laws (Ravindran & Warsing, 2013). In many studies, it has been revealed that financial side risks negatively affect the not only the financial performance but also overall supply chain performance (Mody, 2012; Musa, 2012; Ravindran & Warsing, 2013; Singh & Abdul-Wahid, 2014).
2.2.7. Environment Side Risks
Environment side risks have low probability but high consequences (Knemeyer, Zinn & Eroglu, 2009). Natural disasters create hurdles in smooth operations (Tummala & Schoenherr, 2011). It has been mentioned previously that how nature can disrupt not only one organization but also the whole supply chain system. According to (Greenpeace Southeast Asia, 2014) fires in forest and peat have become a global threat and it also mentioned in the same report that smoke from these fires have killed about 110000 of human in Southeast Asia and caused huge global warming through carbon emission. Environment side risks further categories into political instability, macroeconomic uncertainties, social uncertainties, and natural uncertainties, political instability, (war, civil unrest or other socio-political crises), Diseases or epidemics (e.g., SARS, Foot and Mouth Disease), Natural disasters (e.g., earthquake, flooding, extreme climate, and tsunami) and International terror attacks (Wagner & Bode, 2008). In some countries regulations are also big hurdles in starting a business or operate it effectively. Administrative decision sometimes suddenly come to execution and can affect the performance badly (Hendricks & Singhal, 2003). Regulatory laws defined as any legal enforcement and execution, supply chain related, laws and policies, like transportation and trade laws, it also include the frequency and degree of changes in these policies and laws (Wagner & Bode, 2008). According to Zsidisin, Petkova and Dam, (2015) any change in the political environment due to new laws or modification in existence cause disruption in supply chain operations. It may increase cost or even sometimes halt production. It has been proved that regulation disruptions reduce the 3.8% shareholder’s wealth (Zsidisin et al., 2015).
3. Research Methodology
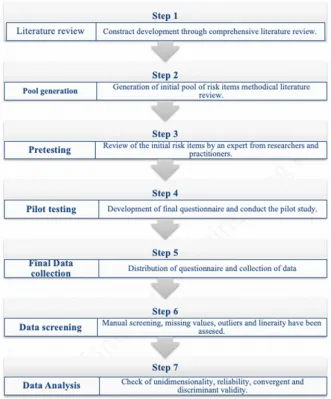
is growing tremendously, numerous instruments have been developed in many countries for different industries, from these similar instruments a large pool of items has been generated under pre-mentioned seven constructs. A draft questionnaire has been developed from this pool, and pre-testing and pilot testing have been applied for refinement. The improved questionnaire then distributed to all manufacturing firms listed in FMM 2017. Lastly, after manual screen and cleaning of data factor analysis and various test to validity and reliability, has been applied to finalize the instrument. The detail of the empirical verification process can be seen in Figure 3.
Figure 3. Instrument development process (Punniyamoorthy et al., 2013)
3. Methodolo
gy 3.1. Pre-testingThe aim of Pre-testing is normally addressing the following issues; layout, length, format, sequences, lines and replies, qualities of questions and respondents confusion. It is not only important for problems identification but also helpful in eliminating ambituses, biases, and errors (Bryman, 2013). Pre-testing should include three types of people academic, industry experts and real respondents (Forza, 2002). Current study approached four people from academic, one professor, two associate professors, and one lecturer, who have vast experience in operational and supply chain research. For industry expert, this study approached three people. Meanwhile, for real respondents this study approached six people, those are working in operations or supply chain.
of jargons, use of technical language, relationship to the problem, appropriateness to response list, measurement construct. Additional space was provided at the end for suggestions. Multiple reviews, comments, suggestions had been received and all were considered very carefully like some questions were too long so it was advised to make it comprehensive, a few difficult words had been used it had been replaced by simple one and etc. had been used so it was advised to mention some examples and remove this to avoid confusion. No additional risk had been received but it was advised to rephrase and split some of the risks.
3.2. Pilot-testing
Pilot testing is being conducted from the same type of respondents who will be participating in the main study with the aim to ensure that questions, scale, and instructions are clear and respondents can easily understand and respond properly (Pallant, 2011). Pilot testing highlights the mishaps, misunderstanding or flaws of the questionnaire and makes it sure that all respondents are paying their required attention (Neuman, 2014). Pilot testing consists of a small group of respondents from the main pool with convenience sampling (Flynn, Sakakibara, Schroeder, Bates & Flynn, 1990). Current study follows the central limit theorem that states “The larger the absolute size of a sample, the more closely its distribution will be to the normal distribution” (Saunders, Lewis & Thornhill, 2009). Hence, data were collected from 32 respondents through open-ended questionnaires. This method has been used widely as respondents have the choice to add more or any new type of risks. Lastly, collected data has been reviewed, analyzed and considered very keenly.
3.3. Questionnaire
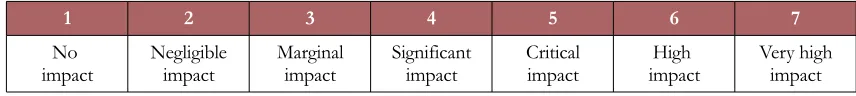
The settle questionnaire consists of two parts; the first part is about descriptive information. This part includes demographic information to know the state position of the organization, as the various demographic positions can have different types of risks, organization position, number of employees, respondent position in the organization and respondent working experience. Part 2 was about “To what extent your organization has experienced the negative impact of the following types of supply chain risks on performance in the last five years?” The seven-point Likert scale has been used; the detail about these seven seven-points is here:
1 2 3 4 5 6 7
No
impact Negligibleimpact Marginalimpact Significantimpact Criticalimpact impactHigh Very highimpact Table 1. Questionnaire scaling
3.4. Data Collection
The final questionnaires had sent to Malaysian manufacturing listed in Federation of Manufacturing Malaysia (FMM 2017) through email. The respondents were all strategic, operation and technical level staff related to supply chain as all kind of staff can have interacted with various risks. Meanwhile, after two weeks, a reminder email has also been sent as a result total 155 responses have been received.
4. Data Analysis
4.1. Data Screening
4.2. Missing Values
When a valid value on one or more variables is not available for analysis, it is considered a missing value (Hair, Black et al., 2014). How to treat these missing values it depends on its randomness and extent. For treatment, missing values (Singh., 2007) categories mission values into three types; (1) Values that are not missing completely at random (2) Values missing at random and (3) Values missing completely at random. Hence, in case 2 and 3, missing at random can be ignored but case 1 cannot be neglected, there is essential to use techniques for case 3. The current study, follow the four steps of handling missing data by Hair, Black et al. (2014). First and second is determined the type and extent of missing data, it has been found that few cases are incompletely filled by respondents. During data clearing, few responses were found incomplete or abnormal, those responses have been deleted. The third step is to diagnose of randomness of missing values, little’s missing completely at random (MCAR) test has been applied (Little, 1988). It has been revealed that Chi-square is 1707.074 while DF is 2227 and p-value is 1.00, the p-value is above significant values this means missing values are completely at random and no specific pattern found. Additionally, the missing percentage is below 5% for all variables. As there is no pattern and missing values are below 5% so Expectation maximization (EM) logarithm is considered best choice for imputation when a large amount of data is missing with no pattern (Schumacker & Lomax, 2016). Conclusively, EM method has applied through SPSS version 23 and missing values have been replaced.
4.3. Outliers
Outliers are the data points that deviate evidently from the rest of the data (Aguinis, Gottfredson & Joo, 2013). Outliers can negatively affect the mean, correlation, standard deviation and correlation coefficient (Longest, 2012). There are two major types of outliers, univariate outliers, and multivariate outliers.
The univariate outliers are the data points that exist in the distribution of each variable in the analysis or those values that fall at the outer ranges either extremely high or extreme low (Hair, Black et al., 2014). This study follows the (Pallant, 2011) method for detecting the univariate outliers, SPSS 23.0 has been used and histogram, boxplot, and the difference between mean and 5% trimmed mean have been analyzed. Boxplot analysis shows that there is no extreme outlier in each variable. The difference between mean and 5% trimmed mean is very low, it also proves the absence of any extreme high or low value in each variable. Lastly, histogram with curve illustrates that although some high values there is no pattern. Conclusively there is no extreme outlier in the individual variables.
4.4. Multivariate Outliers
Outliers represent cases those scores are considerably changed from others in a specific set of data. A univariate outlier has an extreme score on a single variable, whereas a multivariate outlier has extreme scores on two or more variables. Commonly Mahalanobis distance (D2) is being used to deal multivariate outliers. Mahalanobis distance is “a measure of each observation’s distance in multidimensional space from the mean center of all observations, providing a single value for each observation no matter how many variables are considered” (Hair, Black et al., 2014). The current study determined the critical p-value using the number of independent variables as the degrees of freedom and P should be less than 0.001 (Pallant, 2011). The current study uses SPSS 23 and found that no value below 0.001, that indicates no multivariate outlier in the data.
4.5. Linearity
4.6. Multicollinearity
The extent to which two or more independent variables are correlated with each other also termed as multicollinearity (Saunders, Lewis & Thornhill, 2016). Multicollinearity can create many problems like complication in interpretation and computational of relationships increases sampling variance in estimates of their partial relationships that ultimately increase and affect the width of confidence intervals (Hayes, 2013; Von der Heidt, 2008). Hence to find out multicollinearity two values have been calculated Tolerance and Variance Inflation Factor (VIF). The current study selected supply side risk as the dependent variable and all supply chain risk factors as an independent variable for multicollinearity through linear regression. Appendix 4 shows the values of tolerance and VIF, all the values of tolerance are greater than 0.1 and all the values of VIF are less than 10 that justify no multicollinearity issue in the data.
4.7. Instrument Reliability and Validity 4.7.1. Unidimensionality
Unidimensionalitly means a set of items/sub-dimensions can be explained by only one primary construct. It is significant when more than two constructs are involved then each item is hypothesized to narrate to only a single construct. (Hair, Black et al., 2014). Unidimensionality is considered essential for theory testing and development and constructs validity is not feasible without unidimensional scales (Seo, 2014). Unidimensionality ensure two things first is every item should be significantly associated with its particular construct and secondly, it must be accompanied with only one construct (Chen & Paulraj, 2004). Unidimensionality can be determined with either exploratory factor analysis (EFA) or confirmatory factor analysis (CFA) (Squire, Cousins, Lawson & Brown, 2009). The current study is going to explore new constructs that is why EFA has been applied.
Meanwhile, sampling adequacy has also been assessed through the value of Kaiser-Meyer-Olkin (KMO), it basically shows the adequate size of samples that are required for factor analysis (Qrunfleh, 2010; Udbye, 2014). Mostly, KMO scores below 0.5 are considered unacceptable and more than 0.90’s are considered outstanding (Leech, Barrett & Morgan, 2005; Pallant, 2011). The current study found its Kaiser-Meyer-Olkin 0.0864 means sample size is adequate and Bartlett’s Test of Sphericity is 0.000 that is below 0.05 means items have sufficient correlation among each other.
The current study has applied EFA to confirm the Unidimensionality. For EFA this study has used principal component with Varimax rotation to observe the specific dimensions (Okuduba, 2016; Seo, 2014). The VARIMAX technique has proved effective analytic approach for orthogonal rotation of factors (Hair, Black et al., 2014). The threshold value for factor loading should be more than 0.5 for significant consideration. If an item is not loading under a specific construct or is cross loading under more than one construct will be deleted (Hair, Black et al., 2014). Current study perform the test 63 items under seven constructs and found that 57 items have factor loading more than 0.5 and loading under its appropriate constructs, while two items, Social uncertainties, and International terror attacks, are loading under other constructs, meanwhile remaining four items, frequent product recall process, short product life cycles, corruptions and fail to reduce cost are not loading means have factor loading less than 0.5, all six items have been deleted.
KMO and Bartlett’s Test
Kaiser-Meyer-Olkin Measure of Sampling Adequacy. .864
Bartlett’s Test of Sphericity
Approx. Chi-Square 11726.921
df 1953
Sig. .000
4.7.2. Reliability
Reliability discusses to whether scores of items in an instrument are internally consistent or not, it is basically the ability of the instrument to measure the same thing each time. An important factor is an internal consistency; it involves correlating the responses in the instrument with each other. It thus measures the consistency of responses across a subgroup of the indicators (Saunders et al., 2016). There are various ways to measure the internal consistency but most common and famous method is coefficient alpha (Cronbach’s Alpha). Coefficient alpha measures the internal consistency reliability that undertakes equal items loadings and indicates how well the indicators are positively correlated to one another (Hair, Hult et al., 2014). The largely agreed lower limit for coefficient alpha is 0.70, although it may decrease to 0.6 (Hair, Black et al., 2014). Below Table 1 revealed that all values are above the threshold limit, thus the data is internally consistent.
Construct Items loadingFactor Reliability and validity
Supply side risks
Supplier’s human resource problems 0.596524
α = 0.898541
AVE = 0.434261343
CR = 0.883647994
Supplier quality problems 0.800776
The unexpected default of suppliers 0.705234
Frequent delays of suppliers 0.639245
Dependency on a single supplier for critical time 0.593921 Capacity fluctuations of suppliers 0.681518 Vague inspection procedures of the suppliers 0.618326 Supplier locked (cannot easily switch to another supplier) 0.550343 Unethical practices of suppliers revealed in public 0.692884
Lack of technical expertise 0.676047
Process side risks
High level of process variation 0.586235
α = 0.758934
AVE = 0.384160223
CR = 0.827993948
Inflexibility in capacity 0.748159
High labor turnover 0.854127
Vague inspection procedures 0.538017
Improper handling/maintenance 0.566749
Loss of own production capacity due to local disruptions 0.507111
Breakdown of IT infrastructure 0.551835
Loss of own production capacity due to technical reasons 0.517673
Demand side risks
Volatile customer demands 0.537681
α = 0.797996
AVE = 0.363763061
CR = 0.816334817 Customers change specifications (time, quality, quantity) 0.546886
Large forecast errors in demand 0.508607
Frequent delays in delivery to customers 0.611602
Reputation risks 0.532252
Customers’ dependency 0.645042
Loss due to customers’ faults (Any mistake from the customer) 0.837923
Higher customer expectations 0.536372
Logistic side risks
Poor logistics performance of logistic providers 0.605946
α = 0.883293
AVE = 0.343643625
CR = 0.845519516 Poor design of transportation network 0.714032
Wrong choice of mode of transportation 0.594829 Improper packaging and marking details 0.620315 Breakdown of equipment, trucks and/or delivery van 0.566018
Delay in delivery time 0.630040
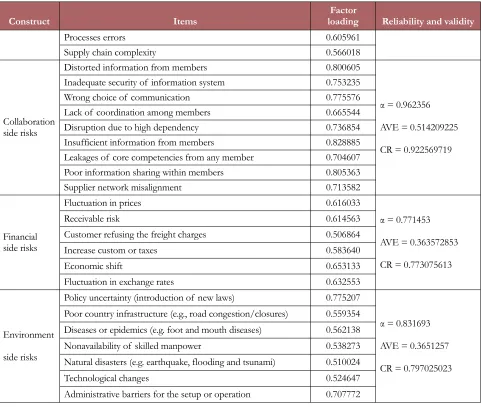
Construct Items loadingFactor Reliability and validity
Processes errors 0.605961
Supply chain complexity 0.566018
Collaboration side risks
Distorted information from members 0.800605
α = 0.962356
AVE = 0.514209225
CR = 0.922569719 Inadequate security of information system 0.753235
Wrong choice of communication 0.775576
Lack of coordination among members 0.665544
Disruption due to high dependency 0.736854
Insufficient information from members 0.828885 Leakages of core competencies from any member 0.704607 Poor information sharing within members 0.805363
Supplier network misalignment 0.713582
Financial side risks
Fluctuation in prices 0.616033
α = 0.771453
AVE = 0.363572853
CR = 0.773075613
Receivable risk 0.614563
Customer refusing the freight charges 0.506864
Increase custom or taxes 0.583640
Economic shift 0.653133
Fluctuation in exchange rates 0.632553
Environment
side risks
Policy uncertainty (introduction of new laws) 0.775207
α = 0.831693
AVE = 0.3651257
CR = 0.797025023 Poor country infrastructure (e.g., road congestion/closures) 0.559354
Diseases or epidemics (e.g. foot and mouth diseases) 0.562138 Nonavailability of skilled manpower 0.538273 Natural disasters (e.g. earthquake, flooding and tsunami) 0.510024
Technological changes 0.524647
Administrative barriers for the setup or operation 0.707772 Table 3. Reliability and validity
4.7.3. Composite Reliability (Construct Reliability)
Composite reliability is a measure of internal consistency that unlikely Cronbach’s alpha, does not undertake equivalent indicator loadings (Seo, 2014). Its range is between 0 and 1, higher the values higher levels of reliability. Its threshold value is considered good at more than 0. 70. The composite reliability below 0.60 indicates a deficiency of internal consistency and above 0.90 is not required as it means that all the items are measuring the same phenomenon (Hair, Hult et al., 2014). Generally, it is interpreted in the same way as Cronbach’s alpha (Avkiran, 2018). Table 1 shows the values of composite reliability and all values are between the required values.
4.7.4. Average Variance Extracted (AVE)
Average variance extracted (AVE) can be assumed as a complementary measure of construct validity (Krush, 2009). Average variance extracted is the degree to which a latent construct explains the variance of its indicators. This principle is demarcated as the grand mean value of the squared loadings of the indicators associated with the construct (i.e., the sum of the squared loadings divided by the number of indicators) (Hair, Black et al., 2014). Its value can be calculated by below mention formula:
Σ Standardized Squared Factor Loading2 / (Σ Standardized Squared Factor Loading 2 + Σej) (1)
explained by the construct. (Hair, Hult et al., 2014). Overall, the results of AVE are satisfactory (Table 1). This also supports the satisfactory level of Unidimensionality, internal consistency, and adequate reliability for these measures (Wang, Tai & Wei, 2006).
4.7.5. Convergent Validity
Convergent validity means that multiple indicators of one construct will act alike. Convergent validity relates when multiple indicators join and are related with one another, behave similar (Neuman, 2014). High correlations among indicates in one construct mean that the scale is measuring its proposed concept should converge or indicators in one construct share a high proportion of variance in common (Hair, Black et al., 2014). Generally, two values are considered to assess convergent validity the values of average factor loading and the value of Average variance extracted (Hair, Black et al., 2014).
High factor loadings indicate convergence for a latent construct. Average of all factor loadings should be statistically significant, a good rule of thumb is that standardized loading estimations should be at least .5 or higher and 0.7 or higher is considered ideal (Hair, Black et al., 2014). Hence, Table 1 values of leading justify the convergence validity by this method.
4.7.6. Discriminant Validity
Discriminant validity is inverse or opposite of convergent validity and discriminant validity shows that the items of one construct converge together, but also are negatively related with contrasting constructs (Saunders et al., 2016). Discriminant validity exists when a construct is actually dissimilar from other constructs both in terms of correlation with other constructs and how distinctly measured variables represent only this single construct (Hair, Black et al., 2014). It can also be defined as “A type of measurement validity for multiple indicators based on the idea that indicators of different constructs diverge (Neuman, 2014). Usually, discriminant validity is measured by examining cross loading (Hair, Hult et al., 2014). Examining the cross-loadings means an indicator’s outer loading on the associated construct should be greater than all of its loadings on other constructs. If an item is loading in another construct with the high value this is a problem of discriminant validity. Usually, this method is called generous in terms of establishing discriminant validity (Hair, Hult et al., 2014). Current data satisfy the discriminant validity as the items that have low outer loading have been deleted.
5. Discussion
distributed to manufacturing organizations and collected data were analyzed through Exploratory factor analysis. It has been found that there are 57 types of risks exist under seven risk sources. This finding of this study is in line with previous literature. Punniyamoorthy et al., (2013) has adopted the same process for heavy industry of India and developed the instrument under six risk sources. Meanwhile, Musa (2012) conducted a descriptive study (bibliographic and co-citation analysis) and conclude the same findings under six risk sources and didn’t cover the risks from material flow.
6. Implications
This study provides a holistic and comprehensive understanding to the practitioners about the supply chain risks. Managers can understand that risks have proliferated in the whole supply chain (Internal to the organization, external to the organization but internal to supply chain and external to supply chain), so they must need a systematic approach instead of just focusing on their own operations. Empirical verification between supply chain risk sources and supply chain performance provides a vibrant knowledge to the practitioners that every segment of the supply chain can be disrupted and risks are not equal in terms of disruptions. Some risks occur rarely but have high disruptions like a natural disaster but some occur frequently but have less disruption like price fluctuation. Generally, practitioners need to be more curious about supply side risks, demand side risks, logistic side risks and environment side risks. Thus, this study has provided practitioners a more comprehensive knowledge for decision making about risk identification and assessment for their supply chain.
7. Conclusion
The supply chain is a crucial chip for any organization. However, any disruption in the supply chain can not only disturb the organization but the whole system. Hence, it is imperative to manage the risks efficiently; it cannot be managed until properly identified. Thus, this study has developed a reliable instrument for the identification of overall supply chain risks in Malaysian manufacturing organizations through a systematic process. The development process includes a thorough a literature review that categorizes supply chain risk sources into seven constructs namely supply side risks, process side risks, demand side risks, logistic side risks, collaboration side risks, and environment side risks. Secondly, a pool of items/sub dimension has been generated from the literature review and this pool has been filtered by pretesting and pilot testing. Then a questionnaire has been developed and distributed to all FMM listed organizations by email. Similarly, 155 responses received after manual screening and data cleaning 132 considered for analysis. Missing values, outliers, linearity, Unidimensionality, reliability, validity has been assessed by SPSS 23. Conclusively, after some modification and the final, the purified and reliable tool has been developed with seven constructs and 57 items. Lastly, for future research sample size can be increased, secondly, there is need to assess the effects on these risks on performance and thirdly, risks need to prioritize the risks to know that which risk should be focused more.
Declaration of Conflicting Interests
The authors declared no potential conflicts of interest with respect to the research, authorship, and/or publication of this article.
Funding
The student would like to thanks Research Fund (E15501), Universiti Tun Hussein Onn Malaysia for partially supported this research through GPPS vote number U621.
References
Abdullah, M.A., Yahya, W.K., Ramli, N., Mohamed, S.R., & Ahmad, B.E. (Eds.) (2016). Regional Conference on Science, Technology and Social Sciences (RCSTSS 2014): Business and Social Sciences (251-263). Springer.
https://doi.org/10.1007/978-981-10-1458-1
Avkiran, N.K. (2018). An in-depth discussion and illustration of partial least squares structural equation modeling in health care. Health Care Management Science, 21(3), 401-408. https://doi.org/10.1007/s10729-017-9393-7
Basel Committee on Banking Supervision (2006). International Convergence of Capital Measurement and Capital Standards. Bank for International Settlements. Available at: http://www.bis.org/publ/bcbs128.pdf
Basole, R.C., Bellamy, M.A., Park, H., & Putrevu, J. (2016). Computational Analysis and Visualization of Global Supply Network Risks. IEEE Transactions on Industrial Informatics, 12(3), 1206-1213.
https://doi.org/10.1109/TII.2016.2549268
Bryman, A. (2013). Social research methods. Oxford University Press (4th ed.). https://doi.org/10.1017/CBO9781107415324.004
Cao, M., Vonderembse, M.A., Zhang, Q., & Ragu-Nathan, T.S. (2010). Supply chain collaboration:
conceptualisation and instrument development. International Journal of Production Research, 48(22), 6613-6635. https://doi.org/10.1080/00207540903349039
Cavinato, J.L. (2004). Supply chain logistics risks: From the back room to the board room. International Journal of Physical Distribution & Logistics Management, 34(5), 383-387. https://doi.org/10.1108/09600030410545427
Chen, I.J., & Paulraj, A. (2004). Towards a theory of supply chain management: The constructs and measurements. Journal of Operations Management, 22(2), 119-150. https://doi.org/10.1016/j.jom.2003.12.007
Chen, J. (2012). The Role of Supply Chain Collaboration in Supply Chain Risk Mitigation. Monash University.
Chen, J., Sohal, A.S., & Prajogo, D.I. (2013). Supply chain operational risk mitigation: A collaborative approach. International Journal of Production Research, 51(7), 2186-2199. https://doi.org/10.1080/00207543.2012.727490 Ellis, S.C., Shockley, J., & Henry, R.M. (2011). Making sense of supply disruption risk research: a conceptual
frameowrk grounded in entactment theory. Journal of Supply Chain Management, 47(2), 65-96. https://doi.org/10.1111/j.1745-493X.2011.03217.x
Faisal, M.N. (2009). Benchmarking supply chains on risk dimensions. International Journal of Services and Operations Management, 5(3), 402-427. https://doi.org/10.1504/IJSOM.2009.024153
Flynn, B.B., Sakakibara, S., Schroeder, R.G., Bates, K.A., & Flynn, E.J. (1990). Empirical research methods in operations management. Journal of Operations Management, 9(2), 250-284.
Forza, C. (2002). Survey research in operations management: a process based perspective. ‐ International Journal of Operations & Production Management, 22(2), 152-194. https://doi.org/10.1108/01443570210414310
Greenpeace Southeast Asia (2014). Stop the haze. Available at: http://www.greenpeace.org/seasia/
Hair, J.F., Black, W.C., Babin, B.J., & Anderson, R.E. (2014). Multivariate Data Analysis (7th). United States of America: Pearson Education Limited. https://doi.org/10.1038/259433b0
Hair, J.F., Hult, G.T.M., Ringle, C.M., & Sarstedt, M. (2014). A Primer on Partial Least Squares Structural Equation Modeling (PLS-SEM). SAGE Publications, Inc. https://doi.org/10.1016/j.lrp.2013.01.002
Handfield, R.B., & McCormack, K. (2008). Supply Chain Risk Management Minimizing Disruptions in Global Sourcing. Book. New York and London: Auerbach Publications Taylor & Francis Group.
https://doi.org/10.1017/CBO9781107415324.004
Hayes, A.F. (2013). Introduction to Mediation, Moderation, and Conditional Process Analysis. The Guilford Press. He, R., Zhu, W., Feng, Z., & Amin, F. (2017). Supply Side Risks Assessment of the Supply Chain - A case study of the
Supply Side Risks Assessment in Huawei’s Supply Chain. Linnaeus University Kalmar Vaxjo.
Hendricks, K.B., & Singhal, V.R. (2003). The effect of supply chain glitches on shareholder wealth. Journal of Operations Management, 21(5), 501-522. https://doi.org/10.1016/j.jom.2003.02.003
Jüttner, U. (2005). Supply chain risk management: Understanding the business requirements from a practitioner perspective. The International Journal of Logistics Management, 16(1), 120-141.
Knemeyer, A.M., Zinn, W., & Eroglu, C. (2009). Proactive planning for catastrophic events in supply chains. Journal of Operations Management, 27(2), 141-153. https://doi.org/10.1016/j.jom.2008.06.002
Krush, M.T. (2009). The dispersion of marketing capabilities and its effects on marketing strategy execution, business relationships and business unit performance. University of Nebraska.
Leech, N.L., Barrett, K.C., & Morgan, G.A. (2005). SPSS for Intermediate Statistics: Use and Interpretation (2nd ed.). Lawrence Erlbaum Associates Publishers.
Little, R.J.A. (1988). A test of missing completely at random for multivariate data with missing values. Journal of the American Statistical Association, 83. https://doi.org/10.1080/01621459.1988.10478722
Lockamy III, A., & McCormack, K. (2010). Analysing risks in supply networks to facilitate outsourcing decisions. International Journal of Production Research, 48(2), 593-611. https://doi.org/10.1080/00207540903175152
Longest, K.C. (2012). Using Stata for Quantitative Analysis. SAGE Publications.
Manuj, I., & Mentzer, J.T. (2008a). Global supply chain risk management. Journal of Business Logistics, 29(1), 133-155. Manuj, I., & Mentzer, J.T. (2008b). Global supply chain risk management strategies. International Journal of Physical
Distribution & Logistics Management, 38(3), 192-223. https://doi.org/10.1108/09600030810866986
Mody, A. (2012). Improving the Risk Identification Process for a Global Supply Chain. Massachusetts Institute of Technology.
Musa S.N. (2012). Supply Chain Risk Management: Identification, Evaluation and Mitigation Techniques. Linköping University Sweden.
Neuman, W.L. (2014). Social Research Methods: Qualitative and Quantitative Approaches. Pearson Education Limited (8) (7th ed.). Pearson Education Limited. https://doi.org/10.2307/3211488
Okuduba, O.T. (2016). Factors Influencing Supply Chain Collaboration in Public Entities in Kenya. University of Nairobi. Olson, D.L., & Wu, D. (2011). Risk management models for supply chain: a scenario analysis of outsourcing to
China. Supply Chain Management: An International Journal, 16(6), 401-408. https://doi.org/10.1108/13598541111171110 Pallant, J. (2011). SPSS survival manual: A step by step guide to data analysis using IBM SPSS. Allen & Unwin.
https://doi.org/10.1046/j.1365-2648.2001.2027c.x
Paul, S.K., Sarker, R., & Essam, D. (2016). Managing risk and disruption in production-inventory and supply chain systems: A review. Journal of Industrial and Management Optimization, 12(3), 1009-1029.
https://doi.org/10.3934/jimo.2016.12.1009
Ponomarov, S.Y., & Holcomb, M.C. (2009). Understanding the concept of supply chain resilience. The International Journal of Logistics Management, 20(1), 124-143. https://doi.org/10.1108/09574090910954873
Prakash, S., Soni, G., Rathore, A.P.S., & Singh, S. (2017). Risk analysis and mitigation for perishable food supply chain: a case of dairy industry. Benchmarking: An International Journal, 24(1), 2-23. https://doi.org/10.1108/BIJ-07-2015-0070 Punniyamoorthy, M., Thamaraiselvan, N., & Manikandan, L. (2013). Assessment of supply chain risk: scale
development and validation. Benchmarking: An International Journal, 20(1), 79-105. https://doi.org/10.1108/14635771311299506
Qrunfleh, S.M. (2010). Alignment of information systems with supply chains: Impacts on supply chain performance and organizational performance. Doctor Dissertation. The University of Toledo.
Rao, S., & Goldsby, T.J. (2009). Supply Chain Risks: A Review and Typology. International Journal of Logistics Management, 20. https://doi.org/10.1108/09574090910954864
Ravindran, A.R., & Warsing, D.P. (2013). Supply Chain Engineering: Models and Applications. Book. CRC Press Taylor & Francis Group. https://doi.org/10.1007/978-1-84996-017-5
Saunders, M., Lewis, P., & Thornhill, A. (2009). Research Methods for Business Students (5th ed.). Pearson Education Limited.
Saunders, M., Lewis, P., & Thornhill, A. (2016). Research Methods for Business Students (7) (7th ed.). Pearson Education Limited.
Schumacker, R.E., & Lomax, R.G. (2016). A Beginner’s Guide to Structural Equation Modling. Taylor & Francis (4th ed.). https://doi.org/10.1177/0146621605280603
Seo, Y.J. (2014). Northeast Asian Containerised Maritime Logistics: Supply Chain Collaboration, Collaborative Advantage And Performance. Plymouth University.
Shahbaz, M.S., Rasi, R.Z.R.M., Ahmad, M.F.B., & Rehman, F. (2017). What is supply chain risk management? A review. Advanced Science Letters, 23(9), 9233-9238. https://doi.org/10.1166/asl.2017.10061
Shahbaz, M.S., Rasi, R.Z.R.M., Ahmad, M.F.B., & Sohu, S. (2018). The impact of supply chain collaboration on operational performance: Empirical evidence from manufacturing of Malaysia. International Journal of Advanced and Applied Science, 5(8), 64-71. https://doi.org/https://doi.org/10.21833/ijaas.2018.08.009
Shahbaz, M.S., Rasi, R.Z.R.M., Zulfakar, M.H., Ahmad, M.F.B., & Asad, M.M. (2018). Theoretical Framework Development for Supply Chain Risk Management for Malaysian Manufacturing. International Journal of Supply Chain Management, 7(6), 325-338.
Shahbaz, M.S., Rasi, R.Z.R.M., Zulfakar, M.H., Ahmad, M.F.B., Abbas, Z., & Mubarak, M.F. (2018). A Novel Metric of Measuring Performance for Supply Chain Risk Management: Drawbacks and Qualities of Good Performance. Journal of Fundamental and Applied Sciences, 10(3S), 967-988. https://doi.org/http://dx.doi.org/10.4314/jfas.v10i3s.83 Sharma, S.S.K., & Bhat, A. (2012). Identification and assessment of supply chain risk: development of AHP model
for supply chain risk prioritisation. International Journal of Agile Systems and Management, 5(4), 350-369. https://doi.org/10.1504/IJASM.2012.050155
Singh., K. (2007). Quantitative Social Research Methods (1) (1st ed.). SAGE Publications.
Singh, G., & Abdul-Wahid, N. (2014). Supply Chain Risk Management: A Review. International Journal of Supply Chain Management, 3(3), 59-67.
Squire, B., Cousins, P.D., Lawson, B., & Brown, S. (2009). The effect of supplier manufacturing capabilities on buyer responsiveness: The role of collaboration. International Journal of Operations & Production Management, 29(8), 766-788. https://doi.org/10.1108/01443570910977689
Tang, O., & Musa, N. (2011). Identifying risk issues and research advancements in supply chain risk management. International Journal of Production Economics, 133, 25-34. Available at:
http://www.sciencedirect.com/science/article/pii/S0925527310002215
Tazehzadeh, M.N. (2014). Investigation of Supply Chain Risk Management Implementation in Canadian Construction Industry. Eastern Mediterranean University.
Thun, J.H., & Hoenig, D. (2011). An empirical analysis of supply chain risk management in the German automotive industry. International Journal of Production Economics, 131(1), 242-249. https://doi.org/10.1016/j.ijpe.2009.10.010 Trkman, P., & McCormack, K. (2009). Supply chain risk in turbulent environments-A conceptual model for
managing supply chain network risk. International Journal of Production Economics, 119(2), 247-258. https://doi.org/10.1016/j.ijpe.2009.03.002
Tse, Y.K., Matthews, R.L., Hua-Tan, K., Sato, Y., & Pongpanich, C. (2016). Unlocking supply chain disruption risk within the Thai beverage industry. Industrial Management & Data Systems, 116(1), 21-42.
Tummala, R., & Schoenherr, T. (2011). Assessing and managing risks using the Supply Chain Risk Management Process (SCRMP). Supply Chain Management: An International Journal, 16(6), 474-483.
https://doi.org/10.1108/13598541111171165
Udbye, A. (2014). Supply Chain Risk Management in India: An Empirical Study of Sourcing and Operations Disruptions, their Frequency, Severity, Mitigation Methods, and Expectations. Portland State University. https://doi.org/10.15760/etd.1812 Vilko, J. (2012). Approaches to Supply Chain Risk Management: Identification, Analysis and Control. Acta Universitatis
Lappeenrantaensis. Lappeenranta, Finland: Lappeenranta University of Technology.
Von der Heidt, T. (2008). Developing and testing a model of cooperative interorganisational relationships (IORs ) in product innovation in an Australian manufacturing context : a multi-stakeholder perspective . Thesis. Southern Cross University. Wagner, S.M., & Bode, C. (2008). An Empirical Examination of Supply Chain Performance Along Several
Dimensions of Risk. Journal of Business Logistics, 29(1), 307-325. https://doi.org/10.1002/j.2158-1592.2008.tb00081.x Wagner, S.M., & Neshat, N. (2012). A comparison of supply chain vulnerability indices for different categories of
firms. International Journal of Production Research, 50(11), 2877-2891. https://doi.org/10.1080/00207543.2011.561540 Wang, E., Tai, J., & Wei, H.L. (2006). A Virtual Integration Theory of Improved Supply-Chain Performance. Journal
of Management Information Systems, 23(2), 41-64. https://doi.org/10.2753/MIS0742-1222230203
Wang, M., Jie, F., & Abareshi, A. (2014). The Measurement Model of Supply Chain Uncertainty and Risk in the Australian Courier Industry. Operations and Supply Chain Management, 7(3), 89-96.
Wilson, M.C. (2007). The impact of transportation disruptions on supply chain performance. Transportation Research Part E: Logistics and Transportation Review, 43(4), 295-320. https://doi.org/10.1016/j.tre.2005.09.008
Yaakub, S., & Mustafa, H.K. (2015). Supply Chain Risk Management for the SME’s. Academic Journal of Interdisciplinary Studies, 4(1), 151-158. https://doi.org/10.5901/ajis.2015.v4n1s2p151
Zailani, S., Jeyaraman, K., Vengadasan, G., & Premkumar, R. (2012). Sustainable supply chain management (SSCM) in Malaysia: A survey. International Journal of Production Economics, 140(1), 330-340.
https://doi.org/10.1016/j.ijpe.2012.02.008
Zeng, B. (2012). Modeling and Investigating Supply Chain Risks under the Effect of Partnerships. The University of Hong Kong.
Zhu, Q., Sarkis, J., & Lai, K.H. (2008). Confirmation of a measurement model for green supply chain management practices implementation. International Journal of Production Economics, 111(2), 261-273.
https://doi.org/10.1016/j.ijpe.2006.11.029
Zsidisin, G.A., Melnyk, S.A., & Ragatz, G.L. (2005). An institutional theory perspective of business continuity planning for purchasing and supply management. International Journal of Production Research, 43(16), 3401-3420. https://doi.org/10.1080/00207540500095613
Zsidisin, G.A., Petkova, B.N., & Dam, L. (2015). Examining the influence of supply chain glitches on shareholder wealth: does the reason matter? International Journal of Production Research, 54(1), 69-82.
https://doi.org/10.1080/00207543.2015.1015751
Zubair, M., & Mufti, N.A. (2015). Identification and Assessment of Supply Chain Risks Associated with Dairy Products Sector. Journal of Basic and Applied Sciences, 11, 167-175.
Journal of Industrial Engineering and Management, 2019 (www.jiem.org)
Article’s contents are provided on an Attribution-Non Commercial 4.0 Creative commons International License. Readers are allowed to copy, distribute and communicate article’s contents, provided the author’s and Journal of Industrial Engineering and