Use of Low-Value Pediatric Services
Among the Commercially Insured
Kao-Ping Chua, MD, PhD, a, b Aaron L. Schwartz, PhD, c Anna Volerman, MD, a, d Rena M. Conti, PhD, b, e Elbert S. Huang, MD, MPHd
abstract
BACKGROUND: Claims-based measures of “low-value” pediatric services could facilitate theimplementation of interventions to reduce the provision of potentially harmful services to children. However, few such measures have been developed.
METHODS: We developed claims-based measures of 20 services that typically do not improve child health according to evidence-based guidelines (eg, cough and cold medicines). Using these measures and claims from 4.4 million commercially insured US children in the 2014 Truven MarketScan Commercial Claims and Encounters database, we calculated the proportion of children who received at least 1 low-value pediatric service during the year, as well as total and out-of-pocket spending on these services. We report estimates based on "narrow" measures designed to only capture instances of service use that were low-value. To assess the sensitivity of results to measure specification, we also reported estimates based on "broad measures" designed to capture most instances of service use that were low-value.
RESULTS: According to the narrow measures, 9.6% of children in our sample received at least 1 of the 20 low-value services during the year, resulting in $27.0 million in spending, of which $9.2 million was paid out-of-pocket (33.9%). According to the broad measures, 14.0% of children in our sample received at least 1 of the 20 low-value services during the year.
CONCLUSIONS: According to a novel set of claims-based measures, at least 1 in 10 children in our sample received low-value pediatric services during 2014. Estimates of low-value pediatric service use may vary substantially with measure specification.
aSections of Academic Pediatrics, and ePediatric Hematology/Oncology, Department of Pediatrics, dSection of
General Internal Medicine, Department of Medicine, and bDepartment of Public Health Sciences, University of
Chicago, Chicago, Illinois; and cHarvard Medical School, Boston, Massachusetts
Dr Chua conceptualized and designed the study, acquired the data, conducted the initial analyses, drafted the initial manuscript, and revised the manuscript for important intellectual content; Dr Schwartz conceptualized and designed the study, interpreted the data, and revised the manuscript for important intellectual content; Drs Volerman and Conti interpreted the data and reviewed and revised the manuscript for important intellectual content; and Dr Huang interpreted the data, reviewed and revised the manuscript for important intellectual content, and supervised the study; all authors approved the fi nal manuscript as submitted and agree to be accountable for all aspects of the work.
DOI: 10.1542/peds.2016-1809
Accepted for publication Sep 27, 2016
Address correspondence to Kao-Ping Chua, MD, PhD, 5841 S. Maryland Ave, AMB 241 W241, MC 2000, Chicago, IL 60637. E-mail: kchua@peds.bsd.uchicago.edu
PEDIATRICS (ISSN Numbers: Print, 0031-4005; Online, 1098-4275). Copyright © 2016 by the American Academy of Pediatrics
FINANCIAL DISCLOSURE: The authors have indicated they have no fi nancial relationships relevant to this article to disclose.
NIH
To cite: Chua K, Schwartz AL, Volerman A, et al. Use of Low-Value Pediatric Services Among the Commercially Insured. Pediatrics. 2016;138(6):e20161809
WHAT’S KNOWN ON THIS SUBJECT: Claims-based measures of “low-value” pediatric services could facilitate the implementation of interventions to reduce the provision of unnecessary care to children. Few such measures have been developed. The extent and fi nancial burden of low-value pediatric service use are unknown.
Recent high-profile initiatives such as Choosing Wisely have highlighted the importance of avoiding “low-value” pediatric health care services that typically do not improve child health. 1 Reducing the use of these
services could prevent iatrogenic harm (eg, radiation exposure from imaging tests) 2 while decreasing
unnecessary financial burden on families and the health care system. 3 –11 Improving the efficiency
of pediatric care is an increasingly important policy goal given the rapid rise in pediatric health care expenditures 12 as well as the
proliferation of alternative payment models such as pediatric accountable care organizations (ACOs), which incentivize providers to judiciously use resources and enhance the quality of care. 13 –18
Large-scale analyses of overuse can be facilitated by measures that directly assess low-value pediatric service use in insurance claims databases. 4 –8 These measures exploit
the relative strengths of claims data, including their large sample sizes, longitudinal nature, widespread availability, and inclusion of
utilization across multiple providers and care settings. 3, 4 Using 1 such set
of measures, for example, Schwartz et al 4 found that 25% to 42% of elderly
Medicare beneficiaries received at least 1 of 26 low-value services in 2009, resulting in $1.9 billion to $8.5 billion in spending. A subsequent study used these measures to report reduced use of certain low-value services after implementation of the Medicare Pioneer ACO model. 6
To date, however, few claims-based measures of low-value pediatric services have been developed. Furthermore, the extent and financial burden of low-value pediatric service use are unknown. To address these gaps, we developed a novel set of claims-based measures for 20 low-value pediatric services that occur across a variety of conditions and settings. We used these measures
and a large claims database to estimate use of and spending on the 20 services among 4.4 million commercially insured US children in 2014.
METHODS
Construction of Low-Value Service Measures
In fall 2015, members of our research team of pediatricians and health services researchers compiled a candidate list of low-value pediatric services by reviewing >400
recommendations from the Choosing Wisely initiative, recommendations from the US Preventive Services Task Force and the United Kingdom’s National Institute for Health and Care Excellence, child-focused evidence reports from the Cochrane Collaboration, clinical practice guidelines published by US medical specialty societies such as the Infectious Diseases Society of America, and peer-reviewed literature. 19 –56 Based on this review,
we identified several hundred low-value pediatric services, including services that cause more harm than benefit (eg, cough and cold medicines for young children) and services that typically do not improve child health (eg, Papanicolaou tests). From this list, we excluded services that could not be easily identified as low-value in claims due to the lack of necessary clinical information (eg, head imaging for minor head trauma), as well as services that were likely to be infrequent among children (eg, electroencephalograms for headache).
We ultimately selected 20 pediatric services that could be identified as low-value in claims data, including 6 diagnostic tests, 5 imaging tests, and 9 prescription drugs. We constructed claims-based measures of these 20 services based on data elements that are typically contained in US insurance claims data, including: International Classification of
Diseases, Ninth Revision, Clinical Modification (ICD-9-CM) diagnosis and procedure codes; Current Procedural Terminology codes; and demographic information. Our measures assessed low-value service use in primary care offices, hospital outpatient departments, urgent care centers, retail clinics, emergency departments, community hospitals, and academic children’s hospitals.
For the main analysis, we constructed “narrow measures” that included multiple restrictions to only capture instances of service use that were low-value, potentially at the expense of missing some instances of low-value service use. For many of the narrow measures, we employed a modified version of a widely used administrative algorithm to exclude services received by children with a “complex chronic condition” (eg, congenital anomalies, dependence on technology, cancer). 57 These
children are excluded from many clinical practice guidelines, and assessment of care appropriateness for these children may be difficult without detailed clinical information. Other restrictions were based on relevant studies, guidelines, and reports identifying each service as low-value ( Table 1). 19 –56 The codes
used in each measure are presented in Supplemental Information.
To assess whether the amount of detected low-value service use varies with measure specification, we also created broad versions of our 20 measures, following previously published studies in the adult population. 4 These “broad measures”
contained minimal restrictions and were designed to capture most instances of service use that were low-value, potentially at the expense of misclassifying some instances of appropriate service use as low-value.
TABLE 1
Claims-Based Measures of 20 Low-Value Pediatric Ser
vices
Ser
vice
No.
Ser
vice
Source
Justifi
cation
Broad Measure Defi
nition
Narrow Measure Defi
nition (Additional Exclusions)
Denominator
1
Population-based screening for vitamin D defi
ciency
CW
Because vitamin D defi
ciency is
common, healthy patients at risk should take supplements instead of being tested. Screening is useful for very high-risk patients when laboratory values will be used to determine the aggressiveness of supplementation
24,
25
25-hydroxy vitamin D blood test
(1)
No diagnosis potentially warranting testing on day of test or prior claims
a (osteomalacia, rickets, hyperparathyroidism, osteoporosis,
pathologic fracture, obesity, sarcoidosis, hepatic failure, chronic kidney disease, infl
ammatory bowel disease, cystic fi
brosis,
celiac disease, failure to thrive, malnutrition, eating disorder
,
developmental motor delay, long-term glucocor
ticoid use)
All children
(2)
No diagnosis of vitamin D defi
ciency in prior claims
a
(3)
No diagnosis indicating pregnancy on day of test
(4)
Exclude children with complex chronic conditions
b (eg, children with
risk factors for severe vitamin D defi
ciency such as malabsorption
or poor nutrition)
2
Skin prick test or IgE blood tests in children with atopic dermatitis
CW
Patch testing is more useful for evaluating atopic dermatitis than skin prick tests or IgE blood tests
26,
27
Skin prick test or aller
gen-specifi
c IgE blood test
and diagnosis of atopic dermatitis on day of test
(1)
No other diagnoses potentially warranting testing on day of test (food aller
gy, anaphylaxis, asthma, aller
gic or chronic rhinitis,
aller
gic conjunctivitis, aller
gic colitis/gastroenteritis, history of
penicillin aller
gy)
Children with a diagnosis of atopic dermatitis during the year
3
Testing for RSV in children with bronchiolitis
AAP
Testing is only indicated in the rare situation in which knowledge of the etiologic agent would change clinical management
28
Test for RSV (eg, rapid RSV test) or respiratory viral panel and diagnosis of bronchiolitis on day of test
(1)
Exclude infants aged <90 d (may be par
t of a sepsis evaluation)
Children with a diagnosis of bronchiolitis during the year
(2)
Exclude testing associated with hospitalization
c (may be required
for cohor
ting patients per hospital policy)
(3)
Exclude children who received Synagis prophylaxis in the prior 30 d (breakthrough RSV infection may prompt discontinuation of prophylaxis)
(4)
Exclude children with complex chronic conditions
b (could infl
uence
decision to initiate infl
uenza therapy in these high-risk patients)
4
Blood tests in children with a simple febrile seizure
AAP
Electrolyte levels are often normal in children with simple febrile seizures; incidence of bacteremia is not increased in children with simple febrile seizures
29
Blood cell count or electrolytes and diagnosis of simple febrile seizure on day of test
(1)
Exclude infants aged <1 y (blood cell count may be par
t of an
evaluation for central ner
vous system infections in this age group)
Children with a diagnosis of simple febrile seizure during the year
(2)
No diagnosis for complex febrile seizure, vomiting/diarrhea, or dehydration on day of test (could warrant blood or electrolyte testing)
(3)
Exclude testing associated with hospitalization
c
(4)
Exclude children with complex chronic conditions
b (eg, children with
epilepsy or congenital neurologic anomalies)
5
Cer
vical cancer screening with human papillomavirus test or Papanicolaou test in children
C
W
Evidence does not suppor
t cer
vical
cancer screening before age 21 y in most cases
30,
31
Human papillomavirus test or Papanicolaou test
(1)
No diagnosis potentially warranting testing on day of test or prior claim
a (abnormal Papanicolaou test result, dysplasia, or malignancy
of cer
vix/vagina/vulva)
Female children aged ≥
14 y
USPTF
(2)
Exclude children with complex chronic conditions
b (eg, children with
HIV or other immunodefi
ciency)
6
Testing for group A streptococcal pharyngitis in children aged <3 y
IDSA
Streptococcal pharyngitis (and therefore acute rheumatic fever) are rare before age 3 y
32
Test for group A streptococcal pharyngitis (eg, rapid streptococcal test or throat culture) in children aged <3 y
(1)
Exclude testing associated with hospitalization
c
Children aged <3 y
(2)
No diagnosis indicating exposure to communicable diseases on day of test (eg, sick contact with strep throat)
(3)
Exclude children with complex chronic conditions
b (eg, children with
immunodefi
Ser
vice
No.
Ser
vice
Source
Justifi
cation
Broad Measure Defi
nition
Narrow Measure Defi
nition (Additional Exclusions)
Denominator
7
Face or nose radiograph in children with head or face trauma
CW
Radiographs are not sensitive for the detection of facial or nasal fractures in children; CT scans are preferred
33
–
35
Radiographs of face or nose and diagnosis of head or face trauma on same day of test
No additional restrictions
Children with a diagnosis of head or face trauma during the year
8
Ultrasound in children with cryptorchidism
CW
Ultrasound is neither sensitive nor specifi
c for localizing
nonpalpable testes
36
–
38
Ultrasound of scrotum, pelvis, abdomen, or retroperitoneum and diagnosis of cryptorchidism on day of test
(1)
Exclude imaging in neonates aged
≤
28 d (ultrasound may be par
t of
an evaluation for a disorder of sex development in neonatal period)
Children with a diagnosis of cryptorchidism during the year
(2)
No diagnosis potentially warranting imaging on day of test or prior claim
a (eg, indeterminate sex, adrenogenital disorder
, hypospadias,
obesity)
9
Sinus imaging in children with acute sinusitis
CW
Sinus imaging is not routinely necessary to diagnose acute sinusitis
39
Paranasal sinus radiograph, maxillofacial CT scan, or face MRI and diagnosis of acute sinusitis on day of test
(1)
No diagnosis of acute sinusitis between 180 and 30 d before imaging
Children with a diagnosis of acute sinusitis during the year
(2)
No diagnosis of chronic sinusitis on day of imaging or prior 180 d
(3)
No other diagnosis potentially warranting imaging on day of test (orbital cellulitis, cranial ner
ve palsy, meningismus, seizures, visual
disturbances, exophthalmos, altered mental status, nasal polyps)
(4)
Exclude imaging associated with hospitalization
c
(5)
Exclude children with complex chronic conditions
b (eg, children with
cystic fi
brosis or immunodefi
ciency)
10
Neuroimaging in children with a simple febrile seizure
AAP
Evidence does not suppor
t need to
routinely obtain neuroimaging in children with simple febrile seizures; neuroimaging may involve risks of radiation exposure or procedural sedation
29
Head CT or brain MRI and diagnosis of simple febrile seizure on day of test
(1)
No other diagnosis potentially warranting imaging on day of test (complex febrile seizure, focal neurologic examination abnormalities, head/face trauma) Children with a diagnosis of simple febrile seizure during the year
(2)
Exclude imaging associated with hospitalization
c
(3)
Exclude children with complex chronic conditions
b (eg, children
with epilepsy, congenital neurologic anomalies, ventriculoperitoneal shunt)
11
Neuroimaging in children with headache
CW
Results of neuroimaging are typically negative in the absence of risk factors for structural disease
42
–
44
Head CT or brain MRI scan and diagnosis of headache on day of test
(1)
No diagnosis potentially warranting imaging on day of test (convulsions, syncope, head/face trauma, posttraumatic headache, complicated headache syndromes, bleeding disorders, history of stroke, focal neurologic examination abnormalities)
Children aged
≥
12 y
with a diagnosis of headache during the year
(2)
Exclude imaging associated with hospitalization
c
(3)
Exclude children with complex chronic conditions
b (eg, children with
cancer or hydrocephalus)
12
Cough and cold medications in children aged <6 y
CW
Evidence does not suppor
t
effi
cacy; concerns about side
effects
45,
46
Drug claim for cough or cold medication
d in children aged
<6 y
No additional exclusions
Children aged <6 y
CC
13
Oral antibiotics for acute upper respiratory infections
CW
Evidence does not suppor
t
effi
cacy; concerns about
side effects and antibiotic resistance
47
Drug claim for oral antibiotics within 3 d of a diagnosis of acute upper respiratory infection No other diagnosis potentially warranting oral antibiotics on the same day of the index diagnosis of acute upper respiratory infection or in the following 3 d
e
Children with a diagnosis of acute upper respiratory infection during the year
CC NICE
14
Oral antibiotics for acute OME
CW
Evidence does not suppor
t
effi
cacy; concerns about
side effects and antibiotic resistance
48,
49
Drug claim for oral antibiotic within 3 d of a diagnosis of acute OME
(1)
N
o
other diagnosis potentially warranting oral antibiotics on the same
day of the index diagnosis of acute OME or in the following 3 d
e
Children with a diagnosis of acute OME during the year
CC
(2)
No diagnosis of acute OME between 180 and 90 d before the index diagnosis
NICE
(3)
No diagnosis of chronic OME on the day of the index diagnosis or in the prior 180 d
TABLE 1
Ser
vice
No.
Ser
vice
Source
Justifi
cation
Broad Measure Defi
nition
Narrow Measure Defi
nition (Additional Exclusions)
Denominator
15
Oral antibiotics for acute otitis externa
CW
Otic antibiotics are the fi
rst-line therapy for acute otitis externa
50
Drug claim for oral antibiotic within 3 d of a diagnosis of acute otitis externa
(1)
No other diagnosis potentially warranting oral antibiotics on the same day of the index diagnosis of acute otitis externa or in the following 3 d
e
Children with a diagnosis of acute otitis externa during the year
(2)
No diagnosis of acute otitis externa during the 30 d before the index diagnosis
(3)
No diagnosis of chronic or malignant otitis externa on the same day of the index diagnosis or during the prior 180 d
(4)
Exclude children with complex chronic conditions
b (eg, children with
immunodefi
ciency)
16
Oral antibiotics after tonsillectomy
CW
Evidence does not suppor
t
effi
cacy; concerns about
side effects and antibiotic resistance
51,
52
Drug claim for oral antibiotic within 3 d of tonsillectomy
(1)
No other diagnosis potentially warranting oral antibiotics on the same day of the tonsillectomy or in the following 3 d
e
Children under
going
tonsillectomy during the year
CC
(2)
Exclude children with complex chronic conditions
b (eg, children
requiring endocarditis prophylaxis due to hear
t disease or
implants)
17
Oral antibiotics for bronchiolitis
AAP
Evidence does not suppor
t
effi
cacy; concerns about
side effects and antibiotic resistance
53
Drug claim for oral antibiotic within 3 d of a diagnosis of bronchiolitis (1) No other diagnosis potentially warranting oral antibiotics on the same day of the index diagnosis of bronchiolitis or in the following 3 d
e
Children with a diagnosis of bronchiolitis during the year
NICE
18
Oral cor
ticosteroids
for bronchiolitis
CW
Evidence does not suppor
t
effi
cacy; concerns about side
effects
28
Drug claim for oral cor
ticosteroid within 3 d of a
diagnosis of bronchiolitis
(1)
Exclude children with complex chronic conditions
b (eg, children
taking steroids for other conditions)
Children with a diagnosis of bronchiolitis during the year
AAP CC NICE
19
Shor
t-acting
β
-agonists for bronchiolitis
CW
Evidence does not suppor
t
effi
cacy; concerns about side
effects
28,
53
Drug claim for inhaled shor
t-acting
β
-agonist within 3 d of
a diagnosis of bronchiolitis
(1)
Limit to fi
rst-time wheezing (defi
ned as no diagnosis of wheezing,
bronchiolitis, or asthma before the index diagnosis of bronchiolitis)
Children with a diagnosis of bronchiolitis during the year
CC
(2)
Exclude children with complex chronic conditions
b (eg, patients with
chronic lung disease)
NICE
20
Acid blockers for infants with uncomplicated gastroesophageal refl
ux
CW
Refl
ux in infancy is most often physiologic and does not require treatment; little is known about safety of proton pump inhibitors, par
ticularly in
infants
54
–
56
Drug claim for oral histamine
2
-blocker or oral proton pump inhibitor in infants aged <1 y
(1)
No diagnosis potentially warranting acid blockade on the same day of drug claim or in prior claim
a (failure to thrive, weight loss,
under
weight, irritability, excessive crying, apnea, apparently
life-threatening event, gastritis, peptic ulcer
, gastrointestinal bleed)
Infants aged <1 y
NICE
(2)
Exclude children with complex chronic conditions
b (eg, children with
risk factors for severe gastroesophageal refl
ux disease such as
neurologic impairment)
AAP
, American Academy of Pediatrics; CC, Cochrane Collaboration; CT
, computed tomography; CW
, Choosing Wisely; IDSA, Infectious
Diseases Society of America; IgE, immunoglobulin E; NICE, National Institute for Health and Care Excellence; OME, otitis
media with effusion; RSV
, respiratory syncytial virus; USPTF
, US Preventive Task Force.
a Refers to all claims from January 1, 2013, until the day before the ser
vice.
b Defi
ned as children with an ICD-9 diagnosis or procedure code indicating a complex chronic condition on any claim from January
1, 2013, until the day of the ser
vice; codes were based on a widely used algorithm (see Feudtner et al
57).
c Defi
ned as a test occurring on or between the admission and dischar
ge dates for a hospitalization.
d Defi
ned as medications containing pseudoephedrine, phenylephrine, guaifenesin, dextromethorphan, brompheniramine, chlorphenira
mine, homatropine/hydrocodone, codeine/promethazine, and codeine/pyrilamine. Diphenhydramine was
excluded because it is commonly used for indications other than cough and cold. e Bacterial infections such as acute suppurative otitis media, urinary tract infection, pneumonia, and cellulitis.
TABLE 1
low-value bronchiolitis measures). For denominator populations based on age cutoffs (eg, children aged <3 years), we used age as of January 1, 2014. In a sensitivity analysis, results were not substantially altered when using age as of December 31, 2014 (Supplemental Information).
Data Source and Study Design
We conducted a cross-sectional analysis of the 2014 Truven MarketScan Commercial Claims and Encounters database, a convenience sample of claims data from >47 million US residents aged 0 to 64 years with employer-sponsored private health insurance. Because many measures excluded children with specific diagnosis or procedure codes in previous claims, we used the 2013 MarketScan database as a “look-back period” for the 2014 analyses.
Study Population
There were 12.2 million children aged 0 to 18 years in the 2014 MarketScan database. To ensure a sufficiently long look-back period for each instance of service use, we limited the sample to children who were born before 2013 and continuously enrolled for 365 days in 2013 and 2014, or born in 2013 or 2014 and continuously enrolled until the end of 2014. Of the resulting 6 374 551 million children, we excluded 1 336 938 million children whose prescription drug claims were not included in the MarketScan database and an additional 632 843 children who were enrolled in capitated plans in any month during 2014 (because claims submitted by these plans may not reliably report payment). 58–60
The final sample included 4 404 770 children, representing 5.6% of the 78.1 million US children in 2014 and 11.9% of the 36.9 million US children with employer-sponsored private insurance in 2014. 61
Statistical Analyses
Summary statistics were calculated by using the demographic
information available in the MarketScan enrollment file. Using the narrow and broad measures, we calculated the percentage of eligible children in the denominator population who received each service at least once during the year, the number of services received per 100 eligible children, and the percentage of children in the overall sample who received at least 1 of the 20 low-value services during the year. For each service and across all services, we also calculated out-of-pocket spending (the sum of coinsurance, copays, and deductibles) and total spending (allowed charges). To provide context for spending estimates, we limited the sample to children who received each service at least once in 2014, then calculated the proportion of annual health care spending among these individuals that was due to the service.
A single instance of service use can be represented by multiple claims in the MarketScan database due to separate billing of facility and professional components, claims adjustment, or billing error. 58 For analyses of service
use, we considered multiple instances of a service on the same day for a given individual to represent a single instance of service use. For spending analyses, we summed payment variables across all claims for a service on the same day for a given individual. This method of collapsing payment to the “claim-day” has been used in previous MarketScan analyses, including an Institute of Medicine report on geographic variation in spending among the privately insured US population. 59, 60
Analyses were performed by using SAS version 9.4 (SAS Institute, Inc, Cary, NC). The institutional review board of the University of Chicago exempted this study from review.
RESULTS
Of the 4.4 million children in the sample, 29.3% were aged 0 to 5
years, 35.6% were aged 6 to 12 years, and 35.1% were aged 13 to 18 years; 51.1% were male; and 85.2% lived in an urban area. Our sample included children from all US states, Washington, DC, and Puerto Rico.
Table 2 and Fig 1 report the
percentage of overall service counts, out-of-pocket spending, and total spending constituted by each category of low-value service use (diagnostic tests, imaging tests, and prescription drugs). Table 2 also reports the percentage of children in the sample who received at least 1 service in these categories during the year.
According to the narrow measures, 37.9%, 2.8%, and 59.4% of all low-value services in our sample were for diagnostic tests, imaging tests, and prescription drugs, respectively ( Table 2). Low-value imaging occurred relatively infrequently but accounted for 26.7% of all out-of-pocket spending and 33.7% of all spending on low-value services detected by using our measures. During the year, 3.9%, 0.4%, and 6.1% of children in the sample received at least 1 low-value diagnostic test, imaging test, and prescription drug. Overall, 9.6% of children in the sample received at least 1 of the 20 low-value services during the year. Total spending across all 20 services was $27.0 million, of which
$9.2 million was paid out-of-pocket (33.9%).
According to the broad measures, 14.0% of children in the sample received at least 1 of the 20 low-value services during the year ( Table 2). Total spending was $53.0 million, of which $16.3 million was paid out-of-pocket (30.8%).
to the size of the denominator (eg, vitamin D testing), whereas other services were received by a high percentage of eligible children but a small number of children overall because the condition is rare (eg, ultrasound for cryptorchidism). Estimates of low-value service use varied significantly between the narrow and broad measures for some measures (eg, allergy testing for eczema) but not for others (eg, cervical cancer screening). Among the major categories of low-value pediatric services, we observed the highest rates of use for prescription drugs. Spending on each low-value service represented small proportions of annual health care spending among children who received the service during the year (median among 20 services, 0.7% for broad measures and 0.5% for narrow measures).
Due to the large sample size of our study, our estimates had very small 95% confidence intervals. 62 For
example, estimates of the percentage of children who received at least 1 low-value pediatric service during the year had 95% confidence intervals with a width <0.08 percentage point.
DISCUSSION
Even though most children are healthy and have a limited number of interactions with the health care system, at least 9.6% of children in our sample received at least 1 of 20 low-value pediatric services during 2014, consistent with the notion that waste in pediatrics may be widespread. Although previous literature has documented significant underuse of high-value pediatric services such as immunizations, 63 our findings
suggest that overuse of low-value services may be an equally pressing deficiency in pediatric care quality. Our findings are similar to those of previous studies showing frequent use of low-value services among
adults, 3 –11 which suggests that
interventions to improve care efficiency should include patients across the entire age spectrum.
This study highlights the clinical and policy importance of reducing the use of low-value pediatric services. Most importantly, the services assessed in our study can directly harm children both in the short term (eg, side effects from antibiotics) and the long term (eg, increased lifetime incidence of cancer from unnecessary imaging). Furthermore, one-third of all spending on low-value pediatric services in our study was paid out-of-pocket, suggesting that use of these services could lead to unnecessary financial burden for families exposed to cost-sharing. Finally, our findings suggest that reducing use of low-value pediatric services could substantially decrease health care spending. 10 Annual spending on
low-value pediatric services totaled $27.0 million in our sample, which included 11.9% of all commercially insured
TABLE 2 Use of and Spending on Low-Value Diagnostic Tests, Imaging Tests, and Prescription Drugs
Variable Diagnostic Tests
(Measures 1–6)
Imaging Tests (Measures 7–11)
Prescription Drugs (Measures 12–20)
Total
Narrow measures
Service counts 286 066 19 470 419 957 707 493
% of total low-value service count in sample
37.9% 2.8% 59.4% NA
Out-of-pocket spending $2 394 690 $2 448 950 $4 312 215 $9 155 855
% of total out-of-pocket spending on low-value services in sample
26.2% 26.7% 47.1% NA
Total spending $6 951 671 $9 103 717 $10 934 306 $26 989 694
% of total spending on low-value services in sample
25.8% 33.7% 40.5% NA
% of sample receiving at least 1 service during the year
3.9% 0.4% 6.1% 9.6%a
Broad measures
Service counts 357 161 36 196 726 789 1 120 146
% of total low-value service count in sample
31.9% 3.2% 64.9% NA
Out-of-pocket spending $3 760 452 $4 847 918 $7 678 528 $16 286 898
% of total out-of-pocket spending on low-value services in sample
23.1% 29.8% 47.1% NA
Total spending $12 338 221 $20 009 840 $20 608 710 $52 956 771
% of total spending on low-value services in sample
23.3% 37.8% 38.9% NA
% of sample receiving at least 1 service during the year
5.1% 0.7% 9.7% 14.0%a
NA, not applicable.
a Represents the percentage of the sample receiving at least 1 of the 20 low-value pediatric services during the year. This number does not equal the sum of the fi rst 3 columns because
children in the United States. 61
Under the strong assumption that our sample is representative of this population, total annual spending on the 20 low-value pediatric services
is roughly $227 million just for commercially insured children alone.
Our use of direct claims-based measures differs from the
approach of previous pediatric overuse studies, most of which have indirectly assessed waste by documenting unexplained variation in care patterns between regions and hospitals. 64–66 This
variation-based approach is useful for setting target rates of utilization based on a percentile rate, or “achievable benchmark of care.” 66
However, it is difficult to determine appropriateness based on relative rates of utilization, especially if case mix differences between comparison groups cannot be adjusted for with available data or if waste frequently occurs even among providers with the lowest utilization rates.3, 4 In contrast, direct
approaches produce estimates of the absolute level of low-value service use, a quantity that is easier to interpret in isolation.
Conversely, a potential challenge of using claims-based measures to assess overuse may be the sensitivity of estimates to measure specification. In our study, we frequently observed a wide range of estimates when using narrow and broad versions of measures, illustrating a fundamental tradeoff when measuring overuse in claims: overly narrow measures may only capture a small fraction of all service use that is low-value, whereas overly broad measures may capture a significant amount of service use that is high-value. 4
This scenario suggests that for each application of claims-based measures of low-value services, organizations and researchers must carefully tailor the measures to their measurement goals.
Despite this challenge, claims-based measures of low-value services could be essential tools in several types of pediatric quality improvement efforts, 3 including
pay-for-performance initiatives. For example, Massachusetts provider groups participating in the Alternative Quality Contract received a global budget and additional financial FIGURE 1
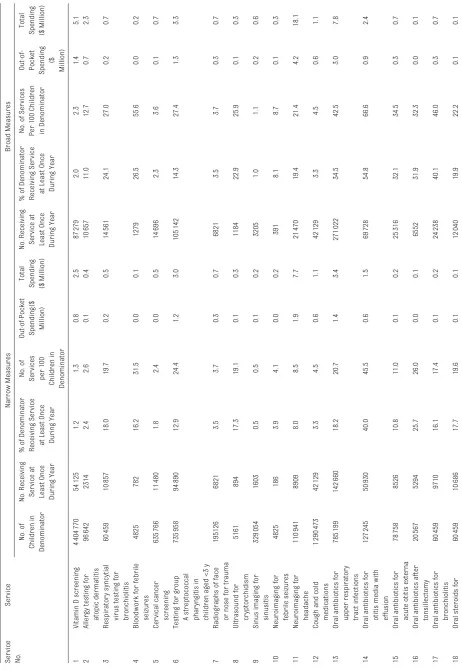
TABLE 3
Use of and Spending on 20 Low-Value Pediatric Ser
vices Ser vice No. Ser vice Narrow Measures Broad Measures No. of
Children in Denominator No. Receiving Ser
vice at
Least Once During Year % of Denominator Receiving Ser
vice
at Least Once During Year
No. of
Ser
vices
per 100
Children in Denominator Out-of-Pocket Spending($
Million)
Total
Spending ($ Million) No. Receiving Ser
vice at
Least Once During Year % of Denominator Receiving Ser
vice
at Least Once During Year
No. of Ser
vices
Per 100 Children in Denominator Out-of- Pocket Spending ($ Million)
Total
Spending ($ Million)
1
Vitamin
D
screening
4 404 770
54 125 1.2 1.3 0.8 2.5 87 279 2.0 2.3 1.4 5.1 2 Aller
gy testing for
atopic dermatitis 96 642 2314 2.4 2.6 0.1 0.4 10 657 11.0 12.7 0.7 2.3 3
Respiratory syncytial virus testing for bronchiolitis
60 459 10 857 18.0 19.7 0.2 0.5 14 561 24.1 27.0 0.2 0.7 4
Bloodwork for febrile seizures
4825 782 16.2 31.5 0.0 0.1 1279 26.5 55.6 0.0 0.2 5 Cer
vical cancer screening
635 766 11 480 1.8 2.4 0.0 0.5 14 696 2.3 3.6 0.1 0.7 6
Testing for group A streptococcal pharyngitis in children aged <3 y
735 958 94 890 12.9 24.4 1.2 3.0 105 142 14.3 27.4 1.3 3.3 7
Radiographs of face or nose for trauma
195126 6821 3.5 3.7 0.3 0.7 6821 3.5 3.7 0.3 0.7 8
Ultrasound for cryptorchidism
5161 894 17.3 19.1 0.1 0.3 1184 22.9 25.9 0.1 0.3 9
Sinus imaging for sinusitis
329 054 1603 0.5 0.5 0.1 0.2 3205 1.0 1.1 0.2 0.6 10
Neuroimaging for febrile seizures
4825 186 3.9 4.1 0.0 0.2 391 8.1 8.7 0.1 0.3 11
Neuroimaging for headache
110 941 8909 8.0 8.5 1.9 7.7 21 470 19.4 21.4 4.2 18.1 12
Cough and cold medications
1 290 473
42 129 3.3 4.5 0.6 1.1 42 129 3.3 4.5 0.6 1.1 13
Oral antibiotics for upper respiratory tract infections
785 199 142 660 18.2 20.7 1.4 3.4 271 022 34.5 42.5 3.0 7.8 14
Oral antibiotics for otitis media with effusion
127 245 50 930 40.0 45.5 0.6 1.5 69 728 54.8 66.6 0.9 2.4 15
Oral antibiotics for acute otitis externa
78 758 8526 10.8 11.0 0.1 0.2 25 316 32.1 34.5 0.3 0.7 16
Oral antibiotics after tonsillectomy
20 567 5294 25.7 26.0 0.0 0.1 6552 31.9 32.3 0.0 0.1 17
Oral antibiotics for bronchiolitis
60 459 9710 16.1 17.4 0.1 0.2 24 238 40.1 46.0 0.3 0.7 18
Oral steroids for bronchiolitis
payments based on improvements in performance on several claims-based quality measures, including 1 measure assessing low-value antibiotic prescriptions. 14 However,
although payment could be carefully linked to aggregate performance on claims-based measures at the level of large provider groups, we would caution against using these measures to summarily deny payment for individual instances of apparent low-value service use, as claims may be unable to fully account for the heterogeneous and idiosyncratic clinical circumstances leading to service use in each health care encounter. 67
Our study has a number of limitations. First, as with any administrative data analysis, we did not have access to potentially important clinical information that might influence assessments of appropriateness, which could lead to potential misclassification of services as low-value even when using the narrow measures. Although future efforts such as chart reviews may help quantify the reliability of claims-based measures, we also note that in many research settings, the impact of any misclassification bias can be attenuated by including additional restrictions or by using strong study designs. For example, 1 study used a difference-in-differences design and claims-based measures to evaluate the impact of the Medicare Pioneer ACO model on low-value service use. 6 In this
study, any significant differential changes in low-value service use were unlikely to be driven by misclassification bias unless the change in this bias before and after implementation of the ACO model differed in magnitude between the non-ACO and ACO groups. Analyses of trends in low-value pediatric service use will also not be affected by any misclassification bias unless the magnitude of this bias changes over time.
Second, it is unclear whether our results generalize to other pediatric populations, including publicly insured children. It is possible that publicly insured children receive fewer low-value services due to access barriers that result in less care overall; however, it is also possible that these children receive more low-value services because of systematic disparities in the quality of their care. Third, condition-based measures that use diagnosis codes as inclusion criteria may miss instances of low-value service use if the condition was not appropriately coded in claims (eg, if acute otitis media with effusion was coded as acute otitis media, not otherwise specified). Fourth, although we relied on recommendations from several high-profile organizations to classify a service as low-value, we acknowledge that some providers may have different perceptions of the utility of some of the services we assessed.
Finally, we only assessed 20 services, which we carefully selected from a large list of candidates primarily on the basis of whether they could be identified as low-value in claims. As such, our findings undoubtedly underestimate use of and spending on low-value pediatric services, including other services that could potentially be measured with additional claims-based measures as well as services that cannot be easily classified as low value by using claims data. We also note that our spending estimates do not account for any downstream events associated with low-value service use, including immediate events (eg, follow-up testing for false-positive initial results) and events that may occur much later (eg, use of broad-spectrum antibiotics due to antimicrobial resistance from antibiotic overuse). 68–70 To more
fully capture the scope of low-value
Ser
vice
No.
Ser
vice
Narrow Measures
Broad Measures
No. of
Children in Denominator No. Receiving Ser
vice at
Least Once During Year % of Denominator Receiving Ser
vice
at Least Once During Year
No. of
Ser
vices
per 100
Children in Denominator Out-of-Pocket Spending($
Million)
Total
Spending ($ Million) No. Receiving Ser
vice at
Least Once During Year % of Denominator Receiving Ser
vice
at Least Once During Year
No. of Ser
vices
Per 100 Children in Denominator Out-of- Pocket Spending ($ Million)
Total
Spending ($ Million)
19
Shor
t-acting
β
-agonists for bronchiolitis
60 459
16 827
27.8
28.4
0.2
0.6
26 053
43.1
48.5
0.3
1.0
20
Acid blockers for infants with refl
ux
569 022
30 639
5.4
15.5
1.3
3.6
45 284
8.0
25.6
2.2
6.7
TABLE 3
service use in pediatrics, future studies should quantify these downstream costs, identify costly low-value interventions for children with complex chronic conditions, 57 and assess low-value
applications of lucrative elective procedures that may not have been included by medical specialty societies participating in Choosing Wisely.71
CONCLUSIONS
Overuse of low-value services may be widespread in pediatrics. As health care systems increasingly incorporate payment and delivery models that prioritize value, claims-based measures of low-value pediatric services could facilitate the implementation of interventions to reduce the provision of potentially harmful services to children.
ACKNOWLEDGMENT
The authors thank Mona Sharifi, MD, MPH, for her helpful comments on the manuscript.
REFERENCES
1. Cassel CK, Guest JA. Choosing wisely: helping physicians and patients make smart decisions about their care.
JAMA. 2012;307(17):1801–1802 2. Brenner D, Elliston C, Hall E, Berdon W.
Estimated risks of radiation-induced fatal cancer from pediatric CT. AJR Am J Roentgenol. 2001;176(2):289–296 3. Baker DW, Qaseem A, Reynolds PP, Gardner LA, Schneider EC; American College of Physicians Performance Measurement Committee. Design and use of performance measures to decrease low-value services and achieve cost-conscious care. Ann Intern Med. 2013;158(1):55–59 4. Schwartz AL, Landon BE, Elshaug
AG, Chernew ME, McWilliams JM. Measuring low-value care in Medicare. JAMA Intern Med. 2014;174(7):1067–1076
5. Colla CH, Morden NE, Sequist TD, Schpero WL, Rosenthal MB. Choosing wisely: prevalence and correlates of low-value health care services in the United States.
J Gen Intern Med. 2015;30(2):221–228 6. Schwartz AL, Chernew ME, Landon
BE, McWilliams JM. Changes in low-value services in year 1 of the Medicare Pioneer accountable care organization program. JAMA Intern Med. 2015;175(11):1815–1825 7. Charlesworth CJ, Meath TH, Schwartz
AL, McConnell KJ. Comparison of low-value care in Medicaid vs commercially
insured populations. JAMA Intern Med. 2016;176(7):998–1004
8. Rosenberg A, Agiro A, Gottlieb M, et al. Early trends among seven recommendations from the Choosing Wisely campaign. JAMA Intern Med. 2015;175(12):1913–1920
9. Bentley TG, Effros RM, Palar K, Keeler EB. Waste in the US health care system: a conceptual framework. Milbank Q. 2008;86(4):629–659
10. Berwick DM, Hackbarth AD. Eliminating waste in US health care. JAMA. 2012;307(14):1513–1516
11. Claxton G, Rae M, Panchal N, et al. Health benefi ts in 2015: stable trends in the employer market. Health Aff (Millwood). 2015;34(10):1779–1788 12. Lassman D, Hartman M, Washington
B, Andrews K, Catlin A. US health spending trends by age and gender: selected years 2002-10. Health Aff (Millwood). 2014;33(5):815–822 13. Christensen EW, Payne NR. Effect of
attribution length on the use and cost of health care for a pediatric Medicaid accountable care organization. JAMA Pediatr. 2016;170(2):148–154
14. Chien AT, Song Z, Chernew ME, et al. Two-year impact of the alternative quality contract on pediatric health care quality and spending. Pediatrics. 2014;133(1):96–104
15. Chien AT, Schiavoni KH, Sprecher E, et al. How accountable care organizations responded to pediatric incentives in the alternative quality contract. Acad Pediatr. 2016;16(2):200–207
16. Gleeson S, Kelleher K, Gardner W. Evaluating a pay-for-performance program for Medicaid children in an accountable care organization. JAMA Pediatr. 2016;170(3):259–266 17. Homer CJ, Patel KK. Accountable care
organizations in pediatrics: irrelevant or a game changer for children? JAMA Pediatr. 2013;167(6):507–508
18. National Committee on Quality Assurance. Summary table of measures, product lines, and changes. Available at: www. ncqa. org/ Portals/ 0/ HEDISQM/ HEDIS2016/ HEDIS%20 2016 %20 List%20 of%20 Measures. pdf. Accessed March 10, 2016
19. American Board of Internal Medicine Foundation. Choosing wisely: clinician lists. Available at: www. choosingwisely. org/ clinician- lists. Accessed
September 30, 2015
20. US Preventive Services Task Force. Recommendations for children and adolescents. Available at: www. uspreventiveservi cestaskforce. org/ BrowseRec/ Index? age= Pediatric, Adolesc ent. Accessed September 30, 2015
21. American Academy of Pediatrics.
Pediatric Clinical Practice Guidelines
ABBREVIATIONS
ACO: accountable care organization
ICD-9: International Classification of Diseases, Ninth Revision
FUNDING: Dr Schwartz is supported by a training grant from the National Institute on Aging (F30 AG044106). Dr Huang is supported by a grant from the National Institute of Diabetes and Digestive and Kidney Diseases (K24 DK105340). Supported by the National Institutes of Health (NIH).
POTENTIAL CONFLICT OF INTEREST: Dr Schwartz reports consulting on quality measurement for Nuna Inc; the other authors have indicated they have no potential confl icts of interest to disclose.
and Policies. 15th Edition: A Compendium of Evidence-based Research for Pediatric Practice (AAP Policy). Elk Grove Village, IL: American Academy of Pediatrics; 2015
22. The Cochrane Collaboration. Cochrane evidence (search results for child health). Available at: www. cochrane. org/ search/ site/? f[0]= im_ fi eld_ stage%3 A3& f[1]= im_ fi eld_ stage%3 A2& f[2]= im_ fi eld_ stage%3 A1& f[3]= im_ fi eld_ terms_ cochrane_ library%3 A49471& adv= 1. Accessed September 30, 2015
23. National Institute for Health and Care Excellence. NICE “do not do” recommendations. Available at: https:// www. nice. org. uk/ savingsandproduct ivity/ collection? page= 1& pagesize= 2000& type= do%20 not%20 do. Accessed September 30, 2015
24. Misra M, Pacaud D, Petryk A, Collett-Solberg PF, Kappy M; Drug and Therapeutics Committee of the Lawson Wilkins Pediatric Endocrine Society. Vitamin D defi ciency in children and its management: review of current knowledge and recommendations.
Pediatrics. 2008;122(2):398–417 25. Holick MF, Binkley NC,
Bischoff-Ferrari HA, et al; Endocrine Society. Evaluation, treatment, and prevention of vitamin D defi ciency: an Endocrine Society clinical practice guideline. J Clin Endocrinol Metab. 2011;96(7):1911–1930
26. Sidbury R, Tom WL, Bergman JN, et al. Guidelines of care for the management of atopic dermatitis: section 4. Prevention of disease fl ares and use of adjunctive therapies and approaches. J Am Acad Dermatol. 2014;71(6):1218–1233
27. Boyce JA, Assa’ad A, Burks AW, et al; NIAID-Sponsored Expert Panel. Guidelines for the diagnosis and management of food allergy in the United States: report of the NIAID-sponsored expert panel. J Allergy Clin Immunol. 2010;126(suppl 6):S1–S58 28. Ralston SL, Lieberthal AS, Meissner HC,
et al; American Academy of Pediatrics. Clinical practice guideline: the diagnosis, management, and prevention of bronchiolitis. Pediatrics. 2014;134(5). Available at: www. pediatrics. org/ cgi/ content/ full/ 134/ 5/ e1474
29. Subcommittee on Febrile Seizures; American Academy of Pediatrics. Neurodiagnostic evaluation of the child with a simple febrile seizure.
Pediatrics. 2011;127(2):389–394 30. Vesco KK, Whitlock EP, Eder M, et al
Screening for Cervical Cancer: A Systematic Evidence Review for the US Preventive Services Task Force. Rockville, MD: Agency for Healthcare Research and Quality; 2011. Evidence Synthesis No. 86. AHRQ Publication No. 11-05156-EF-1
31. American College of Obstetricians and Gynecologists. Gynecologic care for women with human immunodefi ciency virus; Practice Bulletin Number 117. Available at: www. acog. org/ ~/ media/ Practice%20 Bulletins/ Committee%20 on%20 Practice%20 Bulletins%20 -- %20 Gynecology/ Public/ pb117. pdf? dmc= 1%5 C& ts= 20120216T21095703 31. Accessed March 10, 2016
32. Shulman ST, Bisno AL, Clegg HW, et al; Infectious Diseases Society of America. Clinical practice guideline for the diagnosis and management of group A streptococcal pharyngitis: 2012 update by the Infectious Diseases Society of America [published correction appears in Clin Infect Dis. 2014;58(10):1496]. Clin Infect Dis. 2012;55(10):e86–e102 33. Sitzman TJ, Hanson SE, Alsheik NH, Gentry LR, Doyle JF, Gutowski KA. Clinical criteria for obtaining maxillofacial computed tomographic scans in trauma patients. Plast Reconstr Surg. 2011;127(3):1270–1278 34. Wright RJ, Murakami CS, Ambro
BT. Pediatric nasal injuries and management. Facial Plast Surg. 2011;27(5):483–490
35. Boyette JR. Facial fractures in children. Otolaryngol Clin North Am. 2014;47(5):747–761
36. Tasian GE, Copp HL. Diagnostic performance of ultrasound in nonpalpable cryptorchidism: a systematic review and meta-analysis.
Pediatrics. 2011;127(1):119–128 37. Tasian GE, Copp HL, Baskin LS.
Diagnostic imaging in cryptorchidism: utility, indications, and effectiveness.
J Pediatr Surg. 2011;46(12):2406–2413 38. Kolon TF, Herndon A, Baker LA,
et al. Evaluation and treatment
of cryptorchidism: AUA guideline. Available at: https:// www. auanet. org/ education/ guidelines/ cryptorchidism. cfm. Accessed March 10, 2016
39. American College of Radiology. ACR appropriateness criteria, clinical condition: sinusitis—child. Available at: https:// acsearch. acr. org/ docs/ 69442/ Narrative/ . Accessed March 10, 2016
40. Chow AW, Benninger MS, Brook I, et al; Infectious Diseases Society of America. IDSA clinical practice guideline for acute bacterial rhinosinusitis in children and adults. Clin Infect Dis. 2012;54(8):e72–e112
41. Wald ER, Applegate KE, Bordley C, et al; American Academy of Pediatrics. Clinical practice guideline for the diagnosis and management of acute bacterial sinusitis in children aged 1 to 18 years. Pediatrics. 2013;132(1). Available at: www. pediatrics. org/ cgi/ content/ full/ 132/ 1/ e262
42. Lewis DW, Ashwal S, Dahl G, et al; Quality Standards Subcommittee of the American Academy of Neurology; Practice Committee of the Child Neurology Society. Practice parameter: evaluation of children and adolescents with recurrent headaches: report of the Quality Standards Subcommittee of the American Academy of Neurology and the Practice Committee of the Child Neurology Society. Neurology. 2002;59(4):490–498
43. Alexiou GA, Argyropoulou MI. Neuroimaging in childhood headache: a systematic review. Pediatr Radiol. 2013;43(7):777–784
44. American College of Radiology. ACR appropriateness criteria, clinical condition: headache. Available at: https:// acsearch. acr. org/ docs/ 69482/ Narrative/ . Accessed March 10, 2016
45. Schaefer MK, Shehab N, Cohen AL, Budnitz DS. Adverse events from cough and cold medications in children.
Pediatrics. 2008;121(4):783–787 46. Smith SM, Schroeder K, Fahey T.
Over-the-counter (OTC) medications for acute cough in children and adults in community settings. Cochrane Database Syst Rev. 2014;(11):CD001831 47. Kenealy T, Arroll B. Antibiotics for the
rhinitis. Cochrane Database Syst Rev. 2013;(6):CD000247
48. van Zon A, van der Heijden GJ, van Dongen TM, Burton MJ, Schilder AG. Antibiotics for otitis media with effusion in children. Cochrane Database Syst Rev. 2012;(9):CD009163 49. Rosenfeld RM, Shin JJ, Schwartz
SR, et al. Clinical practice guideline: otitis media with effusion (update).
Otolaryngol Head Neck Surg. 2016;154(suppl 1):S1–S41
50. Rosenfeld RM, Schwartz SR, Cannon CR, et al. Clinical practice guideline: acute otitis externa. Otolaryngol Head Neck Surg. 2014;150(suppl 1):S1–S24 51. Baugh RF, Archer SM, Mitchell
RB, et al; American Academy of Otolaryngology-Head and Neck Surgery Foundation. Clinical practice guideline: tonsillectomy in children. Otolaryngol Head Neck Surg. 2011;144(suppl 1):S1–S30
52. Dhiwakar M, Clement WA, Supriya M, McKerrow W. Antibiotics to reduce post-tonsillectomy morbidity.
Cochrane Database Syst Rev. 2012;12(12):CD005607
53. Gadomski AM, Scribani MB. Bronchodilators for bronchiolitis.
Cochrane Database Syst Rev. 2014;(6):CD001266
54. Vandenplas Y, Rudolph CD, Di Lorenzo C, et al; North American Society for Pediatric Gastroenterology Hepatology and Nutrition; European Society for Pediatric Gastroenterology Hepatology and Nutrition. Pediatric gastroesophageal refl ux clinical practice guidelines: joint recommendations of the North American Society for Pediatric Gastroenterology, Hepatology, and Nutrition (NASPGHAN) and the European Society for Pediatric Gastroenterology, Hepatology, and Nutrition (ESPGHAN). J Pediatr Gastroenterol Nutr. 2009;49(4):498–547
55. Lightdale JR, Gremse DA; Section on Gastroenterology, Hepatology, and Nutrition. Gastroesophageal refl ux: management guidance for the pediatrician. Pediatrics. 2013;131(5). Available at: www. pediatrics. org/ cgi/ content/ full/ 131/ 5/ e1684
56. van der Pol RJ, Smits MJ, van Wijk MP, Omari TI, Tabbers MM, Benninga MA. Effi cacy of proton-pump inhibitors in children with gastroesophageal refl ux disease: a systematic review.
Pediatrics. 2011;127(5):925–935 57. Feudtner C, Feinstein JA, Zhong W,
Hall M, Dai D. Pediatric complex chronic conditions classifi cation system version 2: updated for ICD-10 and complex medical technology dependence and transplantation. BMC Pediatr. 2014;14:199
58. Neprash HT, Chernew ME, Hicks AL, Gibson T, McWilliams JM. Association of fi nancial integration between physicians and hospitals with commercial health care prices. JAMA Intern Med. 2015;175(12):1932–1939 59. McKellar MR, Landrum MB, Gibson
TB, Landon BE, Naimer S, Chernew ME. Geographic variation in health care spending, utilization, and quality among the privately insured. Available at: https:// iom. nationalacademies . org/ ~/ media/ Files/ Report%20 Files/ 2013/ Geographic- Variation/ Sub- Contractor/ Harvard- University. pdf. Accessed March 10, 2016
60. Institute of Medicine. Variation in Health Care Spending: Target Decision Making, Not Geography. Washington, DC: The National Academies Press; 2013
61. Kaiser Family Foundation. Health insurance coverage of children 0-18: 2014. Available at: http:// kff. org/ other/ state- indicator/ children- 0- 18. Accessed March 10, 2016
62. Rosner B. Fundamentals of Biostatistics. 8th ed. Belmont, CA: Thomson-Brooks/Cole; 2015
63. Mangione-Smith R, DeCristofaro AH, Setodji CM, et al. The quality of ambulatory care delivered to children in the United States. N Engl J Med. 2007;357(15):1515–1523
64. The Dartmouth Institute for Health Policy & Clinical Practice. Dartmouth Atlas of children’s health care in northern New England. Available at: www. dartmouthatlas. org/ downloads/ atlases/ NNE_ Pediatric_ Atlas_ 121113. pdf. Accessed March 10, 2016
65. Florin TA, French B, Zorc JJ, Alpern ER, Shah SS. Variation in emergency department diagnostic testing and disposition outcomes in pneumonia.
Pediatrics. 2013;132(2):237–244 66. Parikh K, Hall M, Mittal V, et al.
Establishing benchmarks for the hospitalized care of children with asthma, bronchiolitis, and pneumonia.
Pediatrics. 2014;134(3):555–562 67. Elshaug AG, McWilliams JM, Landon
BE. The value of low-value lists. JAMA. 2013;309(8):775–776
68. Kronman MP, Zhou C, Mangione-Smith R. Bacterial prevalence and antimicrobial prescribing trends for acute respiratory tract infections. Pediatrics. 2014;134(4). Available at: www. pediatrics. org/ cgi/ content/ full/ 134/ 4/ e956
69. Gerber JS, Prasad PA, Fiks AG, et al. Effect of an outpatient antimicrobial stewardship intervention on broad-spectrum antibiotic prescribing by primary care pediatricians: a randomized trial. JAMA. 2013;309(22):2345–2352
70. McCaig LF, Besser RE, Hughes JM. Trends in antimicrobial prescribing rates for children and adolescents.
JAMA. 2002;287(23):3096–3102 71. Morden NE, Colla CH, Sequist TD,
DOI: 10.1542/peds.2016-1809 originally published online November 28, 2016;
2016;138;
Pediatrics
Huang
Kao-Ping Chua, Aaron L. Schwartz, Anna Volerman, Rena M. Conti and Elbert S.
Use of Low-Value Pediatric Services Among the Commercially Insured
Services
Updated Information &
http://pediatrics.aappublications.org/content/138/6/e20161809
including high resolution figures, can be found at:
References
http://pediatrics.aappublications.org/content/138/6/e20161809#BIBL
This article cites 55 articles, 15 of which you can access for free at:
Subspecialty Collections
_sub
http://www.aappublications.org/cgi/collection/system-based_practice
System-Based Practice
sub
http://www.aappublications.org/cgi/collection/quality_improvement_
Quality Improvement
_management_sub
http://www.aappublications.org/cgi/collection/administration:practice
Administration/Practice Management
following collection(s):
This article, along with others on similar topics, appears in the
Permissions & Licensing
http://www.aappublications.org/site/misc/Permissions.xhtml
in its entirety can be found online at:
Information about reproducing this article in parts (figures, tables) or
Reprints
http://www.aappublications.org/site/misc/reprints.xhtml
DOI: 10.1542/peds.2016-1809 originally published online November 28, 2016;
2016;138;
Pediatrics
Huang
Kao-Ping Chua, Aaron L. Schwartz, Anna Volerman, Rena M. Conti and Elbert S.
Use of Low-Value Pediatric Services Among the Commercially Insured
http://pediatrics.aappublications.org/content/138/6/e20161809
located on the World Wide Web at:
The online version of this article, along with updated information and services, is
http://pediatrics.aappublications.org/content/suppl/2016/11/22/peds.2016-1809.DCSupplemental
Data Supplement at:
by the American Academy of Pediatrics. All rights reserved. Print ISSN: 1073-0397.