50
Factors to Measure the Performance of Private Business Schools in South Africa R Asvat1&2, CA Bisschoff, CJ Botha2
1Regent Business School, Durban, South Africa
2NWU Business School, North-West University, Potchefstroom, South Africa [email protected]
Abstract: This article identifies the latent variables embedded within the model to measure the performance
of private business schools. In the quantitative research design, 247 questionnaires, using a five-point Likert scale, were analysed after completion by private business school supervisors and managers. The data has high reliability with a Cronbach alpha coefficient of 0.974 and excellent sample adequacy with a KMO value of 0.926. The analysis identified ten latent variables (or factors), identified using exploratory factor analysis explaining a cumulative variance of 70.56%. These are Regulatory compliance, Strategic communication, Educational technology stack, Strategic finance, Organisational development, Customer orientation, Sales, Pricing, Socio-political influence and Market focus. The study also succeeded to simplify measuring performance by eliminating 26 questions with low factor loadings (<0.40) or those that are cross-loading highly onto more than one factor from the questionnaire while retaining a satisfactory level of reliability. The results are valuable to private business school managers and to the employees wanting to measure and improve the business performance of a private business school. Researchers and academia could also benefit from the contribution of the study to either build on business performance of private business schools or, alternatively, in adopting the methodology employed in this study for another application setting.
Keywords: Performance, private higher education institutions, management, success factors, business, PHEI
1. Introduction
Globalisation and the rapid growth of the knowledge economy have created an increased demand internationally for higher education (HE). This is even more so in a developing country such as South Africa where there is a population growth of 1.45% (2017) and 1.2% (2018) (WorldoMeter, 2018). The inability of public education to cope with the historical increase in demand for education on all levels has resulted in an increase in private education, and also private higher education institutions (PHEIs) to fill the educational gap (Stander & Herman, 2017:206). The important role that higher education plays in economic growth is perceived as a panacea to the poverty and inequality faced by many people throughout the world. Hanushek (2016:538) specifically mentions the positive influences that higher education could have on South African economic growth and also individual economic empowerment. Here, increased knowledge capital, communication skills (Geldenhuys, 2018), exponential personal development, innovations, and inventions are key to facilitate economic growth. South Africa needs professionals across all sectors; managers, doctors, teachers and engineers are all vital to future economic success, and education stands central to deliver these professionals. This is a matter also facing many other countries. Furthermore, the rapid transformation of economies and countries due to the fourth industrial revolution has further impacted on governments to meet the need for a skilled population that can take their countries forward.
However, McGrath (2015) warns that particular skill sets are required for particular countries. South Africa, for example, is ideally suited for astrological skills development due to its ideal geographical location while skills for the motor-industry are less attractive because lucrative but geographically remote export markets (such as Australia), have a competitive disadvantage in transportation costs. Identifying and delivering the required country-specific skills are paramount and reside not only with educational policies and the state, but also with private higher education to identify and enter into entrepreneurial activities to harvest the market demand in South Africa. The higher education market demand is further fuelled by an age demographic profile of South Africa where the youth bulge in South Africa where the population of 57.4 million people has a median age of 26.3 years (WorldoMeter, 2018) and more than 50% of the population is younger than 25
1 This article stems from the doctoral research by Ridwaan Asvat (student number: 25495577) at the NWU
51
years old (South Africa Population, 2018). This creates a high-demand situation to equip and skill the upcoming new workforce. However, this is a serious challenge for all countries in Africa where high educational demand, public budget constraints, the exodus or brain drain of the skilled and young workforce, and limited suppliers are a reality.
In this regard, private education is a viable option for many countries to adopt to meet the need for the youth to be skilled and be of benefit to Africa. Although the highly regulated educational environment of South African complies with the CHE, SAQA and DHET requirements to be recognised and able to operate in the country (Stander & Herman, 2017:207), the South African higher education environment, including private business schools, strives to provide unsubsidised education to its students. Furthermore, despite the fact that PHEIs may not legally use the term ‘private universities’, they have to adhere to similar regulations, accreditations and oversights than the public universities. In this regard, business schools in South Africa face many managerial and entrepreneurial challenges to be successful and to meet the growing demand for higher education and to educate and form the skilled workforce for the next generation of South Africans.
Problem Statement: There are many barriers to entry and regulatory challenges in the South African PHE
market. Stringent requirements from the government via particularly the CHE, the DHET and SAQA enforce quality standards in education; however, in doing so, also strain PHEIs in South Africa to comply. Some researchers (Stander & Herman, 2017:207-208) believe that quality control processes border on over-regulation. However, although they continuously present challenges that managers of PHEIs need to address and overcome to remain compliant and competitive in the educational market, the role that PHEIs has played in the education of South Africans is acknowledged by the government. In addition, the National Development Plan for 2030 (SA Government, 2012) acknowledges the role that PHEIs can play in addressing the need for higher education in South Africa. In this regard, the South African government should aim to create an enabling regulatory environment for education that invites PHEIs into the education system while also remaining the guardian of quality education in South Africa (SA Government, 2012:268). The National Development Plan aims to achieve a 25% graduation rate as well as aiming for an enrolment target of 1.62 million by 2030 in comparison to the 950 000 students who graduated in 2010; this signifies an increase of 70% graduates (SA Government, 2012:277). Public universities simply do not have the capacity to accomplish this goal, and as a result. PHEIs are part of the solution to equip and skill the people of South Africa and embrace the fourth industrial revolution. However, for PHEs to offer lucrative business opportunities in a developing economy such as South Africa, PHEIs compete with other industries and business opportunities for investors seeking to earn a satisfactory income from their investments.
In practice, this means that PHEIs must be competitive, profitable and, in general, able to perform well as a business. Measuring business performance is, however, complex and an intricate topic. Here, Van Looy and Shafagatova (2016:1797) concur that measuring the business performance of any organisation is a critical success factor. Typical factors to be considered range from finance, customers, internal business processes technology and also the issue of learning and development. In addition, Maulina (2018:214) highlights that businesses are also affected by external factors, which include politics, government policy, law, economy and social issues, as well as the cultural, demographic and community environment. Furthermore, other internal business factors such as human resources, marketing, profitability, production and innovation also play a role in business performance. Although various models or methods have been designed and applied to measure business performance, few delved into determining the performance of education businesses. Furthermore, given the history of the development of tertiary education in South Africa, most educational business performance models focus on public universities where subsidies and state income are the primary sources of funding. This study, therefore, aims to focus on identifying the factors that are important to measure the business performance of a PHEI.
Research Objectives: The primary objective of this article is to identify the latent variables (called factors)
52
This Primary Objective is achieved by the Following Secondary Objectives: Scientifically simplify the questionnaire
Identify the underlying factor structures
Measure the reliability of the data and the factors
Determine the relationships (if any) between the factors
2. Literature Review
The literature study consists of three key elements. Firstly, it provides theoretical support to underpin the research methodology and the statistical techniques used; secondly, to substantiate their suitability for this study; and thirdly, to provide theoretical support for the factors identified from the results. These factors could be confirmatory of existing literature in other application settings, or they could be new factors that were identified by the analysis. In addressing the primary objective of this study, to identify latent variables embedded in the data, this study employs factor analysis. Two gatekeeper tests are required to successfully employ factor analysis as a multivariate statistical technique; the measure of sample adequacy and Sphericity, which refer to the inter-relationships between the variables.
Factor Analysis: Factor analysis originated in the early 1900s, Factor analysis aims to find the simplest way
to interpret the data obtained (Harman, 1976). Initially applied in human ability studies by Charles Spearman in the development of the Two-factor theory, factor analysis sparked a number of research projects based on the principles of factor analysis (Harman, 1976:159). Although initially applied to human behaviour and psychology (Kerlunger, 1973:659), the advantages of factor analysis were quick to migrate towards other disciplines such as the social and behavioural sciences, medicine, management, marketing science and even towards economics and geography as a suitable multivariate data analysis tool (Yong & Pearce, 2013:79). The main function of factor analysis is to simplify the dataset in fewer, more manageable summarised variable groups. These groups are called factors, which allow for easier comprehension, interpretation and discussion (Yong & Pearce, 2013:84). As a result, factor analysis simplifies measures by producing meaningful patterns in a group of variables (Child, 2006), and thereby regrouping the variables into a reduced set of factors (Yong & Pearce, 2013; Field, 2013; Pallant, 2013). Factor analysis can also be used to determine the validity of factors and its measuring criteria; in practice, this means that the criteria measuring a specific antecedent or construct can be confirmed as true measures of the specific construct (Patel, 2015). Many studies have successfully applied factor analysis to do so and to weed out unworthy measuring criteria from measuring instruments (for example Bisschoff & Moolla, 2014; Imandin, Bisschoff & Botha, 2016; Fields & Bisschoff, 2013a; Shaikh, Bisschoff & Botha, 2017). The two main factor analysis techniques are confirmatory factor analysis (CFA) and exploratory factor analysis (EFA); these techniques are discussed below.
Confirmatory Factor Analysis (CFA): In essence, the difference between the two approaches is that CFA is
used to confirm previously identified factors in a new application setting. Exploratory factor analysis sets out to identify new factors; this means that no specific model or variable structure exists to fit the data. This means that confirmatory factor analysis is used later in the research process to test specific existing hypotheses or theories regarding the structure of the set of variables (Pallant, 2013:179). It is more complex and sophisticated and is used when the researcher anticipates or hypothesises that a specific application setting could be explained by a specific variable structure; confirmatory factor analysis then determines whether this application setting indeed fits the hypothesised model and its different underlying dimensions (Patel, 2015:2). The objective of CFA is therefore to identify the measurement model that best describes a specific set of data (Eaton & Willoughby, 2018:104), and thereby to check whether the model proposed by the researcher fits, or appropriately describes, the correlational groupings of items in a specific dataset by developing a model, estimating the model’s parameters, as well as calculating the model-fit statistics and model refinement (Eaton & Willoughby, 2018:108. As a result, exploratory factor analysis is used mainly to better understand the variables and their grouping into fewer factors without losing their original meaning.
Exploratory Factor Analysis (EFA): Exploratory factor analysis is a multivariate statistical method to
53
and simplify it into a smaller, more understandable set of variables (which is normally unobserved) (Child, 2006). Pallant (2013:179), further states that exploratory factor analysis is used in the initial phases of research to obtain evidence about the interrelationships among a set of variables. Resultantly, the exploratory nature of the technique is usually the first step to reduce the dataset into fewer, more understandable variables (Yong & Pearce, 2013:79), especially in cases where existing models do not exist or established variable sets have not yet been identified (Samuels, 2016). In practice, this means that the researcher does not know how many factors there are (if any) and exploratory factor analysis can then be used to determine the factors, their variance explained and also how many factors actually exist that better explain the original data (Patel, 2015). Two forms of exploratory factor analysis exist, namely factor analysis (FA) and principal component analysis (PCA). Despite linguistic differences caused by the labelling of the factors (generated by the factor analysis), and components (produced from the principal component analysis) (Samuels, 2016), factor analysis is preferable because it attempts to provide a better fit with the variable groupings (factors) to the data.
It does so by rotating the factor axes, and thereby succeeds to produce a better explanation of each factor as measured in their respective variance explained. The factors are ‘rotated’ so that it is easier to interpret while they do not lose their original meaning. The next stage in the process is to determine or select the method of rotation. The one rotational technique is an orthogonal (uncorrelated) rotation where the angle between the axes is kept constant. This makes for easier interpretation and reporting, but the researcher is required to make more assumptions to label the factors (Pallant 2013:183). Orthogonal rotation is used to explore new datasets and variable structures and has the advantage that it attempts to maximise the variance explained by the data in fewer factors (Field, 2013:796). The more popular orthogonal rotational techniques are Varimax, quart IMAX and equamax. The alternative rotational method is the oblique rotation, which is more difficult to interpret report and describe. This method is usually used when the factors are correlated or established (Pallant, 2013:183). Oblique rotation methods include direct oblimin and promax rotations (Field, 2013:796). In exploratory studies, such as this one, the most common rotation used is the orthogonal Varimax rotation because this rotation disperses the maximum factor loadings so that most of the variance is explained by data (Field, 2013:796). Furthermore, Varimax rotation reduces the variables that contain high loadings across the factors and thereby reduces the probability for strong dual-loading variables (Pallant, 2013:184; Young & Pearce, 2013:84).
This study selected the orthogonal varimax rotation, mainly because of its ability to successfully extract factors in exploratory research settings (Shaikh et al., 2017; Hamid, 2015; Naidoo, 2011; Fields & Bisschoff, 2013b). The cut-off factor loadings to develop a conceptual model in this study retained only those criteria with factor loadings of 0.40 and higher; this decision criterion was implemented based on the success of similar research in various application settings (Shaikh et al., 2017; Hamid, 2015; Bisschoff & Moolla, 2014; Fields & Bisschoff, 2014; Naidoo, 2011;). The study aimed for a 60% cumulative variance explained as this signifies a good fit to the data (Field, 2013:672). Noteworthy, however, is that 50% is considered a satisfactory variance explained in exploratory research (Samuels 2016:2) and was set as the lower limit for the variance explained. The number of factors to extract was based on the eigenvalues to be equal to or higher than 1 as the initial guideline (Field, 2013:670), but the refined factor extraction methodology developed by Mishra (2008 in Patil et al., 2008:162) in their parallel research engine, was used to ascertain that the correct number of factors were extracted. In cases where the number of factors to be extracted differed, the parallel research engine was used as the definitive measure. Exploratory factor analysis requires the key gatekeeper statistics or tests to be meaningful in interpretation and data analysis. These tests and its decision criteria are discussed below.
Kaiser-Meyer-Olkin (KMO) Measure if Sample Adequacy: The Kaiser-Meyer-Olkin (KMO) measures
54
to either collect more data or reconsider the variables to be included in the analysis (Field, 2013:1976). In this study, exploratory factor analysis is pursued and the KMO as a measure of sampling adequacy should be equal to or higher than 0.70 to be considered as acceptable (Hassan, 2016:889; Mbuya & Schachtebeck, 2016:232).
Bartlett’s Test of Sphericity: Sphericity is a condition where the variances of the differences between all
combinations of related groups are equal (Laerd, 2018). Bartlett’s test of sphericity is also a secondary measure to test sample adequacy (Field, 2013:1980), because if the sample is inadequate, the sphericity should also portray insignificant values that are higher than the maximum significance level of 0.05. This test specifically examines whether the variance-covariance matrix is proportional to the identity matrix, and therefore effectively tests whether the group variances are similar in nature. If so, the off-diagonal elements would be approximately zero, which means that the dependent variables are uncorrelated and therefore indicate that factor analysis is a suitable multivariate technique to apply to the specific dataset (Field, 2013:2467). Bartlett’s test of sphericity will usually be significant at a value of less than .005 (Field, 2013:2005; Pallant, 2013:190). In practice, this means that sphericity guides the researcher to determining how well the extracted factors explain the research setting.
Reliability: The Cronbach alpha is a statistical test performed to indicate the overall reliability as a measure
of the internal consistency of the data collected (Mbuya & Schachtebeck, 2016:232); coefficients between 0 and 1 are displayed as reliability indicators (Hassan, 2016:891). High reliability implies that similar results (in this case factors) should present themselves in repetitive studies of a similar nature, while low reliability means that other factors should surface in such a repetitive study performed under the same conditions (Bester, 2018:60; Field, 2013:2031). It is noteworthy that a low alpha coefficient does not disqualify a factor from the current study; even factors with lower reliability remain important to the present study. Reliability, therefore, yields a verdict on the repetitiveness of factors in similar studies and, consequently, the predictability of these factors in confirmatory factor analysis studies (Field, 2013:666). Cronbach alpha coefficients are regarded to be satisfactory once they equal or exceed 0.70 (Hassan, 2016:891; Field, 2013:2037), although seminal research by Cortina (1993:98) indicated that coefficients of 0.57 and higher are also acceptable in exploratory studies. Coefficients higher than 0.8 are considered to be good, while those exceeding 0. 9 are considered to be excellent (Sekaran & Bougie, 2003:327).
3. Research Methodology
Research Design: The study makes use of a literature review and a mixed qualitative and quantitative
research design to collect the data. The antecedents for business success under scrutiny were initially identified from the theoretical study. The study included all sectors and all businesses that measure their success. Financial and sales measures as business success antecedents were abundant, but literature scrutiny soon identified other antecedents as valued antecedents towards measuring the business success of PHEIs. Typically, antecedents such as employee turnover, satisfaction, returning customers and marketing metrics are but a few of the identified antecedents. The literature study employed similar studies and models that measure business performance (and/or success) and identified a wide array of possible antecedents to measure business performance (about all types of businesses). This extensive list was impractical and many of these antecedents had little or no relevance to the business performance of PHEIs specifically. These antecedents were critically evaluated and obvious irrelevant antecedents to the application setting were discarded. Measuring criteria were then developed from the literature for each of the retained antecedents.
55
The Interviewee Profiles are:Interviewee 1: Is a 60-year-old director of marketing with ten years’ experience in PHEI and holds a B
degree in marketing.
Interviewee 2: Is a 47-year-old senior manager with a PhD and 15 years’ experience in PHEI.
Interviewee 3: Is a 73-year-old director with over 40 years of public and private higher education
experience and holds a professorship.
Interviewee 4: Is a 65-year-old professor with over 30 years’ experience in government, public education
and private higher education.
Interviewee 5: Is a 42-year-old director with a professional accounting qualification and ten years’
experience in PHEI.
Interviewee 6: Is a 40-year-old senior manager with 15 years’ experience in PHEI with a professorship. Interviewee 7: Is a 50-year-old director with 20 years’ experience in private higher education and holds a
professorship.
Interviewee 8: Is a 40-year-old senior manager with 15 years’ experience in PHEI with a master’s
qualification.
The meta-technique (as adapted and applied by Coetsee, 2002:142-147) was employed to capture their views and identify the list of key antecedents relevant to PHEIs’ performance (see Table 2). All the interviews were recorded and transcribed to ensure no information loss occurred. After the interviews, the initial list was amended and expanded to incorporate suggestions and also consider omitting criteria the interviewees did not deem important in managing a private higher institution.
Data Collection: The questionnaire contained two sections: Section A: Demographics, and Section B:
Measuring criteria. Section A consists of five questions to compile the demographic profile of the respondents. Section B consists of the final 18 antecedents dealing with business performance constructs, each with its own measuring criteria. The criteria were formulated in statement format to which the respondents had to indicate their level of agreement or disagreement on a five-point Likert scale. In total, Section B consisted of 68 measuring criteria (see Table 2). The population consisted of all full-time employees at two private business schools. These schools have a wide geographic service area, which covers South- and also Southern Africa. The total population was targeted; no sample was drawn. The employees were requested to complete the questionnaires and it was clearly indicated that participation is voluntary and also anonymous. The researcher forwarded the questionnaires to trained office managers in the outlying offices and to the academic managers at the head office in Durban to assist with the distribution and collection of the questionnaire. A total of 250 questionnaires were distributed, of which 247 were completed and returned, signifying an effective response rate of 98.8%. The data was captured by the Statistical Consultation Services of the North-West University and analysed with the IBM Statistical Package for Social Services Version 25 (IBM SPSS, 2018).
Table 2: Constructs Supported by the Literature
Antecedent Criteria
Interviewee-selected criteria Literature support Literature-supported criteria
1. Sales 1. Cost of the programmes 2. Sales target achievement 3. Number of short courses sold
4. Number of students enrolled
5. Number of returning students enrolled
(Criterion 6: Omitted)
1, 2, 3, 4, 5, 6, 7, 8
1, 2, 3, 4, 5, 6, 7, 8
1, 5, 6, 7, 8
1, 2, 3, 4, 5, 6, 7, 8
1, 2, 3, 4, 5, 6, 7, 8
Belch and Belch (2015) Collins Dictionary (2017) CSO Insights (2016) Lei (2012)
Kargic and Poturak (2014)
Thian et al. (2016) Bezuidenhout and De Jager (2014)
1, 2
3, 4, 5
1, 2 1, 2, 3, 4, 5 1, 2, 4, 5
1, 2 1, 2, 3
56
share
8. Increase in student numbers
9. Increase in new programmes 10. New regions 11.Saturation of SADC and SA markets 12. Entered into international partnerships 13. Leverage alumni network
1, 2, 3, 8
2, 3, 4, 6, 7
1, 2, 3, 4, 5, 6, 7, 8 2, 5, 6, 8
3, 4, 7
1, 3, 6, 7
De Meyer et al. (2017) Hanover Research (2017) Thian et al. (2016) PWC (2017)
Akplu (2016)
Levy (2015a)
7, 9, 10
11, 12, 13
7, 8, 9, 10, 12 10, 11, 12
7,10,11
7,8,9,10,11,12
3. Profitability 14. Expense control 15. Increase in revenue 16. Sustainable
2, 5, 6, 8
1, 2, 3, 4, 5, 6, 7, 8
2, 3, 5, 6, 8
Longenecker et al. (2017) Kotler and Keller (2016) Bateman and Snell (2015)
Sazonov et al. (2015) Jashim (2016)
16
14, 15, 16
14, 15
14, 15, 16 15 4. Technology 17. Website
18. Social media 19. Management information systems 20. On-line learning 21. CRM software
1, 2, 3, 4, 5, 6, 7, 8
1, 2, 3, 4, 5, 6, 7, 8 2, 4, 5, 6, 7, 8
1, 2, 3, 4, 5, 6, 7, 8 2, 5, 6, 8
Alsemgeest et al. (2017) Longenecker et al. (2017) University of Oxford (2017)
Hanover Research (2017) Navneet (2016)
17, 18, 19, 20, 21
17, 18, 20
19, 20
20, 21 19, 20 5. Customer 22. Customer value
23. Continual improvement 24. Products offered 25. The target market for distance education
2, 4, 5, 6, 7
1, 2, 3, 6, 7
1, 4, 5, 6, 7, 8 1, 2, 3, 4, 5, 6, 7, 8
Alsemgeest et al. (2017) Goetsch and Davis (2016) Levy (2015b)
Khalid (2014)
24
22, 23, 24
24, 25 22, 23, 24, 25
6. Innovation 26. Teaching and learning
27. Academic programmes
28. Embrace innovation 29. Online platforms
2, 4, 5, 6, 7
3, 4, 6, 7
1, 2, 3, 4, 5, 6, 7, 8
2, 3, 4, 5, 6, 7, 8
Alsemgeest et al. (2017) Longenecker et al. (2017) Hanover Research (2017) Navneet (2016)
26
28, 29
26, 27, 28, 29
26, 27, 28, 29 7. Service 30. Level of service
31. Meeting needs 32. Meeting wants 33. Considers the customer
1, 2, 3, 4, 5, 6, 7, 8
2, 3, 6, 7, 8 1, 3, 4, 5, 6, 7, 8 1, 2, 3, 4, 5, 6, 7, 8
Bateman and Snell (2015)
Altbach (2015) Navneet (2016)
30, 31, 32, 33
31, 32, 33 30, 31, 32, 33
8. Leadership 34. Goal directed
35. Innovative
36. Passionate
1, 2, 3, 4, 5, 6, 7, 8
2, 4, 5, 6, 7, 8
1, 2, 3, 4, 5, 6, 7, 8
Goetsch and Davis (2016) Longenecker et al. (2017) Alsemgeest et al. (2017) Al-Husseini and Elbeltagi (2016)
Yirdaw (2016)
34,35.36
34,35,36
57
37. Embraces
organisational change 2, 5, 6, 7, 8 34,35,36,37 34
9. Return on
investment 38. Investment by founder 39. Profit focus
40. Monitoring expenses and revenue
41. Target driven
1, 2, 3, 4, 5, 6, 7, 8
1, 2, 3, 4, 5, 6, 7, 8 1, 2, 3, 4, 5, 6, 7, 8
1, 2, 3, 4, 5, 6, 7, 8
Longenecker et al. (2017) Carol et al. (2017) Yan and Levy (2015) Thian et al. (2016)
38, 39, 40, 41
39, 40 38, 39, 41
38, 39, 41 10.
Stakeholders 42. Government institutions’ influence 43. General public
44. Quality assurance bodies
45. Professional bodies 46. Shareholders control and influence
1, 2, 3, 4, 5, 6, 7, 8
1, 2, 3, 4, 5, 6, 7, 8
2, 3, 4, 5, 6, 7, 8
2, 3, 6, 7
1, 2, 3, 4, 5, 6, 7, 8
Botha et al. (2016)
Longenecker et al. (2017) Levy (2015a)
Van Schalkwyk and Steenkamp (2016)
42, 43, 45, 46
42, 43
43, 46
42, 43, 44, 45, 46
11. Society 47. Political changes 48. Community perceptions
49. Student population 50. The public has accepted private providers
1, 2, 3, 4, 5, 6, 7, 8 1, 2, 3, 4, 5, 6, 7, 8
3, 4, 6, 7
1, 2, 3, 4, 5, 6, 7, 8
Botha et al. (2016) Alsemgeest et al. (2017) Akplu (2016)
Strydom et al. (2017)
47, 48 48, 49
47, 48, 49, 50
51, 53, 54
12. Quality 51. Meet expectations of students
52. Meet requirements of CHE
53. Fit for purpose 54. Compliance with regulations
1, 2, 4, 5, 7, 8
1, 2, 3, 4, 5, 6, 7, 8
2, 4, 6, 7
1, 2, 3, 4, 5, 6, 7, 8
Schiffman and Kanuk (2014)
Stander (2017)
CHE (2001; 2016) Van Schalkwyk and Steenkamp (2016)
51, 52, 53, 54
51, 52, 53, 54
51, 52, 53, 54 51, 53
13. Marketing 55. Branding 56. Website 57. Social media 58. Software management 59. Physical infrastructure
1, 2, 5, 6, 8 1, 2, 3, 4, 5, 6, 7, 8 1, 2, 3, 5, 8 2, 5, 6, 8
1, 2, 3, 4, 5, 6, 7, 8
Thian et al. (2016) Longenecker et al. (2017) Lamb et al. (2016)
Hanover Research (2017)
51, 53, 54 55, 59
55, 56, 57, 59
55, 56, 57, 58
14.
Communi-cation 60. Personalised 61. Updated communication 62. Timeous communication 63. Student feedback 64. Tutor feedback
2, 4, 6, 7
1, 3, 4, 5
1, 2, 3, 4, 5, 6, 7, 8
3, 4, 6, 7 4, 6, 7
Goetsch and Davis (2016) Kotler and Keller (2016) Abdallah et al. (2015) Makhitha (2017) Navneet (2016)
59,61, 62
60, 61, 63, 64
60, 61, 62
60, 61, 62 60, 61, 62, 63, 15. Legality 65. CHE compliance
66. DHET compliance 67. Financial and statutory compliance 68. Regulatory bodies’ adherence
1, 2, 3, 4, 5, 6, 7, 8 1, 2, 3, 4, 5, 6, 7, 8 1, 2, 3, 4, 5, 6, 7, 8
1, 2, 3, 4, 5, 6, 7, 8
Navneet (2016) Botha et al. (2016) Jashim(2016)
CHE (2001; 2016)
64 67, 68 67, 68
58
Ethical Clearance: This is a low-risk category study. It was submitted and ethically cleared by the Ethics
Committee of the Faculty of Economic and Management Sciences at the North-West University. After the committee approved the study and classified it as a low-risk study, a study-specific ethics number (EMS14/11/12-01/10) was issued. Criteria with factors loadings of 0.40 and higher are retained provided they do not show strong dual-loading properties (second-factor loading exceeds 0.30) (Pallant, 2010:192). The results also provide a theoretical basis for future researchers and academia of business performance in education or in related research.
4. Results
Reduction of the Measuring Criteria: Exploratory factor analysis offers the advantage to simplify the
dataset; this results in an easier understanding of the results. Simplification, according to Gaskin (2014), not only improves the validity of the analysis, but also enables better application and operationalisation of factor models in practice (Shaikh et al., 2017). In this case, varimax rotation is particularly suitable because it attempts to load criteria strongly onto specific factors, thereby reducing criteria that load onto more than one factor. This makes for easier factor interpretation (Field, 2013:1966). A varimax rotation also maximises the variance explained; this is important in exploratory studies because it offers the researcher a better understanding of the latent variables and their importance (Field, 2013:642).
Furthermore, based on the success of numerous exploratory studies to simplify and purify measuring instruments from dual-loading or low-loading criteria by successfully using exploratory factor analysis (Naidoo, 2011; Fields & Bisschoff, 2013a; 2013b; Bisschoff & Moolla, 2014; Hamid, 2015; Shaikh et al., 2017), the statistical decision criteria that are used are to accept factors if the KMO is equal to or higher than 0.70, Bartlett’s sphericity is smaller or equal to 0.05, and the cumulative variance explained exceeds 60%. Factors’ reliability should equal or exceed Cronbach’s alpha coefficient of 0.70 (Field, 2013:675). The results show that five rounds were required to extract a satisfactory component matrix. Factors were retained as per the Kaiser criterion (where the eigenvalue exceeds or is equal to 1) (Kaiser, 1958:187; Pallant, 2010:184) and also where the eigenvalue exceeds the parallel analysis random matrix (Pallant, 2010:184) (as generated by the parallel analysis engine) (Patil et al., 2007). The results appear in Table 3. Eliminated criteria numbers correspond with Table 2.
Table 3: Purification of the Measuring Criteria
Round Var. EXPL. (%) KMO BART-LETT factors No. of Alpha Criteria eliminated
1 71.57 .920 .000 15 .982 None
2 72.60 .926 .000 12 .979 7.1, 5.6, 6.2, 13.3, 2.6, 3.2, 12.1,
6.4, 11.5, 2.1, 5.4
3 71.64 .927 .000 11 .977 2.5, 2.2, 16.9, 13.2, 6.3, 16.1,
13.1
4 72.26 .925 .000 10 .975 5.2, 16.6, 10.1, 2.3, 5.3
5 70.56 .926 .000 10 .974 7.3, 11.4, 16.12
59
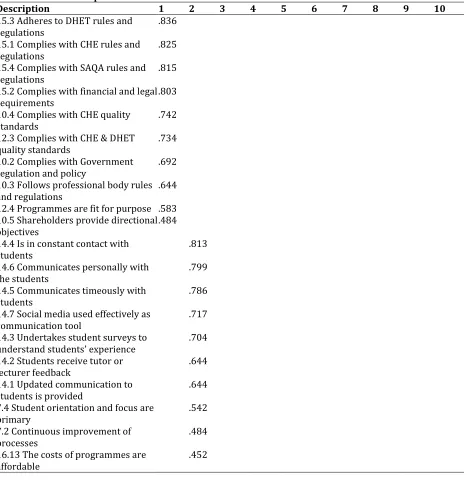
Factor Analysis: The rotated component matrix showing the extracted ten factors and their factor loadings
appears in Table 4. The variance explained and the reliability coefficient of each of the factors appears at the bottom of the table. The variance explained indicates that Factor 1 is the most important factor (18.2%) of the variance, followed by Factor 2 (11.4%), down to the least important Factor 10 (7.5%). The total variance explained (70.56%) shows a very good fit to the data exceeding the margin of 60% with ease (Costello & Osborne, 2005:8; Field, 2013:672). Regarding factor reliability, the first seven factors have excellent reliability coefficients that exceed 0.90, while the last three factors exceed the required margin for this study (0.70) with ease. This means that all the factors are reliable and can be operationalised in practice. In practice, this means that Strategic finance is the biggest predictor of compliance with rules and regulations, followed by Innovation and goal-directed activities, while Political and societal impact has the lowest predictable influence. Therefore, an improvement in Strategic finance will benefit and improve Compliance with rules and regulations more than any other predictors and should be dealt with first as this approach will yield.
Table 4: Rotated Component Matrix
Description 1 2 3 4 5 6 7 8 9 10
15.3 Adheres to DHET rules and
regulations .836
15.1 Complies with CHE rules and
regulations .825
15.4 Complies with SAQA rules and
regulations .815
15.2 Complies with financial and legal
requirements .803
10.4 Complies with CHE quality
standards .742
12.3 Complies with CHE & DHET
quality standards .734
10.2 Complies with Government
regulation and policy .692
10.3 Follows professional body rules
and regulations .644
12.4 Programmes are fit for purpose .583 10.5 Shareholders provide directional
objectives .484
14.4 Is in constant contact with
students .813
14.6 Communicates personally with
the students .799
14.5 Communicates timeously with
students .786
14.7 Social media used effectively as
communication tool .717
14.3 Undertakes student surveys to
understand students’ experience .704 14.2 Students receive tutor or
lecturer feedback .644
14.1 Updated communication to
students is provided .644
7.4 Student orientation and focus are
primary .542
7.2 Continuous improvement of
processes .484
16.13 The costs of programmes are
60
4.5 Students are registered via the
CRM system .785
4.2 The LMS is effective .780
4.4 Uses the latest technology to
communicate with students .736
4.3 Has an online teaching platform .733
4.1 MIS is effective .704
16.2 Human resources training and
development programme exists .487
13.4 Uses software to track and
evaluate marketing efforts .475
13.5 Has excellent infrastructure .450
9.2 Is profitable .766
3.4 Constantly reviewing strategies to
be profitable .696
3.1 Revenue has increased
year-on-year .678
9.1 Expenses and revenue controls
are in place .653
9.3 Targets are aimed at achieving
outcomes .626
3.3 Systems exist to control and
monitor expenses .626
9.4 The founder provided the initial
investment .626
8.4 The focus is on the mission and
vision .729
8.1 Organisational change is
embraced .705
8.3 Innovation is encouraged .681
8.2 Outcomes are achieved by being
goal-directed .634
12.2 Quality student expectations are
the focus .532
16.10 An efficient information
technological (IT) system exists .618
16.11 Empowers the public on the
importance of higher education .607
16.9 Staff are professional in their
interaction with students and public .586
16.8 The organisation is accessible to
students .477
16.7 Excellent infrastructure for
higher education is in place .429
16.4 Promotional campaigns focus on
students .406
1.4 The number of new students
increased year-on-year .705
1.3 Short course offerings have
increased .694
1.5 Students returning to study have
increased year-on-year .671
1.2 Sales targets have been achieved .547
2.4 Market share in SADC has
61
1.1 Cost of the programmes .835
16.3 The price of programmes is
affordable .687
5.1 Programmes offered are value for
money .672
11.3 Political changes affect operations in the various offices outside South Africa
.760
11.1 Perception by society is positive .543
11.2 Society is impacted by the
organisations it serves .435
5.5 Programmes offered to target the
customers or students’ needs .531
6.1 Innovative programmes are
continually developed .527
Variance 13.30 11.66 8.77 8.18 7.60 5.37 4.65 4.93 4.05 2.40
Cum. variance 13.30 24.95 33.71 41.89 49.49 54.87 59.52 64.11 68.16 70.56 Cronbach alpha .952 .938 .902 .899 .923 .907 .780 .773 .785 .702
Extraction Method: Principal component analysis; Rotation method: Varimax with Kaiser normalisation
Rotation converged in 9 iterations.
Discussion of Factors
Factor 1: Regulatory Compliance: The analysis identifies criteria dealing with government regulation, rules
and regulations, therefore compliance, as the most important factor that a private business school should adhere to in their quest to perform well. All the criteria listed show that the myriad of rules and regulations required to register and operate as a private business school by different governing bodies are key issues to adhere to. Factor 1 is the most important factor and explains a variance of 13.30%.
Factor 2: Strategic Communication: The second most important factor deals with issues pertaining to
strategic communication and the role it plays in supporting a desirable student/customer experience. Strategic communication is an important tool by an institution to explain and fulfil its mission (Hallahan et al., 2007:20), while strategic communication between customer and institution also plays an important role in business performance (Roberts, 2018). This high factor rating of 11.6% of the variance demonstrates the importance of strategic communication.
Factor 3: Educational Technology Stack: Factor 3 identifies criteria dealing with technology as the third
most important factor. Technology has an impact on business operations and performance. Technology has the ability to improve the financial position, enables faster communication (Holyoak, 2017), it also allows for innovation that keeps employees more engaged as well as increases capacity of the business to do more and ultimately saves time and money (SBDC Oklahoma, 2017). With the fourth industrial revolution, the educational technology stack having the best of breed technologies is to be looked at more closely as this is the way of the future in PHE and education in general. The factor explains 8.77% of the variance.
Factor 4: Strategic Finance: Factor 4 deals with strategy and finance. Various studies indicate that strategy
62
Factor 5: Organisational Development: Factor 5 deals with the mission and vision and embracing
innovation. Organisational development focuses on fulfilling the mission and vision as well as embracing changes that take place internally and externally of the organisation. Change is constant and to embrace the change is critical for the survival of any organisation (Carnall, 2018); this is especially true in relation to the changes in compliance required by the CHE and DHET. In the case of South Africa, the PHEI environment is constantly affected by the changes in regulations and compliance requirements in addition to the typical challenges experienced by other business environments (such as the economic factors of the country) (Wride, 2017). Therefore, PHEIs have to be strategic in the manner that they approach the achievement of their goals and outcomes. The factor explains 7.60% of the variance.
Factor 6: Customer Orientation: Factor 6 focuses on customer orientation. Customer orientation has a
direct impact on the sales and delivery of the product or service of any organisation as well as an impact post-delivery of the service (Kasemsap, 2017:126). Customer orientation relates to service post-delivery, which includes areas of reliability, responsiveness and having empathy. This creates a view that the organisation is in contact with society in general and focuses on the needs of the customer (Orville, Walker & Mullins, 2014:253) Customer orientation and community involvement in PHE are critical for success in the higher education sector. Factor 6 explains 5.37% of the variance.
Factor 7: Sales: Factor 7 deals with increasing sales of programmes, both formal and short courses. Sales, as
a result of marketing efforts, facilitate the flow of income into the PHEI. Resultantly, higher sales, either by geographic market expansion or market penetration, would increase income flows of PHEIs. Additionally, important to PHEIs are student retention and to lock students in for the full study time by ensuring that they complete their studies by moving from year to year in their programme. Ideally, continued or advanced training and education following a first qualification should also be actively marketed to the current student base. This factor ties in well with Factors 4 and 10, Strategic finance and Customer service, respectively. Factor 7 explains 4.65% of the variance.
Factor 8: Pricing: Factor 8 deals with the pricing of programmes being offered at an affordable price that
provides value for money to students. The founding principles of being affordable and being accredited are adhered to in this factor. The pricing of service is critical to ensure that profits are achieved. In so doing, the right price has to be charged for the service delivered. Substantial growth in revenue and market share depends on the pricing model developed for the product or service (Nagle & Müller, 2017:2-4). The right price for the programmes offered in PHEI is important for the suitability and profitability of the institution. Factor 8 explains 4.93% of the variance.
Factor 9: Socio-Political Influence: Socio-political factors, which include society and the political or
regulatory environment, are dealt with in this factor. Socio-political influence refers to both the impact and interaction of social elements and political elements on an organisation (Complexity Labs, 2018). PHEIs are affected by both the political system that is highly regulated and controlled as well as the social dimension due to the demand for higher education to meet the government objectives of increasing the entry into higher education. This business environment has an impact on the operations and their sustainability of PHEIs. Factor 9 is the second least important and explains 4.05% of the variance.
Factor 10: Market Focus: Factor 10 is the last factor and focuses on being responsive to market and student
63
Factor Correlations and Multiple Regression Analysis: Pearson correlation coefficients were used to
determine the inter-factor correlations. All the factors showed high inter-factor correlations (p≤0.1; 0.70>r>0.35). Although correlations between factors (p≤0.1; r≥0.30) (Pallant, 2010:185) are expected, cases where high correlations exist require further investigation. Various authors (Basilevsky, 1981; Carvalho, 2008; Field, 2013; Arayesh, 2015) suggest that multiple regression is suitable to determine whether the most important factor is influenced by the lesser important ones, and if so, to what extent. In this study, Factor 1: Regulatory compliance to rules and regulations is the most important factor because it explains the highest variance; Factor 1 then serves as the dependent variable with Factors 2 to 10 as the independent factors. The results appear in Table 5.
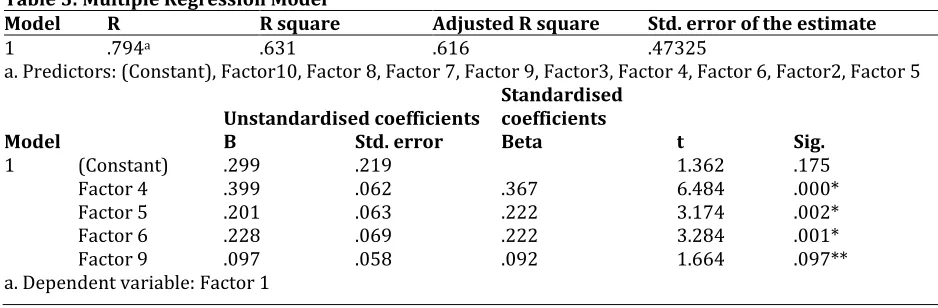
Table 5: Multiple Regression Model
Model R R square Adjusted R square Std. error of the estimate
1 .794a .631 .616 .47325
a. Predictors: (Constant), Factor10, Factor 8, Factor 7, Factor 9, Factor3, Factor 4, Factor 6, Factor2, Factor 5
Model Unstandardised coefficients
Standardised coefficients
t Sig.
B Std. error Beta
1 (Constant) .299 .219 1.362 .175
Factor 4 .399 .062 .367 6.484 .000*
Factor 5 .201 .063 .222 3.174 .002*
Factor 6 .228 .069 .222 3.284 .001*
Factor 9 .097 .058 .092 1.664 .097**
a. Dependent variable: Factor 1 * p≤0.05; ** p≤0.10
The table shows that the calculated variance is R2=.631 (adjusted R2=.616). This means that a satisfactory
63.1% of the variance in Factor 1 is explained by the four factors (Factors 4, 5, 6 and 9). These four independent variables are significant (Factors 4, 5 & 6: p≤0.05; Factor 9: p≤0.10) and contribute (as per standardised beta coefficients) regression weights of .367, .222, .222 and .092, respectively, to the variance of Factor 1.
The Regression Function Then Constitutes:
Compliance to rules and regulations (Y) = (.367 x Strategic finance) + (.222 x Innovation and goal directed) + (.222 x Visibility) + (.092 x Political and societal impact)
A Model to Measure the Business Performance of PHEIs: The factor analyses identified ten factors from
64
Figure 1: Business Performance Factors of PHEs
Figure 1 shows the ten factors. Noteworthy is that the factor structure does not possess any sub-factors within any of the ten identified factors. This means that each factor, in essence, is pure in nature and does represent business performance factors per se (Shaikh et al., 2017). The figure also shows the respective variance explained by each factor (as indicators of each factor’s relative importance), their reliability and the factors as they were labelled. The findings of the model are partially supported (and in some cases also contradicted) by other researchers. In a study by the Advanced Institute of Management Research (2006:10), three factors are directly supported by their findings. They are Factor 1 (Regulatory compliance with rules and regulations), Factor 7 (Sales) and Factor 8 (Pricing). Their study also identified the most important factor as Regulatory compliance and rules and regulations, while Sales and Pricing were both factors that the institute identified as important educational performance factors.
65
Soriano (2010:468) also investigated student fees and government grants as a means to assist students with tuition fees. Faculty identified recruitment and retention of experienced faculty members and leadership to guide the business school. However, it is interesting to note that these three factors and their descriptions embed and support most of the factors identified in this study. Regarding Factor 10 (Customer and student-centric) Webster, Hammond and Rothwell (2014:15) support the findings of this research by stating that factors influencing American business schools’ performance include being a member of a professional accreditation board (such as the Association of MBAs or the Association to Advance Collegiate Schools of Business), students as the customers of the institution and marketing efforts to increase student numbers in the business school and to increase student retention in the business school. Webster et al. (2014:18) also support re-registration and returning students as a means to increase sales and market share.
5. Conclusion
From the analysis, the following conclusions can be drawn.
Conclusions 1 and 2: This article identified business performance antecedents and its respective measuring
criteria. Strongly literature orientated, the study identified 16 business performance antecedents, measured in total by 68 criteria. The study scientifically reduced the 16 antecedents to a more manageable ten factors, measured by 59 criteria (thereby reducing the measuring criteria by 9). It is concluded that the study succeeded to significantly simplifying the model to measure business performance in business schools. Based on the conclusion above, it is also concluded that the simplification of the model now enables an easier operationalisation of the model in the industry, thereby putting academic research to use in practice.
Conclusions 3 and 4: The success of simplifying the model and achieving satisfactory reliability and validity
can be attributed to high sampling adequacy as measured by Kaiser-Meyer-Olkin (KMO). (This study had a KMO value of .923.). Additionally, sphericity (as measured by Bartlett) measures whether the data is suitable for factor analysis. The statistics showed that the chi-square was estimated at 319.885 at 10 degrees of freedom. Bartlett’s test shows that sphericity was significant with a value well below the 0.05 significance level. The cumulative variance, as explained by the five factors, is also satisfactory at 70.56%. It is therefore concluded that to successfully develop or simplify a model: An adequate sample was obtained; and Sphericity was tested to ensure the suitability of the data to be subjected to further analysis. Without these gatekeeper statistics, the attempts to develop a model are risky. However, the statistics show that, the employment of factor analysis to develop the conceptual model was a low-risk venture.
Conclusion 5: Regulatory compliance with rules and regulations is the most important factor. In this case, the
model shows that PHEIs should focus on retaining their compliance in the private higher education sector. This constitutes a competitive advantage because the barriers to enter higher education are high and complex, keeping new entrants effectively out of the market. In addition, existing PHEIs cannot compromise to lose their licence to operate.
Conclusion 6: In addition to the conclusion above, leaders of private higher education institutions should
also focus on regular communication, technology and development, strategic finance, innovation and goal-directed, visibility, sales, pricing, political and societal impacts and to be customer- and student-centric, to successfully negotiate the complex challenges to manage PHEIs. The high correlations between the factors clearly indicated that the factors all influence one another; therefore, a positive managerial change in one factor will also positively influence the other factors. This facilitates a better return on managerial inputs because it stimulates positive synergetic forces between the factors.
Summary: In this article, the latent variables or factors to business performance in business schools have
66
PHEIs. The factors, therefore, present a managerial tool for executives in PHEIs to employ if they want to measure the factors of their institutions and improve their business performance.
References
Advanced Institute of Management Research. (2006). The future of business schools in the United Kingdom. London: London Business School.
Abdallah, Q. B., Ghaith, M., Al-Abdallah, A. & Alkharabsheh, A. M. (2015). Determinants of continuance intention to use Social Networking Sites (SNS’s): Studying the case of Facebook. International Journal
of Marketing Studies, 7(4), 121-135.
Akplu, H. F. (2016). Private participation in higher education in sub-Saharan Africa.
Al-Husseini, S. & Elbeltagi, I. (2016). Transformational leadership and innovation: a comparison study between Iraq's public and private higher education. Studies in Higher Education, 4(1), 159-181. Alsemgeest, L., Booysen, K., Bosch, A., Boshoff, S., Botha, S., Cunningham, P., Henrico, A., Musengi-Ajulu, S. &
Visser, K. (2017). Introduction to business management: A fresh perspective. 2nd ed. Upper Saddle
River, NJ: Pearson.
Altbach, P. (2015). Higher education and the WTO: Globalization run amok. Boston, MA: Centre for International Higher Education.
Arayesh, M. B. (2015). Regression analysis of effective factors on increasing factors on trainer's motivation of the Red Crescent Society (A case study of Islam, Iran). Social and Behavioral Sciences, 20(5), 536-541 Basilevsky, A. (1981). Regression and factor analysis. Canadian Journal of Statistics, 9(1), 91-107.
Bateman, T. S. & Snell, S. A. (2015). Management. (11th ed.). New York, NY: McGraw Hill.
Belch, G. E. & Belch, M. A. (2015). Advertising and promotion. (10th ed.). Singapore: McGraw Hill.
Bester, S. M. (2018). Toward constructing a psychosocial model of career wellbeing for the South African working adult. (Doctoral dissertation). Pretoria: University of Pretoria.
Bezuidenhout, G. & De Jager, J. (2014). Customer satisfaction at PHEIs in South Africa: an importance-performance analysis. Journal of Contemporary Management, 11(1), 206-229.
Bisschoff, C. A. & Moolla, A. I. (2014). A simplified model to measure brand loyalty. Proceedings of the 2nd
International Conference on Contemporary Marketing Issues (ICCMI), Athens, Greece. June 18-20, 1113-1119.
Botha, T., Bimha, A., Grobler, A., Chodokufa, K., Cronje, L., Eccles, N. & Cohen, T. (2016). Corporate Citizenship. Cape Town: Oxford.
Carnall, C. (2018). Managing change. London: Routledge.
Carol, C., Chivaka, R., Fourie, H., Joubert, D., Haji, A. M., Pienaar, A., Stack, L., Streng, J., Swartz, G. & Williams, J. (2017). Principles of management accounting. A South African perspective. Cape Town: Oxford. Carvalho, C. M. (2008). High-dimensional sparse factor modelling: applications in gene expression genomics.
Journal of the American Statistical Association, 103(484), 1438-1456.
Child, D. (2006). The essentials of factor analysis. (3rd ed.). New York, NY: Continuum International.
IBM SPSS. (2018). IBM Statistical Package for Social Services (Version 25). Seattle, WA: IBM. Coetsee, L. D. (2002). Peak performance and productivity. Vanderbijlpark: Ons Drukkers.
Collins Dictionary. (2017). Collins Dictionary: Word of the year 2017. https://www.collinsdictionary.com Last accessed 1 February 2018).
Collins English Dictionary. (2017). Collins Dictionary: Socio-political definition and meaning. https://www.collinsdictionary.com/dictionary/english/sociopolitical Last accessed 27 August 2018. Complexity Labs. (2018). Socio-political systems. http://complexitylabs.io/sociopolitical-systems/ Last
accessed 27 August 2018.
Cortina, J. M. (1993). What is coefficient alpha? An examination of theory and applications. Journal of Applied
Psychology, 78(1), 98-104.
Costello, A. & Osborne, J. (2005). Best practices in exploratory factor analysis: Four recommendations for getting the most from your analysis. Practical Assessment, Research & Evaluation, 10, 1-9.
Council on Higher Education (CHE). (2001). Founding documents. Pretoria: State Printers.
Council on Higher Education (CHE). (2016). South African higher education reviewed: Two decades of democracy. Pretoria: State Printers.
67
De Meyer, C., Human, D., Maduku, D., Meintjie, C. & Nel, J. (2017). Principles of marketing. Cape Town: Oxford. Eaton, P. & Willoughby, S. D. (2018). Confirmatory factor analysis applied to the force concept inventory.
Physical Review Physics Education Research, 14(1), 101-124.
Field, A. (2013). Discovering statistics using SPSS. (4th ed.). London: Sage.
Fields, Z. & Bisschoff, C. A. (2013a). A model to measure creativity in young adults. Journal of Social Sciences, 37(1), 55-67.
Fields, Z. & Bisschoff, C. A. (2013b). A theoretical model to measure creativity at a university. Journal of Social
Sciences, 34(1), 47-59.
Fields, Z. & Bisschoff, C. A. (2014). Comparative analysis of two conceptual frameworks to measure creativity at a university. Problems and Perspectives in Management, 12(3), 46-58
Gaskin, J. E. (2014). Exploratory factor analysis.
Geldenhuys, P. (2018). Business Unusual – Harnessing the promise of the future.
Goetsch, D. L. & Davis, S. B. (2016). Quality management for organizational excellence. Introduction to total quality. (8th ed.). Upper Saddle River, NJ: Pearson Education.
Hallahan, K., Holtzhausen, D., Van Ruler, B., Verčič, D. & Sriramesh, K. (2007). Defining strategic communication. International Journal of Strategic Communication, 1(1), 3-35.
Hanover Research Report. 2017. Industry Trend Report of the United States. New York, NY: Hanover.
Hanushek, E. A. (2016). Will higher education improve economic growth? Oxford Review of Economic Policy, 32(4), 538-552.
Harman, H. H. (1976). Modern factor analysis. (3rd revised ed.). Chicago, IL: University of Chicago.
Hassan, R. A. (2016). Self-efficacy and self-independence in promoting self-employment intention among university students. Journal of Research in Business, Economics and Management, 6(2), 888-893. Hill, C. R. & Hughes, J. N. (2007). Examination of the convergent and discriminant validity of the strengths and
difficulties questionnaire. School Psychology Quarterly, 22(3), 380-406, September.
Holyoak, J. (2017). The importance of technology in business. https://marketing.pinecc.com/blog/why-is-technology-important-in-business-pine-coves-top-10-reasons Last accessed 21 August 2018.
Jashim, U. A. (2016). Massification to marketization of higher education: private university education in Bangladesh. Higher Education for the Future, 3(1), 76-92.
Kaiser, H. F. (1958). The varimax criterion for analytic rotation in factor analysis. Psychometrika, 23, 187. Kargić, L. & Poturak, M. (2014). Factors that influence state or private university selection. European Journal
of Contemporary Education, 9(3), 149-159.
Kasemsap, K. (2017). Mastering customer service, customer experience, and customer orientation in the hospitality and tourism industry. In: Handbook of research on holistic optimization techniques in the hospitality, tourism, and travel industry (pp. 115-140). IGI Global.
Kerlunger, F. N. (1973). Foundations of behavioural research. (2nd ed.). New York, NY: Holt, Rhinehart &
Winston.
Khalid, N. M. (2014). Factors affecting course satisfaction of online Malaysian university students. (Theses - PhD). Fort Collins, CO: Colorado State University.
Kotler, P. & Keller, K. L. (2016). Marketing Management. (15th ed.). Boston, MA: Pearson.
Laerd, J. (2018). Sphericity. https://statistics.laerd.com/statistical-guides/sphericity-statistical-guide.php. Last accessed 21 July 2018.
Lamb, C. W., Hair, J. F. & McDaniel, C. (Jr.). (2016). Principles of marketing. Boston, MA: Cengage Learning. Lei, J. (2012). Striving for survival and success: Chinese private higher education in the twenty‐first century.
On the Horizon, 20(4), 274-283.
Levy, D. (2015a). For-profit versus non-profit private higher education. International higher education (No. 54). Boston, MA: Center for International Higher Education.
Levy, D. (2015b). Private higher education: patterns and trends. (No. 50). Boston, MA: Center for International Higher Education.
Longenecker, J. G., Petty, J. W., Palich, L. E. & Hoy, F. (2017). Small business management: launching & growing entrepreneurial ventures. (16th ed.). Mason, OH: Cengage.
Makhitha, K. M. (2017). The impact of independent retailers’ relationship marketing practices on business performance. Journal of Contemporary Management, 14, 645-673.
68
Mbuya, J. M. & Schachtebeck, C. (2016). Future entrepreneurs: Does the field of study matter? A comparison of students in a South African urban environment. Problems and Perspectives in Management, 14, 228-235.
McGrath, D. (2015). Geography, Skills and local companies affect the impact of higher education on economic development. International Journal of Educational Development, 43, 22-31, July.
Nagle, T. T. & Müller, G. (2017). The strategy and tactics of pricing: A guide to growing more profitably. London: Routledge.
Naidoo, K. (2011). Stress management and its impact on work performance of educators in public schools in KwaZulu-Natal. (Thesis - PhD). Potchefstroom: North-West University.
Imandin, L., Bisschoff, C. A., Botha, C. J. (2016). Confirmatory analysis of the model to measure employee engagement. Problems and Perspectives in Management, 14(2), 93-103.
Navneet, J. & Ovum, M. (2017). Trends to watch in higher education. IT as an enabler of innovation and competitive institutional differentiation.
Orville, C., Walker, J. R. & Mullins, J. W. (2014). Marketing strategy. (8th ed.). Singapore: McGraw-Hill.
Osborne, J. W., Costello, A. B. & Kellow, J. T. (2014). Best practices in exploratory factor analysis. Charleston, SC: Create Space Independent Publishing Platform.
Pallant, J. (2013). The SPSS survival manual. London: McGraw-Hill Education.
Patel, V. (2015). Exploratory Factor Analysis: Using SPSS. Workshop: National Level Two Week Faculty Development Programme on Advanced Data Analysis for Business Research Using Statistical Packages. Washington, DC: Georgetown University. June 22-July 5, 2015.
Patil, S., Singh, N., Mishra, S. & Donavan, T. D. (2008). Efficient theory development and factor retention criteria: Abandon the ‘eigenvalue greater than one’ criterion. Journal of Business Research, 61(2), 162-179.
Price Water House Coopers (PWC). (2017). Perspectives in higher education 2017. Roberts, J. (2018). Open textbook network: Session 1.
Samuels, P. (2016). Advice on exploratory factor analysis. Birmingham: University of Birmingham. SBDC Oklahoma. (2017). Why is technology important in business?
Schiffman, L. & Kanuk, L. (2014). Consumer behaviour: Global and Southern African perspectives. (10th ed.).
Cape Town: Pearson Education.
Sekaran, U. & Bougie, R. (2003). Research methods for business: A skill building approach. (4th ed.). New York,
NY: Wiley.
Hamid, A. Z. (2015). Stress management and its impact on work performance of Swaziland educators. (Thesis – PhD). Potchefstroom: North-West University.
Shaikh, A. S. C., Bisschoff, C. A. & Botha, C. J. (2017). Identifying factors to measure managerial and leadership competence of business school educated managers. International Review of Management and
Marketing, 7(5), 140-152.
Singh, D., Pattnaik, C., Gaur, A. S. & Ketencioglu, E. (2018). Corporate expansion during pro-market reforms in emerging markets: The contingent value of group affiliation and diversification. Journal of Business
Research, 82(4), 220-229.
Soriano, D. R. (2010). Management factors affecting the performance of technology firms. Journal of Business
Research, 63(5), 463-470.
South Africa (SA). (2012). The National Development Plan.
South Africa Population. (2018). Population statistics (2018-06-16).
South African Government. (2012). National Development Plan 2030. Our future make it work. Pretoria: State printers.
Stander, E. & Herman, C. (2017). Barriers and challenges private higher education institutions face in the management of quality assurance in South Africa. South African Journal of Higher Education, 31(5), 206-224.
Stander, E. (2017). Managing quality assurance in private higher education institutions in South Africa. Pretoria: University of Pretoria.
Strydom, J. K., Oosthuizen, T., Rudansky-Kloppers, S., De Beer, A., Holtzhausen, M, Steenkamp, R., Maritz, M., Bruwer, J. P. & Nieuwenhuizen, C. (2017). Principles of business management. (3rd ed.). Cape Town:
69
Thian, L. B., Alam, G. M. & Idris, A. R. (2016). Balancing managerial and academic values: Mid-level academic management at a private university in Malaysia. International Journal of Educational Management, 30(2), 308-322.
Tryfos, P. (1997). Factor analysis. http://www.yorku.ca/ptryfos/f1400.pdf Last accessed 10 August 2018. University of Oxford. 2017. International trends in higher education.
Thompson, A., Strickland, A., Peteraf, M. & Gamble, J. E. (2018). The Quest for Competitive Advantage: Concepts and Cases. New York, NY: McGraw-Hill Education.
Van Looy, A. & Shafagatova, A. (2016). Business process performance measurement: a structured literature review of indicators, measures and metrics. Springer Plus, 5(1), 1797.
Van Schalkwyk, D. & Steenkamp, R. J. (2016). A top management perspective of total quality service dimensions for Private Higher Education Institutions in South Africa. Southern African Business
Review, 20, 577-299.
Vendrell-Herrero, F., Gomes, E., Mellahi, K. & Child, J. (2017). Building international business bridges in geographically isolated areas: The role of foreign market focus and outward looking competences in Latin American SMEs. Journal of World Business, 52(4), 489-502.
Webster, R. L., Hammond, K. L. & Rothwell, J. C. (2014). Market orientation effects on business school performance: views from inside and outside the business school. American Journal of Business
Education, 7(1), 9-20.
WorldoMeter. (2018). Southern Africa live population figures. http://www.worldometers.info/world-population/south-africa-population/ Last accessed 2 August 2018.
Wride, M. (2017). What’s the difference between human resources and organizational development? Yan, F. & Levy, D. (2015). China's new private education law. International Higher Education, 31(10), 9-10. Yirdaw, A. (2016). Quality of education in private higher institutions in Ethiopia: The role of governance. Sage
Open Access, 6(1), 1-12.
Yong, A. G. & Pearce, S. (2013). A beginner’s guide to factor analysis: Focusing on exploratory factor analysis.
Tutorials in Quantitative Methods for Psychology, 9(2), 79-94.
List of Abbreviations
CHE Council for Higher Education CFA Confirmatory factor analysis
DHET Department of Higher Education and Training EFA Exploratory factor analysis
HE Higher education KMO Kaiser, Meyer & Olkin PCA Principal Component analysis PHE Private higher education