IJPAR |Vol.8 | Issue 1 | Jan – Mar - 2019 Journal Home page: www.ijpar.com
Research article Open Access
Stability Indicating Method Development and Validation for the Estimation
of Escitalopram and L-Methylfolate in Bulk and Pharmaceutical Dosage
Form by RP -HPLC
Vijaya Laxmi
1, Mrs.A.Srividya
2, Dr.K.Abbulu
3 1M.Pharmacy, Department of Pharmaceutical Analysis & Quality Assurance, CMR College of Pharmacy, Hyderabad
2
M Pharmacy, Assistant Professor for Department of Pharmaceutical Analysis & Quality Assurance, CMR College of Pharmacy, Hyderabad
3
Principle of CMR College of Pharmacy, Hyderabad
*Corresponding Author:Mrs.A.Srividya
Email: [email protected]
ABSTRACT
In the presented work the stability indicating RP-HPLC method was developed for the simultaneous estimation of the L-methyl folate and Escitalopram in bulk and pharmaceutical dosage form .The L methyl folate and Escitalopram were analysed through Std BDS C18 150 x 4.6 mm, 5.Using the mobile phase consisting of (0.01N KH2PO4
buffer: Acetonitrile)(50:50,v/v) with a flow rate of 0.9ml/min. The wavelength was selected at 230 nm using uv detection. The L Methyl folate and Escitalopram were eluted at 2.232min and 3.279min respectively. The drug was stressed under alkaline, oxidative, thermal, photolytic degradation were analysed. The developed method was validated as per ICH guidelines The Accuracy, Linearity, Precision, and Robustness were within the acceptance limits .Hence this HPLC method was a stability indicating method can be used for routine stability analysis of the Escitalopram and l methyl folate in Pharmaceutical dosage forms.
Keywords:L-methyl folate, Escitalopram, RP-HPLC.
INTRODUCTION
L-methyl folate
The chemically (2S)-2-[[4-[(2-amino-4-oxo-1H-pteridin-6-yl) methylamino] benzoyl] amino] pentanedioic acid is a B complex vitamin containing a pteridine moiety linked by a methylene bridge to Para-amino benzoic acid, which is joined by a peptide linkage to glutamic acid. Levomefolic acid was
primary biologically active form of folic acid used at the cellular level for DNA reproduction. A-vitamin (B9) essential to human health and function. One of its most notable functions is its role in creating key neurotransmitters or brain chemicals that regulate human mood, cognitive ability and arousal. L
The three primary brain chemicals are dopamine, nor epinephrine and serotonin. Folic acid is soluble in 1 M NaOH (50 mg/ml).The free acid is only slightly soluble in water (0.01 mg/ml) at 0 °C.
Escitalopram
Escitalopram oxalate (trade names Lexapro, Cipralex). The chemically it is a [(s)-1-[3(dimethlyamino) propyl]-1-(4-flurophenyl)-1,3- dihydro isobenzofuran-5-carbonitrile oxalate] is a pure s- enantiomer of the racemic, bicyclic pthalates derivatives citalopram. It is mainly used as an antidepressant agent. ESC is a selective serotonin reuptake inhibitor (SSRI). It is the pure S-enantiomer (single isomer) of the racemic bicyclic phthalane derivative of citalopram. The antidepressant action of ESC, the S-enantiomer of racemic citalopram, is presumed to be linked to the potential of Serotonergic activity in the central nervous system (CNS) neuronal reuptake of serotonin (5HT). Escitalopram is freely soluble in methanol and dimethly sulfoxide (DMSO), sparingly soluble in water and in ethanol, slightly soluble in ethyl acetate, insoluble in Heptane.
MATERIALS AND METHODS
Chemicals and Reagents
Acetonitrile (HPLC grade), orthophosphoric acid (HPLC grade), water (HPLC grade) were purchased from Mark (India) Ltd, Worli, Mumbai, India. All active pharmaceutical ingredients (APIs) of Escitalopram and L Methyl folate as reference standards were procured from Spectrum Pharma labs, Hyderabad, India.
Instrumentation
In the present study Performed with Waters HPLC 2695 Photo diode array detector and Empower 2 software was used UV-Visible spectrophotometer PG Instruments T60 with special bandwidth of 2 mm and10mm and matched quartz cells integrated with UV win 6 Software was used for measuring absorbances of L-methyl folate and Escitalopram. Electronics Balance-Denver, PH meter -BVK enterprises, India, Ultrasonicator-BVK enterprises
Determination of maximum absorbance
L-Methyl folate and Escitalopram standard
Escitalopram shows maximum absorbance at 230nm.The wave length selected for the determination of L-Methyl folate and Escitalopram is 230nm.
Diluent
Based up on the solubility of the drugs, diluents was selected, Acetonitrile and Water taken the in the ratio of 50:50.
Preparation of Standard stock solutions
Accurately weighed 37.5 mg of L-methyl folate, 50 mg of Escitalopram and transferred to individual 50 ml volumetric flasks separately. 3/4 diluents was added to both of these flasks and sonicated for 10 minutes. Flasks were made up with diluents and labeled as Standard stock solution 1and 2. (750µg/ml of L-methyl folate and 1000µg/ml of Escitalopram).
Preparation of Standard working solutions (100% solution)
1ml from each stock solution was pipetted out and taken into a 10ml volumetric flask and made up with diluent. (75µg/ml L-methyl folate of and 100µg/ml of Escitalopram)
Preparation of Sample stock solutions
5 tablets were weighed and the average weight of each tablet was calculated, then the weight equivalent to 1 tablet was transferred into a 25 ml volumetric flask, 5ml of diluents was added and sonicated for 25 min, further the volume was made up with diluent and filtered by HPLC filters(300µg/ml of L-methyl folate and 400µg/ml of Escitalopram.
Preparation of Sample working solutions (100% solution)
2.5ml of filtered sample stock solution was transferred to 10ml volumetric flask and made up with diluent. (75µg/ml of L-methyl folate and 100µg/ml of Escitalopram)
Preparation of buffer 0.1% OPABuffer
0.01N KH2PO4
Dissolve 1.36g of potassium dihydrogen Phosphate (KH2PO4) in 1 liter volume distilled
water.
RESULTS AND DISCUSSION
Optimization of chromatographic conditions
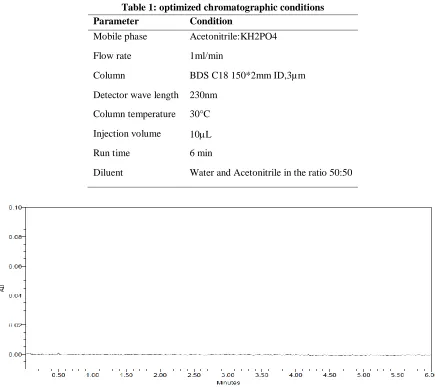
To develop a stability indicating RP-HPLC method for estimation of Escitalopram and L methyl folate in bulk and tablet dosage forms, different preliminary tests were performed and different chromatographic conditions were tested and optimized chromatographic conditions were developed which were given in Table-1.The final
analysis was performed by using 50% 0.01N KH2PO4 acid:50% Acetonitrile at a flow rate of 0.9ml/min, samples were analyzed at 230 nm detector wave length and at an injection volume of 10 μL using BDS C18 4.6 x 250mm, 5µm with run time of 6 min. The proposed method Escitalopram and L methyl folate was optimized to give sharp peak with good resolution and minimum tailing effect for the optimized chromatogram was obtained as shown in .
Analytical method validation
The analytical validation of l methyl folate and Escitalopram by HPLC was carried out with respect to the following parameters.
Table 1: optimized chromatographic conditions
Parameter Condition
Mobile phase Acetonitrile:KH2PO4
Flow rate 1ml/min
Column BDS C18 150*2mm ID,3µm
Detector wave length 230nm
Column temperature 30°C
Injection volume 10L
Run time 6 min
Diluent Water and Acetonitrile in the ratio 50:50
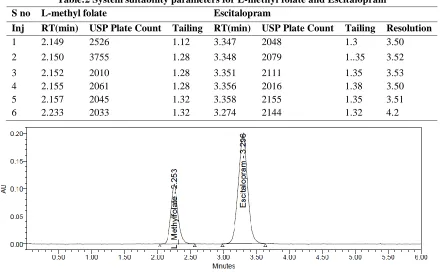
Standard chromatogram of L methyl folate and Escitalopram
Table:2 System suitability parameters for L-methyl folate and Escitalopram
S no L-methyl folate Escitalopram
Inj RT(min) USP Plate Count Tailing RT(min) USP Plate Count Tailing Resolution
1 2.149 2526 1.12 3.347 2048 1.3 3.50
2 2.150 3755 1.28 3.348 2079 1..35 3.52
3 2.152 2010 1.28 3.351 2111 1.35 3.53
4 2.155 2061 1.28 3.356 2016 1.38 3.50
5 2.157 2045 1.32 3.358 2155 1.35 3.51
6 2.233 2033 1.32 3.274 2144 1.32 4.2
Formulation chromatogram Linearity
Linearity of Escitalopram and l methyl folate were found by injecting six different concentrations of working standard solutions for Lmethyl folate(18.75–112.5 μg/ml)and Escitalopram (25–150 μg/mL ).Standard calibration
curves were constructed by taking mean peak area on Y-axis and concentrations of drug on X-axis. The linearity equations obtained for L-methyl folate was y = 10382x + 1423 and of Escitalopram was y = 18260x + 7600. Correlation coefficient obtained was 0.999 for the two drugs. The results were shoen in table 3.
Table 3 : Results for the linearity of L methyl folate and Escitalopram L-methyl folate Escitalopram
Conc (μg/mL) Peak area Conc (μg/mL) Peak area
37.5 1845323 50 922662
56.25 2734697 75 1367349
75 3770350 100 1885175
93.75 4594156 125 2297078
112.5 5424428 150 2712214
Calibration curve of L-methyl folate
Calibration curve of Escitalopram
Precision
The system precision was established by six repli-cate injections of the standard solution containing analytes of interest. The value of relative standard deviation of l methyl folate and Escitalopram and was found to be 0.4 and 0.7 within the limit, indicating the injection
repeatability of the method. The method precision was established by carrying out the analysis six times using the proposed method. The relative standard deviation of l methyl folate and escitalopram was found to be 0.6 and 0.7 within the limit, indicating the injection repeatability of the method.
Table:4 Precision data for of L-methyl folate and Escitalopram
S. No L methyl folate Escitalopram L-methyl folate Escitalopram
System precision Method precision
y = 10382x + 1423.9 R² = 0.9998
0 200000 400000 600000 800000 1000000 1200000 1400000
0 20 40 60 80 100 120
y = 18260x + 7600.1 R² = 0.9993
0 500000 1000000 1500000 2000000 2500000 3000000
1. 775880 1901818 764441 1901818
2. 777612 1914986 767612 1914986
3. 780619 1899153 770619 1899153
4. 783307 1876148 759307 1880471
5. 775703 1902676 765703 1912392
6. 781867 1885152 771867 1885152
Mean 779165 1896656 766592 1898995
S.D 3217.4 13842.2 4551.3 13985.4
%RSD 0.4 0.7 0.6 0.7
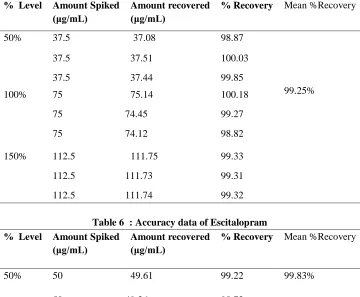
Accuracy
To demonstrate the accuracy of the proposed method a standard addition method was used for analyzing the samples. For this purpose, known amounts of l methyl folate and Escitalopram were supplemented to the working standard sample
solution which was previously analyzed and then compared the obtained experimental values to the true values. Each solution was injected in six times and the percentage recovery was calculated. %Recovery was obtained as 99.25% and 99.83% for L-methyl folate and Escitalopram respectively.
Table 5: Accuracy data of L-methyl folate
% Level Amount Spiked
(μg/mL)
Amount recovered (μg/mL)
% Recovery Mean %Recovery
50% 37.5 37.08 98.87
99.25%
37.5 37.51 100.03
37.5 37.44 99.85
100% 75 75.14 100.18
75 74.45 99.27
75 74.12 98.82
150% 112.5 111.75 99.33
112.5 111.73 99.31
112.5 111.74 99.32
Table 6 : Accuracy data of Escitalopram
% Level Amount Spiked
(μg/mL)
Amount recovered (μg/mL)
% Recovery Mean %Recovery
50% 50 49.61 99.22 99.83%
100% 100 99.85 99.85
100 99.45 99.45
100 100.07 100.07
150% 150 148.42 98.95
150 148.73 99.16
150 148.66 99.10
Robustness
The different variations such as variation of pH of the buffer solution, flow rate, wavelength and mobile phase composition. The deliberate changes in the method have not much affected the peak
tailing, Theoretical plates and the percent assay. This indicated the robustness of the method. The robustness study results are presented in table.
Table7: Robustness data for L-methyl folate and Escitalopram.
S.no Condition Change %RSD of L-methyl folate % RSD of Escitalopram
1
Flow rate- 1 0.8ml/min 0.3 0.4
2 Flow rate- 2 1.0ml/min 0.3 0.5
2 Mobile phase-1 40:60(%v/v) 0.7 0.7
3 Mobile phase-2 60:40(%v/v) 0.4 0.5
4 Temperature -1 25°C 0.2 0.2
5 Temperature -2 35°C 0.3 0.3
Limit of Detection and Quantification Limit
Determination of the Limit of Detection and Limit of Quantification was performed by standard deviation method. Standard with low
concentrations of analyte with those of blank samples and establishing the minimu m concentration at which the analyte can be readily detected
Table8 :Sensitivity table for l methyl folate and escitalopram
Molecule LOD LOQ
L-methyl folate 0.15 0.46
Escitalopram 0.15 1.55
Assay of formulation
We were prepared assay sample solution injected into the HPLC . Intas Pharmaceuticals Ltd
(Escitafol),bearing the labels claim L-methyl
Table9: Assay Data of L-methyl folate
S.no % Assay
1 99.01
2 98.83
3 99.26
4 99.03
5 99.64
6 99.71
Avg 99.25
Std Dev 0.36
%RSD 0.4
Table10: Assay data of Escitalopram S. no % Assay
1 100.29
2 101.03
3 99.81
4 99.78
5 98.62
6 99.45
Avg 99.83
Std Dev 0.8
%RSD 0.8
Degradation data
Degradation studies were performed with the formulation and the degraded samples were
Table11: Data of degradation studies
Type of degradation L-methyl folate Escitalopram
Area %Recovered % Degraded Area %Recovered % Degraded
Acid 743581 95.05 4.95 1804051 94.93 5.07
Base 753206 96.28 3.72 1815473 95.53 4.47
Peroxide 758790 97.00 3.00 1820734 95.81 4.19
Thermal 762374 97.45 2.55 1835047 96.56 3.44
UV 769501 98.36 1.64 1870879 98.44 1.56
Water 743581 98.36 1.64 1884103 99.14 0.86
CONCLUSION
The stability indicating RP HPLC method was developed and validated for the simultaneous determination of L methyl folate and Escitalopram in bulk and its dosage form , T he proposed method was validated in accordance with ICH guidelines by testing its parameters include linearity,
accuracy, precision, robustness, LOD and LOQ. Stress induced studies proves the effectiveness of the proposed stability indicating method.So the method developed was simple and economical that can be adopted in regular Quality control test in Industries.
REFERENCES
[1]. R. S. Satoskar, S. D. Bhandarkar and S. S. Ainapure. “Pharmacology and Pharmacotherapeutics”, Popular Prakashan, Mumbai, India, 17, 2001.
[2]. Gurdeep. R . Chatwal Syam k anand “Instrumental methods of chemical analysis” Mumbai 2002 [3]. “Burger’s Medicinal Chemistry and drug discovery”, Wiley Interscience, New Jersey, 6, 2007.
[4]. “Wilson and Gisvold’s Textbook of Organic Medicinal and Pharmaceutical Chemistry”, Lippincott Williams & Wilkins, New york, 11, 2004.
[5]. A. Korolkovas. “Essentials of Medicinal Chemistry”, Wiley Interscience, New Jersey, 2, 1988.
[6]. “Goodman and Gilman’s The Pharmacological Basis of Therapeutics”, McGraw-Hill health professions division, New york, 9, 1996.
[7]. Foye’s “Principles of Medicinal Chemistry”, 6th edition, Lippincott Williams & Wilkins, New york, 2008. [8]. B.K Sharma “book name 2011meerut (UP) India
[9]. Drugs & Cosmetics Act, 1940 & Rules, 1945, Susmit publishers, Mumbai, India, 2, 2000.
[10]. Indian Pharmacopoeia, Ministry of Health & Family Welfare, Government of India, New Delhi, 1996.
[11].The United States Pharmacopoeia- the National Formulary, United States Pharmacopoeial convention, Rockville, 2007.
[12].British Pharmacopoeia, The Stationary Office, London, 2005.
[13].“Martindale - The Extra Pharmacopoeia”, 33rd edition, The Pharmaceutical Press, London, 7, 2002.
[14].A. H. Beckett and J. B. Stenlake. “Practical Pharmaceutical Chemistry”, CBS Publishers & Distributors, New Delhi, India, 1(2), 2000.
[15].P. D. Sethi. “Quantitative Analysis of Drugs in Pharmaceutical Formulations”. CBS Publishers & Distributors, New Delhi, India, 3, 1997.
[16].H. H. Willard, L. L. Merrit, J. A. Dean and F. A. Settle. “Instrumental Method of Analysis”, 7th edition, CBS Publishers & Distributors, New Delhi, India, 1986.
[17].R. A. Day and A. L. Underwood. “Quantitative Analysis”, 6th edition, PHI learning private limited, New Delhi, India, 2009.
[18].G. Ramana Rao, S. S. N. Murthy and P. Khadgapathi. Gas chromatography to pharmaceutical analysis (Review). Eastern Pharmacist. 30(353), 1987, 35.
[20].Chusena Narasimharaju Bhimanadhuni1, Devala Rao Garikapati2 , Pasupuleti Usha3 Development and validation of an RP-HPLC method for the simultaneous determination of Escitalopram Oxalate and Clonazepam in bulk and its pharmaceutical formulations International Current Pharmaceutical Journal International Current Pharmaceutical Journal 1(8), 2012, 193-198