AN ANALYSIS OF THE SUPERVISED AND
UNSUPERVISED MACHINE LEARNING IN
ENHANCING THE EFFICACY OF FINANCIAL
ANALYSIS
Himanshu Dahiya
Bachelor of Technology (B.Tech), IT Manipal University, Jaipur-303007(Rajasthan), India
ABSTRACT
Data mining is the process of discovering patterns, corresponding to valuable information from the large data sets, involving methods at the intersection of machine learning, statistics, and database systems. Evolving from the fields of pattern recognition and artificial intelligence, machine learning explores the study and construction of algorithms that can learn from sample inputs. Financial data analysis is used in many financial institutes for accurate analysis of consumer data to find defaulters, to reduce the manual errors involved, for fast and saving time processing, to reduce the misjudgments, to classify the customers directly, and to reduce the loss of the financial institutions. We have analyzed a lot of machine learning techniques for financial analysis, namely models of supervised classification (Artificial Neural Networks, SupportVector Machine, Decision Trees), those of prediction (Cox survival model, CART Decision Trees), and also models of clustering(K-means clustering).
INTRODUCTION
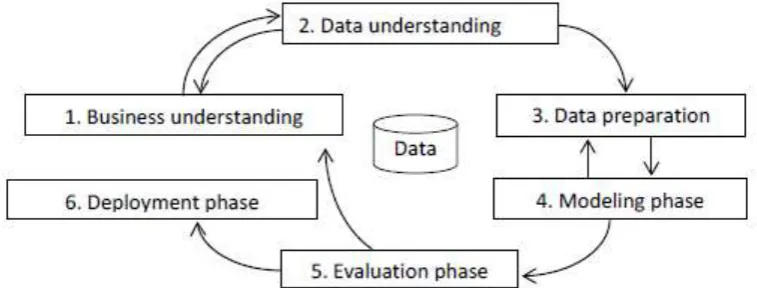
evolutionary computing, swarm intelligence and so on), pattern recognition, data visualization, information retrieval, image processing, and spatial or temporal data analysis. Data mining and Knowledge Discovery from the Database (KDD) are recent developments in the field of data management technologies. KDD is a kind of data mining designed to extract knowledge from a large amount of data. The standard procedure in performing data mining based on the Cross-Industry Standard Process of DataMining (CRISP-DM) involves six phases. See Figure 1.
These are the following:
1. Business understanding phase, consisting of choosing the objectives, understanding the business goal, learning situation assessment, and developing a project plan.
2. Data understanding phase, which consists of considering the data requirements and initial data collection, exploration, and quality assessment.
3. The data preparation phase, consisting of the selection of required data, data integration and formatting, data transformation, and data cleaning.
4. Modeling phase, consisting of the selection of appropriate modeling techniques, development, and examination of alternative modeling algorithms and parameter settings and finding the tuning of model setting according to an initial assessment of the model’s performance.
5. Evaluation phase, corresponding to the evaluation of the model experiment results.
6. Deployment phase, representing an implementation step, where a model report is performed.
Figure 1. Cross-Industry Standard Process of Data Mining(CRISP-DM).
and financial institutions have different services for customers, such as that of monitoring data for opening a savings account for each client’s business. The schedule gives credit to customers in transactions such as mortgage business, car loan services, investment services, insurance services, and stock investment services. Other financial applications of data mining and machine learning are the prediction of financial events that will happen in the future, such as stock markets, foreign exchange rates, bankruptcy, credit rating of the bank’s customer information, predictive financial and investment analysis, trading futures, understanding and managing financial risk in banks. As technology develops, it starts with bringing artificial Intelligence (AI) technology to be used in fund management, asset management, and other more financial institutions. Machine learning algorithms are used to isolate and analyze data from a large database.
Using this tool, one can find some patterns and can predict the outcome. However, there were many kinds of research using machine learning in banking to forecast future events that can help in decision-making processes. Nowadays, financial institutions and most banks are investing in information technology to bring data mining and machine intelligence techniques to manage the group of datasets in order to successfully operate in the presence of a competitive business. The banks are aware of the various risks. That may occur and adversely affect the business of the bank. Banks analyze the risk factors that are important. The quality of risk analysis may affect the financial performance of the business. There are risks of all institutions and organizations that may bring numerous direct and indirect losses. There are three major risks in banks corresponding to credit risk, operation risk, and market risk. Financial institutions should monitor credit risk management as appropriate. Banks are required to manage the credit risk compared to the risk of credit management individually. Credit risk management efficiency is very important and essential to the long-term success of banks. A popular tool used to evaluate the credit risk of individuals is Credit scoring. Credit scoring uses a report to evaluate some external components. The external reports process information on the status of credit risk data from credit bureaus and reliability party credit attributed together with the financial history and the current financial state of borrowers individually. Financial institutions have to remove unwanted features to distinguish between “good” and “bad” policies to manage the credit risk of each entity.
RELATED WORK
techniques for evaluation of the enterprise financial distress and credit prediction; there are improved the performance of algorithms by using Support Vector Machine (SVM) with3-folds cross-validation and Back Propagation Neural Network (BPN) by the four measured attributes. The data for this study have been collected from the database of a security firm in Taiwan. In this research, there are used 20 experimental samples for training data and 25 samples for testing data. By comparing the results, there has been shown that SVM gives higher precision of about 100% prediction accuracy and classification accuracy, implying low error rates, while BPN has led to 96% of prediction accuracy and 95% of classification accuracy. Many kinds of research about customer credit policy analysis were performed in 2012. K. Chopde et al. have studied the data mining techniques for credit risk analysis- in particular, the decision tree techniques. This research used data mining for credit risk analysis enabling the bank to reduce manual errors. This decision-making process is fast, it saves time processing, and it helps the bank to reduce the misjudgments. The research result found by the Meta Decision Tree (MDTs) used a base level classifier and the Random Forest (RF) classifier, leading to a more accurate classification score than the CART decision tree. Overall, the decision tree has proved to be a technique that can classify the customers directly with a good score, and thus, it can reduce the loss for the financial institutions in the best way.
Regarding classification accuracy, the CART model had led to the lowest error of classification, and regarding performance analysis of prediction accuracy, the Cox model had the lowest weighted error in 40% of the cases, while DA and the CART model had the lowest error in about 60% of the cases. The overall result provided empirical evidence that supports the use of survival analysis and decision tree techniques for financial distress. In 2016, R. G. Lopes et al. developed three predictive models: Generalized Linear Modelling (GLM), GradientBoosting Method (GBM), and Distributed Random Forest (DRF) by using the R language, to predict the recovery of credit operations in a Brazilian bank. All models have been built in 10-folds cross-validation, and there has been obtained a high evaluation result of the ROC curve. The GBM model has shown a better performance; this model has been used to help identify customers having the best potential with an 85.5% accuracy rate. This research has also identified the delinquent clients that had the highest probability of short-term recovery, to support the activities of account managers.
MACHINE LEARNING MODELS PROPOSED FOR FINANCIAL
ANALYSIS
Classification techniques support Vector Machine (SVM) is a tool to find the hyperplane that
application. The system can calculate the profitability of customers, and also it can evaluate the profit scoring from the customers. Worthwhile Survival analysis can predict the duration of the event will take place in advance and forecast the probability of occurrence of an event to occur. The H2O team discovered these famous data mining techniques to analyze the group datasets. These techniques are Generalized Linear Models (GLM), Gradient BoostingMethod (GBM), and Distributed Random Forest (DRF).GLM is similar to the linear regression model. Data mining techniques are used for regression analysis and data classification. GLM model is very popular because it is easy to be interpreted, and it is also a high-speed processing stage when used for large datasets. GBM model is a tool for prediction using regression or classification. It is an ensemble of the tree models and provides considerably accurate results. GBM model applies weak classification algorithms to incrementally change data, to create a series of decision trees. Finally, the DRF is an ensemble of tree models, where each tree is related to other trees. DRF is the most powerful technique for classification and regression. DRF can produce a major wood of arrangement or relapse trees as opposed to a solitary grouping or relapse tree. What’s more, DRF assembles half the same number of trees for binomial issues with a solitary tree to gauge class 0 by probability (p0) at that point registers the likelihood of another class 1 as (p1). For multiclass issues, DRF is utilized to assess the likelihood of each class separately.
Clustering technique
Cluster analysis groups are the data mining techniques used to classify as variable or split into small groups of two or more. The objects within a group are similar to one another and different from the objects in other groups.K-means clustering is a method of clustering the observations into a specific number of disjoint clusters. In principle, K-means clustering aims to partition a dataset as {X1, X2,…, XN} into K subsets to minimize the distortion measure defined by the function where binary indicator rnk=1, only if data point Xn is assigned to the kth cluster(for the other cases, rnk =0)and μk denotes the mean of the kth cluster. In Table 1, there are given a lot of papers for financial (banking) applications with the corresponding machine learning techniques and research results.