ECONOMICS AND MARKETING
Economic Evaluation of Soil and Foliar Applied Nitrogen Fertilization Programs
for Cotton Production
Roland K. Roberts*, Michael M. Kenty, James M. Thomas, and Donald D. Howard
R. K. Roberts, Department of Agricultural Economics, University of Tennessee, Knoxville, TN 37996-4500; M. M. Kenty and J. M. Thomas, Helena Chemical Company, Collierville, TN 38017; and D. D. Howard, D&D Research Consultants, Jackson, TN 38301
*Corresponding author: [email protected]
ABSTRACT
With increased environmental pressures, cot-ton producers may need to improve the efficiency of N fertilization. Including foliar applications in a cotton fertility program can improve N efficiency through improved application timing and flex-ibility. The objective of this study was to compare yields and economic returns from four soil and foliar N fertilization programs. Data for 28 site-years were obtained from experiments conducted in 11 states in 2001 and 2002. The experimental design was a randomized complete block with treatments replicated four to six times. Treat-ments were 1) the full recommended soil-N rate for the site with no foliar N (Full Soil N), 2) 2/3 Full Soil N with foliar urea (Foliar Urea), 3) 2/3 Full Soil N with foliar CoRoN (Foliar CoRoN), and 4) 2/3 Full Soil N with no foliar N (2/3 Soil N). Foliar applications were triggered by petiole analysis for
NO3-N below a critical level that was determined
using a Cardy ion meter. Lint yield was highest for Foliar CoRoN and was significantly different from Foliar Urea and 2/3 Soil N but not Full Soil N. Foliar CoRoN had the highest cost and net revenue, and its net revenue was significantly different from 2/3 Soil N only. Foliar CoRoN maintained its positive economic advantage over other treatments under large (100%) changes in N prices and foliar application costs. Applying soil N at 2/3 the recommended rate followed by foliar N applications uses N more efficiently than applying the full recommended rate to the soil, provides at least as much net revenue, and has the added flexibility of correcting N deficiencies during a critical stage of boll development.
N
utrient management plans continue to be discussed at many levels within state and federal agencies. Row crop producers may soon be mandated to implement nutrient management plans on their farms. Some states already have implemented nutrient management plans for producers in certain watersheds. The cost of implementing these plans, plus the increased cost of cotton (Gossypium hirsutum L.) production due to increased costs of inputs, especially nitrogen (N), necessitates efficient nutrient management. To maintain profitable production, cotton producers may need to change from traditional soil fertility programs to an integrated system consisting of soil and foliar applied nutrients.(Oosterhuis et al., 1989). Foliar application of N has not consistently increased lint yields (Anderson and Walmsley, 1984; McConnell et al., 1998; Oosterhuis and Bondada, 2001; Smith et al., 1987) and yield response to foliar N depends on the N rate applied to the soil (McConnell et al., 1998; Snyder et al., 1998). Foliar N should be applied only when plant N levels have been reduced to a critical level. In many cases, foliar N is arbitrarily applied before the N status of the plant has been determined.
Even if foliar applications of N improved lint yields, all foliar sources of N may not improve yields by the same amount. Feed grade urea is a commonly used foliar N source and slow release foliar N sources have been developed for improved efficiency (Liv-ingston and Stichler, 1995). One of these sources is CoRoN (25-0-0) (Helena Chemical Company; Collierville, TN). It is a methylene-urea-based solu-tion with 25% total N content that has shown some potential for increased yield (White et al., 1995), boll weight, and boll number (Morse and Oosterhuis, 1996). One liter contains 1.441 kg N of which 25% or 6.2% of the total N content is slowly soluble urea N. CoRoN has low phytotoxicity (Oosterhuis et al., 2000), and its chemical makeup allows it to remain on the leaf surface in liquid state for a longer period of time than conventional fertilizer mixtures (Kenty, unpublished data, 2005). This attribute may provide greater opportunity for N absorption by the leaves and translocation to the bolls than foliar urea.
Although the research cited previously evaluated the effects of soil and foliar N applications on cotton lint yields, it did not compared the economic returns from recommended soil N applications with a com-bination of reduced soil N and foliar N applications, nor have the experiments been conducted over such a wide range of geographic, environmental, and crop growth conditions. The hypotheses motivating this research were that 1) a cotton N fertility program that includes reduced soil N applications in combination with foliar N applications would produce at least as much cotton lint and net revenue per hectare as one with recommended soil N applications alone and 2) a cotton N fertility program that includes reduced soil N applications in combination with foliar CoRoN applications would produce at least as much cotton lint and net revenue per hectare as one with reduced soil N applications in combination with foliar urea applications. The objective of this research was to compare yields and economic returns from four soil and foliar N fertilization treatments under alternative
assumptions about the cotton lint price, N prices, and foliar application costs over a variety of cotton growing conditions throughout the Cotton Belt.
MATERIALS AND METHODS
Field investigations were conducted at selected sites across the Cotton Belt in 2001 and 2002 (Kenty et al., 2003). The data used in this analysis included 11 states, 15 sites, and 28 site-years. States and sites were North Carolina, South Carolina, georgia, Alabama (2002 only), two sites in Mississippi, two sites in Louisiana, Tennessee, two sites in Arkansas, Missouri, two sites in Texas (2002 excluded for one site), and Oklahoma.
Prior to planting in 2001, a research protocol was established to provide comprehensive applicability of the findings with regard to soil and foliar N applica-tions over a wide range of growing condiapplica-tions. The protocol required researchers at each site to produce cotton (following cotton) on a typical cotton soil (not poorly drained or highly sandy) using a locally adapted cultivar and standard agronomic practices, such as weed, insect, and disease control, irrigation, and plant growth regulators, for the local environment. Sites in Arkansas, georgia, Missouri, Oklahoma, and South Carolina were irrigated. The effects of P and K were controlled through soil application before or at planting according to local practice as determined by soil testing. The experimental design for all site-years was a randomized complete block with treat-ments replicated four to six times. Row lengths were between 9.14 m and 12.19 m for sites with small plots and 76.20 m for sites on producer fields. All plots were four rows wide. Sites on producer fields were in Arkansas, Mississippi, and Tennessee. Treatments included 1) the full recommended soil-N rate for the particular site with no foliar N (Full Soil N treatment), 2) 2/3 of the full soil-N rate with foliar urea if indicated by petiole analysis (Foliar Urea treatment), 3) 2/3 of the full soil-N rate with foliar CoRoN if indicated by petiole analysis (Foliar CoRoN treatment), and 4) 2/3 of the full soil-N rate with no foliar N (2/3 Soil N treatment). Recommended rates of soil N were determined from Extension Service recommenda-tions based on growing condirecommenda-tions at each site. Soil N was applied as ammonium nitrate (AN) at planting or as a side-dress according to the local practice and ranged between 134 kg ha-1 at the irrigated Oklahoma
site and 67 kg ha-1 at the non-irrigated Alabama site.
and foliar CoRoN was applied at 3.785 L ha-1. Each
treatment received a foliar application of B. Foliar treatments were applied in water at 93.53 L ha-1 to
provide adequate coverage. Nozzles were oriented over the row and foliar materials applied at a pressure of 1.41 to 2.81 kg cm2. Plots were spindle-picked and
the harvested lint evaluated.
The Cardy portable electrode-based ion meter (Horiba, Ltd.; Kyoto, Japan) was used to evaluate petiole nitrate-N levels. Foliar urea and CoRoN ap-plications made when nitrate-N levels were below a critical level (Kenty et al., 2002; Kenty et al., 2003). Petiole analysis was initiated at bloom and continued on a seven-day interval until plant cut-out. In 2001, foliar N applications were not required for two irri-gated sites (Oklahoma and South Carolina) and two non-irrigated sites (Tennessee and one site in Texas), and all sites received at least one foliar N application in 2002 except Oklahoma (irrigated).
Statistical analyses of treatment effects on yields and net revenues were conducted using the SAS Mixed Model procedure (
Littell et al.,
1996) (version 6.12; SAS Institute, Inc.; Cary, NC). Mean separation was accomplished through a series of protected pair-wise contrasts among all treatments (Saxton, 1998). Treatment yields were averaged within each site and year, and statistically analyzed with a randomized block split-plot design. Site was the random block effect, year was the fixed whole plot effect, and treatment was the fixed subplot effect. Year was tested with site by year interaction, and all other fixed effects were tested with the residual (Sax-ton, personal communication, 2006). Net revenues were analyzed similarly.Mean separations were performed independently for yields and net revenues because in addition to differences in costs among treatments, differences in yields add an element of variation to net revenues that should not be ignored. For example, even if dif-ferences in costs between two treatments were not large and yields were not significantly different, the two sources of variation could reinforce each other to give significantly different net revenues.
Partial budgeting was used for economic analysis (Boehlje and Eidman, 1984). This method simplified the economic analysis by only considering costs of production that were different among treatments. Costs that were the same among the four treat-ments were not estimated. For example, if a cotton producer were to consider switching from the Full Soil N treatment to the Foliar Urea treatment, the
partial budgeting equation for one hectare of cotton production would be:
ΔNR = ΔTR - ΔC
= P(Y2 – Y1) - [(C2 + C*) – (C1 + C*)]
= (PY2 – C2) - (PY1 – C1)
where ΔNR is the difference between treatments in net revenue above total costs, ΔTR = P(Y2 – Y1) is the
difference between the treatments in total revenue,
ΔC = (C2 + C*) – (C1 + C*) is the difference between
treatments in total costs, P = the price of cotton lint, Y2 = lint yield for the Foliar Urea treatment, Y1 =
lint yield for the Full Soil N treatment, C2 = costs
that are different among treatments for the Foliar Urea treatment, C* = costs that are the same among
the four treatments, and C1 = costs that are different
among treatments for the Full Soil N treatment. Because C* is the same for both treatments, the
difference in net revenues above total costs is the same as the difference in net revenues above costs that are different among treatments. Hereafter, PY2
– C2 and PY1 – C1 are referred to as net revenues for
their respective treatments. If ΔNR > 0, the Foliar Urea treatment has an economic advantage over the Full Soil N treatment which equals ΔNR.
Costs that differ among treatments included the cost of AN, the cost of feed grade urea, the cost of CoRoN, the cost of petiole analysis, and the cost of foliar application of urea or CoRoN. Soil N applica-tion costs for the Full Soil N and 2/3 Soil N treatments were assumed to be the same. Other costs did not vary among the four treatments within each location.
Prices used in the economic analysis for 2004 were the expected cotton lint price received by producers including allowances for government payments = $1.37 kg-1 (D.C. gerloff, personal
com-munication, 2004); the price of AN = $0.84 kg-1 N;
the price of feed grade urea = $0.60 kg-1 N; the price
of CoRoN = $1.57 L-1; the cost of a petiole analysis
= $2.00 ha-1; and the cost of foliar application of urea
or CoRoN = $4.66 ha-1 (gerloff, 2004).
The cotton producer’s cost of a petiole analysis using a Cardy Meter was assumed to be the cost of custom hiring the analysis from a laboratory. The cost per sample was assumed to be $10. Each petiole analy-sis can cover between 10.1 ha and 20.2 ha depending on the size of the management zone. A management zone size of 15 ha was assumed, giving a cost per petiole analysis of $0.67 ha-1 (= $10/15 ha). Although
bloom in the experiment, in reality a cotton producer would rarely need to perform more than three petiole analyses; at first bloom, first bloom plus 10 d, and first bloom plus 20 d. These three dates would provide a reasonable amount of time to make agronomic and business decisions about whether or not to apply foliar N (Kenty, unpublished data, 2005), so the cost of petiole analyses from Cardy meter readings was calculated at $2.00 ha-1 (=$0.67 x 3 analyses).
The cost of foliar application was the sum of machinery and labor costs. Machinery costs included fuel, oil, repair, depreciation, insurance, storage, and interest costs for a self-propelled sprayer with a 27.4-m boo27.4-m, $147,500 purchase price, 15-yr useful life, and the ability to cover a hectare in 0.025 h (gerloff, 2004). Operator labor was valued at $8 h-1 and labor
hours were assumed to be 1.25 times machine hours (gerloff, 2004).
Notwithstanding potential differences across sites, prices and costs used in the economic analysis can be considered typical of the 11-state region, because arbitrage would cause prices to differ only by trans-portation costs (Nicholson, 1998), so the relationships among prices would not likely differ much across states. Net revenues calculated using these 2004 prices and costs were for the latest year available when the economic analysis was conducted, making them most comparable to net revenues in current dollars.
Sensitivity analyses for differences in net rev-enues among treatments were conducted for large (between 50% and 100%) changes in the cotton lint price, the price of feed grade urea, the price
of AN, the cost of foliar application, and the price of CoRoN. Sensitivity was evaluated by changing one of the aforementioned prices and holding other prices at 2004 levels. These large price changes were evaluated to determine how the results would change under extreme price fluctuations. The SAS Mixed Model procedure (SAS Institute, Inc.) was used for statistical analysis of net revenues under different price alternatives. Statistical comparisons among net-revenue means under alternative price and cost scenarios were performed because variation in yields and N inputs among treatments can cause the relationships among treatment means to vary as prices and costs change.
RESULTS
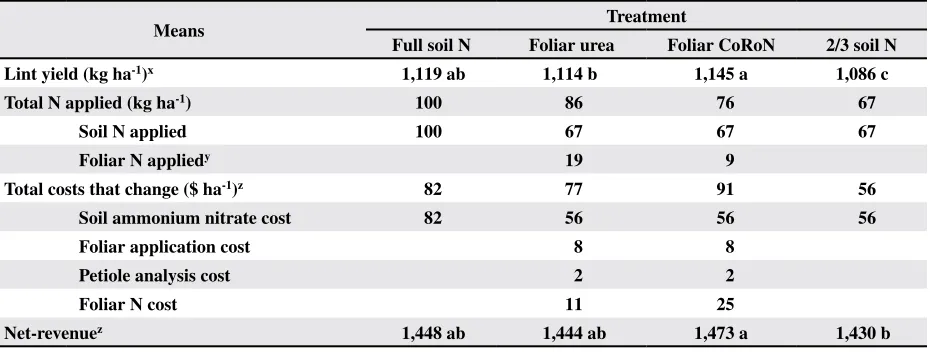
Lint yield means were not significantly different across years (t12 = 0.02). The Foliar CoRoN treatment
had the highest lint yield at 1,145 kg ha-1, which was
not significantly higher than the Full Soil N treat-ment (1,119 kg ha-1) (Table 1). In addition, the Foliar
CoRoN treatment used N more efficiently, requiring 24 kg ha-1 less N than the Full Soil N treatment to
achieve these yields. The mean yields for the Foliar CoRoN treatment and the Foliar Urea treatment were different, with the Foliar CoRoN treatment providing 31 kg ha-1 more lint than the Foliar Urea
treatment, while using 10 kg ha-1 less N. The 2/3
Soil N treatment yielded 59 kg ha-1 less lint than the
Foliar CoRoN treatment. It also produced less lint per hectare than the other two treatments.
Table 1. Treatment means averaged across locations and years for lint yields, applied N, costs that are different among treat-ments, and net-revenues
Means Treatment
Full soil N Foliar urea Foliar CoRoN 2/3 soil N
Lint yield (kg ha-1)x 1,119 ab 1,114 b 1,145 a 1,086 c
Total N applied (kg ha-1) 100 86 76 67
Soil N applied 100 67 67 67
Foliar N appliedy 19 9
Total costs that change ($ ha-1)z 82 77 91 56
Soil ammonium nitrate cost 82 56 56 56
Foliar application cost 8 8
Petiole analysis cost 2 2
Foliar N cost 11 25
Net-revenuez 1,448 ab 1,444 ab 1,473 a 1,430 b
x Means of costs that change and net-revenue means are measured in 2004 dollars.
y The average number of foliar applications was 1.68 for Foliar Urea and Foliar CoRoN.
The Foliar CoRoN treatment had the highest cost at $91 ha-1, with the lowest cost being $56 ha-1 for
the 2/3 Soil N treatment (Table 1). The Full Soil N treatment had the second highest cost of $82 ha-1.
Treatment net-revenue means at 2004 prices are reported in Table 1 and differences in net-revenue mean between treatments are reported in Table 2. Net-revenue means were not significantly different across years (t12 = 0.03), nor were they significantly
different among the Full Soil N, Foliar Urea, and Foliar CoRoN treatments. Nevertheless, for this experiment the Foliar CoRoN treatment provided $26 ha-1 and $29 ha-1 more net revenue than the Full
Soil N and the Foliar Urea treatments, respectively (Table 2). The net-revenue difference between the Full Soil N and the Foliar CoRoN treatments did not account for the added non-monetary benefit resulting from the flexibility of applying a lower soil N rate followed by foliar applications of CoRoN as indi-cated by petiole analysis. This non-monetary benefit manifests itself through a slight reduction in yield risk as evidenced by a lower coefficient of variation for the Foliar CoRoN treatment (0.38) relative to the Full Soil N treatment (0.42). Another potential non-monetary benefit of the Foliar CoRoN and Foliar Urea treatments is the potential for reduced negative environmental impacts. The Foliar CoRoN and Foliar Urea treatments produced about the same yield as the Full Soil N treatment using 24 kg ha-1 and 14 kg
ha-1 less N, respectively.
Net-revenue means for the Foliar CoRoN and the 2/3 Soil N treatments were significantly different (Table 1) with the Foliar CoRoN treatment provid-ing $43 ha-1 more net revenue. The Full Soil N and
the Foliar Urea treatments earned about the same net revenue ($3 ha-1 difference), and the coefficient
of variation for the Foliar Urea treatment was 0.40 compared with 0.41 for the Full Soil N treatment, providing a smaller reduction in yield risk than the Foliar CoRoN treatment.
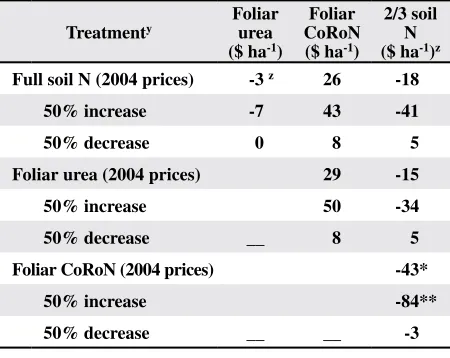
Table 2 shows how 50% changes in the cotton lint price affect net-revenue difference between treat-ments. In this experiment, a 50% increase in the lint price increases the economic advantage (net-revenue difference) of the Foliar CoRoN treatment relative to the Full Soil N treatment from $26 ha-1 to $43 ha-1,
although the treatment means are not significantly different from one another for either lint price. The advantage of the Foliar CoRoN treatment relative to the Foliar Urea treatment increases from $29 ha-1 to
$50 ha-1 and the advantage of the Foliar CoRoN
treat-ment relative to the 2/3 Soil N treattreat-ment increases from $43 ha-1 to $84 ha-1, with the latter net-revenue
difference being significant at the 5% level. A 50% reduction in the cotton lint price substantially reduces net-revenue difference between treatments. This sensitivity analysis for lint price suggests that the economic advantage of the Foliar CoRoN treatment over the other treatments increases (decreases) with higher (lower) cotton lint prices.
Table 2. Treatment differences in net-revenue means for 2004 prices and for a 50% increase and a 50% decrease in cotton lint price
Treatmenty Foliar urea
($ ha-1)
Foliar CoRoN ($ ha-1)
2/3 soil N ($ ha-1)z
Full soil N (2004 prices) -3 z 26 -18
50% increase -7 43 -41
50% decrease 0 8 5
Foliar urea (2004 prices) 29 -15
50% increase 50 -34
50% decrease __ 8 5
Foliar CoRoN (2004 prices) -43*
50% increase -84**
50% decrease __ __ -3
y Values in the table are the net-revenue means for the
treatments in the columns minus the net-revenue means for the treatments in the rows for a 2004 cotton lint price of $1.37 kg-1 and a price increase of 50% ($2.05 kg-1) and a price decrease of 50% ($0.68 kg-1).
z Values followed by *, ** indicate the column treatment is
significantly different from row treatment at P = 0.10 and
0.05, respectively.
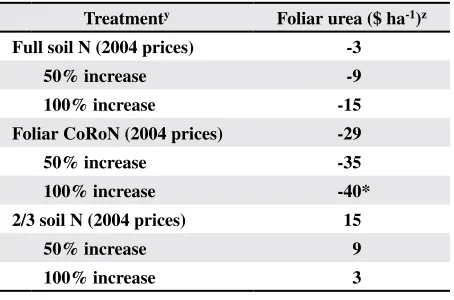
Increasing the price of feed grade urea by 50% and 100% reduces the economic advantage of the Foliar Urea treatment relative to the other treatments (Table 3). In particular, when the urea price increases by 100%, the advantage of the Foliar CoRoN treat-ment relative to the Foliar Urea treattreat-ment increases from $29 ha-1 to $40 ha-1 and is significantly different
from zero at the 10% level.
Increasing the AN price by 50% and 100% af-fects net-revenue differences (Table 4). These AN price increases improve the economic advantage of the treatments that apply the lower soil N rate relative to the Full Soil N treatment. With a 100% increase in the AN price, the economic advantage of the Foliar CoRoN treatment over the Full Soil N treatment increases from $26 ha-1 to $54 ha-1 and is
Foliar application cost increases of 50% and 100% have little effect on net-revenue differences (Table 5) because foliar application cost is a small portion of all costs that change among treatments (Table 1). Nevertheless, the economic advantage of those treatments that include foliar N applications decreases as foliar application cost increases.
The effects of a CoRoN price decrease of 50% and a CoRoN price increase of 100% are shown in Table 6. These price changes only affect net-revenue differences that compare the Foliar CoRoN treatment with other treatments. For a CoRoN price decrease of 50%, the economic advantages of the Foliar CoRoN treatment are significantly different from zero at the
Table 3. Treatment differences in net-revenue means for 2004 prices and for feed grade urea price increases of 50% and 100%
Treatmenty Foliar urea ($ ha-1)z
Full soil N (2004 prices) -3
50% increase -9
100% increase -15
Foliar CoRoN (2004 prices) -29
50% increase -35
100% increase -40*
2/3 soil N (2004 prices) 15
50% increase 9
100% increase 3
y Values in the table are the net-revenue means for the
fo-liar urea treatment minus the net-revenue means for the treatments in the rows for a 2004 feed grade urea price of $0.60 kg-1 and price increases of 50% ($0.90 kg-1) and 100% ($1.20 kg-1).
zValues followed by * indicate the Foliar Urea treatment is
significantly different from row treatment at P = 0.10. Table 4. Treatment differences in net-revenue means for 2004
prices and for ammonium nitrate (AN) price increases of 50% and 100%
Treatmenty Foliar urea
($ ha-1)
Foliar CoRoN ($ ha-1)z
2/3 soil N ($ ha-1)z
Full soil N (2004 prices) -3 26 -18
50% increase 11 40 * -4
100% increase 25 54** 10
Foliar urea (2004 prices) 29 -15
50% increase 29 -15
100% increase __ 29 -15
Foliar CoRoN (2004 prices) -43*
50% increase -43*
100% increase __ __ -43*
y Values in the table are the net-revenue means for the
treatments in the columns minus the net-revenue means for the treatments in the rows for a 2004 AN price of $0.84 ha-1 and price increases of 50% ($1.26 ha-1) and 100% ($1.68 ha-1).
z Values followed by *, ** indicate the column treatment is
significantly different from row treatment at P = 0.10 and
0.05, respectively.
Table 5. Treatment differences in net-revenue means for 2004 prices and for foliar N application cost increases of 50% and 100%
Treatmenty Foliar urea
($ ha-1)
Foliar CoRoN ($ ha-1)
2/3 soil N ($ ha-1)z
Full soil N (2004 price) -3 26 -18
50% increase -7 22 -18
100% increase -11 18 -18
Foliar urea (2004 price) 29 -15
50% increase 29 -11
100% increase __ 29 -7
Foliar CoRoN (2004 price) -43*
50% increase -40*
100% increase __ __ -36
y Values in the table are the net-revenue means for the
treatments in the columns minus the net-revenue means for the treatments in the rows for a 2004 foliar applica-tion cost of $4.14 ha-1 and cost increases of 50% ($6.19 ha-1) and 100% ($8.27 ha-1).
z Values followed by * indicate the column treatment is
significantly different from row treatment at P = 0.10.
Table 6. Treatment differences in net-revenue means for 2004 prices and for a CoRoN price decrease of 50% and a CoRoN price increase of 100%
Treatmenty Foliar CoRoN ($ ha-1) z
Full soil N (2004 price) 26
50% decrease 38*
100% increase 1
Foliar urea (2004 price) 29
50% decrease 41*
100% increase 4
2/3 soil N (2004 price) 43*
50% decrease 55**
100% increase 19
y Values in the column are net-revenue means for the
Foliar CoRoN treatment minus net-revenue means for the treatments in the rows for a 2004 CoRoN price of $1.57 L-1, a price decrease of 50% ($0.79 L-1) and a price increase of 100% ($3.14 L-1).
z Values followed by *, ** indicate the Foliar CoRoN
treat-ment is significantly different from row treattreat-ment at P =
10% level compared with the Full Soil N and Foliar Urea treatments. As expected, a 100% CoRoN price increase reduces the economic advantage of the Foliar CoRoN treatment relative to the other treatments and the null hypothesis that the net-revenue differences are zero cannot be rejected at the 10% level.
CONCLUSIONS
Results suggest that soil applying N at 2/3 the recommended rate, followed by foliar N applications as indicated by petiole analysis, can provide at least as much lint yield and net revenue as the traditional practice of soil applying the full recommended N rate without foliar N applications, and has the added potential environmental benefit of using 14 kg ha-1 to
24 kg ha-1 less N. A further benefit of reduced soil N
followed by foliar applications is the added flexibility of correcting N deficiencies during a critical stage of boll development. This flexibility manifests itself through lower yield risk associated with slightly lower coefficients of variation for yield. Even with 100% increases in the feed grade urea price, the CoRoN price and foliar application costs, the economic advantage of reduced soil N followed by foliar N applications, was not less than applying the full recommended soil N rate. Although not significantly different, in the case of this experiment, the lower soil N rate followed by foliar CoRoN provided $29 ha-1 more net revenue than
the lower soil N rate followed by foliar urea and $26 ha-1 more net revenue than the full recommended soil
N rate without foliar applications, while requiring 10 kg ha-1 and 24 kg ha-1 less N, respectively.
ACKNOWLEDGEMENTS
Funding provided by Helena Chemical Company and Tennessee Agricultural Experiment Station.
REFERENCES
Anderson, D.J., and M.R. Walmsley. 1984. Effects of eight different foliar treatments on yield and quality of an un-fertilized short season cotton variety in the Texas coastal bend. p. 128-130. In Proc. Beltwide Cotton Prod. Res. Conf., Atlanta, gA. 8-12 Jan. 1984. Natl. Cotton Counc. Am., Memphis, TN.
Boehlje, M.D., and v.R. Eidman. 1984. Farm management. John Wiley and Sons, New York.
Bondada, B.R., D.M. Osterhuis, and N.P. Tugwell. 1999. Cot-ton growth and yield as influenced by different timing of late-season foliar nitrogen fertilization. Nutrient Cycling in Agroecosystems 54:1-8.
gerloff, D.C. 2004. Cotton bugets for 2004. AE 04-30. Dep. Agric. Econ., Univ. Tennessee Agric. Ext. Ser., Knox-ville, TN.
Kenty, M., J. Thomas, J.C. Banks, S. Osborne, T. Blythe, N. Buehring, M.P Harrison, C. Burmester, J. Camberato, D. Dunn, W. Stevens, K. Edminsten, C. green, S. Hague, A.M. Stewart, g. Harris, M. Holman, D.D Howard, B. Lewis, J. Matocha, J. McConnell, and M. Zerkoune. 2003. Evaluating the need for foliar N based on field testing, soil N rates, and foliar N sources. p. 1904-1908. In Proc. Beltwide Cotton Conf., Nashville, TN. 6-10 Jan. 2003. Natl. Cotton Counc. Am., Memphis, TN.
Kenty, M. M., J.M. Thomas, T. Crook, C. Turney, M. Raby, R. Renfroe, g. Coburn, C. guy, and J. Townsend. 2002. Utilization of CoRoN to compensate nitrate deficiencies identified by petiole analysis. Unpaginated CD-ROM. In Proc. Beltwide Cotton Conf., Atlanta, gA. 8-13 Jan. 2002. Natl. Cotton Counc. Am., Memphis, TN. Littell, R.C, g. Milliken, W.W. Stroup, and R.D. Wolfinger.
1996. SAS System for Mixed Models. SAS Institute Inc., Cary, NC.
Livingston, S.D., and C.R. Stichler. 1995. Correcting nitrogen deficiencies in cotton with urea-based products. AgR 13.1. Texas Agricultural Extension Service, Texas A&M University, College Station, TX. Available online at: http:// primera.tamu.edu/ir4/UREA.pdf (verified 27 Mar. 2006). McConnell, J.S., W.H. Baker, and R.C. Kirst. 1998. Yield
and petiole nitrate concentrations of cotton treated with soil-applied and foliar-applied nitrogen. J. Cotton Sci. 2:143-152 [Online]. Available at: http://www.cotton. org/journal/1998-02/3/143.cfm.
McMichael, B.L. 1990. Root-shoot relationships in cotton. p. 232-247. In J.E. Box, and L.C. Hammond (ed.) Rhizo-sphere Dynamics. Westview Press Inc., Boulder, CO. Maples, R.L., and W.H. Baker. 1993. Foliar and soil
applica-tion of nitrogen for cotton during the growing season: yield response. p. 1-11. In Special Bulletin 938. Arkansas Agric. Exp. Stn, Fayetteville, AR.
Maples, R.L., W.N. Miley, and T.C. Keisling. 1990. Nitro-gen recommendations for cotton and how they were developed in Arkansas. p. 33-39. In Nitrogen nutrition in cotton: Practical issues. ASA, Madison, WI.
Nicholson, W. 1998. Microeconomic Theory: Basic Principles and Extensions. 7th ed. The Dryden Press, Fort Worth,
TX.
Oosterhuis, D.M., and B.R. Bondada. 2001. Yield response of cotton to foliar nitrogen as influenced by sink strength, petiole, and soil nitrogen. J. Plant Nutr. 24:423-422. Oosterhuis, D.M., S.K. gomez, and C.R. Meek. 2000. Effects
of CoRoN slow-release foliar nitrogen fertilization on cotton growth and yield. p. 106-108. In D.M. Oosterhuis (ed.) Proc. 2000 Cotton Research Meeting. Special Re-port 198, Arkansas Agric. Exp. Stn., Fayetteville, AR. Oosterhuis, D.M., B. Zhu, and S.D. Wullschleger. 1989. The
uptake of foliar-applied nitrogen in cotton. p. 23-26. In D.M. Oosterhuis (ed.) Proc. 1989 Cotton Research Meet-ing. Arkansas Agric. Exp. Stn., Special Report, Fayette-ville, AR.
Saxton, A.M. 1998. A macro for converting mean separation output to letter groupings in Proc Mixed. p. 1243-1246. In Proc. SAS Users group Inter. Conf., 23rd, Nashville,
TN. 22-25 Mar. 1998. SAS Institute, Cary, NC. Smith, F., N Malm, and C. Roberts. 1987. Timing and rates
for foliar n application to cotton. p. 61-64. In Proc. Belt-wide Cotton Prod. Res. Conf., Dallas, TX. 4-8 Jan. 1987. Natl. Cotton Counc. Am., Memphis, TN.
Snyder, C.S., D.M. Oosterhuis, D.D. Howard, and J.S. Mc-Connell. 1998. Foliar nitrogen and potassium fertiliza-tion of cotton. News & views, June. Potash & Phosphate Institute (PPI) and Potash & Phosphate Institute of Canada (PPIC), Norcross, gA. Available online at: http:// www.ppi-ppic.org/ppiweb/ppinews.nsf/$webcontents/ 2F63B3C8AEAC0E958525691B00679649/ $file/98121-CSS-NK+Cotton.pdf (verified 25 July 2005).
Thompson, A.C., H.C. Jones, J.W. Jones, and J.D. Hesketh. 1976. Nitrogen concentration of cotton leaves, buds, and bolls in relation to age and nitrogen fertilization. Agron. J. 68: 617-621.
White, D.R., S.g. Morse, D.M. Oosterhuis, and E.M. Hol-man. 1995. The effects of foliar-applied controlled release nitrogen on uptake and yield of cotton in Arkan-sas. p. 1355-1356. In Proc. Beltwide Cotton Conf., San Antonio, TX. 4-7 Jan.1995. Natl. Cotton Counc. Am., Memphis, TN.