http://journal.cotton.org, © The Cotton Foundation 2016
ENGINEERING AND GINNING
Harvester-based Sensing System for Cotton Fiber Quality Mapping
Vincent P. Schielack III, J. Alex Thomasson*, Ruixiu Sui, and Yufeng Ge
V.P. Schielack III, P.O. Box 66, 1959 W. Fir Ave., Perry, OK 73077; J.A. Thomasson, Department of Biological & Agricultural Engineering; Texas A&M University, Mail
Stop 2117, College Station, TX; R. Sui, USDA-ARS Crop Production Systems Research Unit, Stoneville, MS 38776; and Y. Ge, Department of Biological Systems Engineering, University of Nebraska-Lincoln, Lincoln, NE 68583 *Corresponding author: [email protected]
ABSTRACT
Precision agriculture in cotton production
attempts to maximize profitability by exploiting information on field spatial variability to optimize fiber yield and quality. For precision agriculture to
be viable economically, collection of spatial
vari-ability data within a field must be automated and
incorporated into normal harvesting and ginning
operations. An automated prototype system that
uses image processing to estimate the micronaire
value of cotton fiber during harvest was designed and built. The system was based on a camera with
a visible Indium Gallium Arsenide detector sensi-tive to a broad range of visible and near-infrared
(NIR) energy. Image processing algorithms were
developed to identify foreign matter in the images so that it could be excluded from the measurement
of reflectance in three NIR wavebands. After the
effects of foreign matter were removed, the NIR
reflectance measurements had a strong relationship
to standard micronaire measurements, even though the measurements were made on seed cotton, which
has a high level of foreign matter compared to fiber samples. A simplified version of the system could be
constructed from a similar camera with only three
optical band-pass filters at 650, 1550, and 1600 nm.
The prototype system developed shows promise for
in-situ measurement of cotton fiber quality, specifi
-cally micronaire, and can enable creation of fiber quality maps to improve crop management and ultimately profitability.
C
otton farm revenue is determined by two major factors, yield and fiber quality, both of which vary significantly across farm fields (Ge et al., 2008; Johnson et al., 2002; Sassenrath et al., 2005). In astudy by Ge et al. (2011), fiber quality’s importance in determining revenue was 13% that of yield in one field and 31% in another, so it is clearly important when considering field spatial variability. Currently, the only practical way to track fiber quality variability in a field is by using GPS to record the harvest locations of modules and assigning each module area an average quality based on post-facto measurements at the gin or classing office. Ge (2012) built and tested a wireless module-tracking system to map harvest boundaries of conventional modules within a field and Sjolander (2011a, b) automated the system’s operation. Since the introduction of onboard moduling harvesters, this mapping capability should be simpler and closer to commercial realization. However, although a fiber quality map generated in such a way would be useful, it would still not match the resolution of other variability maps such as those of yield, elevation, and soil electrical conductivity. Manual sampling to produce a high-resolution fiber quality map would be cost prohibitive, but high-resolution fiber quality measurements potentially could be integrated into the harvesting process if an automated fiber quality sensor were available for use on board a harvester.
Among fiber properties typically measured, micronaire is the most spatially variable (Ge et al., 2008). High Volume Instrument (HVI) micronaire measurement is an established and accepted method of classifying fiber quality as it relates to fineness and maturity. However, the method used is applicable only with fiber samples in a laboratory setting because the instruments require controlled ambient conditions (ASTM, 2011). Thomasson and Shearer (1995) and Rodgers et al. (2009) found strong relationships between multiple spectroscopically measured near-infrared (NIR) reflectance bands and micronaire (R2 = 0.96 in both studies), and Sui et al. (2008) found an
even stronger relationship (R2 = 0.98-0.99) between
multiple NIR bands measured with a camera and the micronaire of the clean and uniform International Cot-ton Calibration Standards.
seed cotton, a much more difficult task because of its entrainment of seeds and foreign matter. Cotton foreign matter and fiber have different reflectance properties throughout the visible and NIR portions of the spectrum (Fig. 1; unpublished data), so it is conceivable that for -eign matter could be eliminated from the analysis; for example, Thomasson et al. (2005a, b) developed and tested an image analysis-based system that improved cotton color measurements by identifying foreign mat-ter and removing it from the analysis. Also, Zhang and Li (2014) applied several image processing techniques to foreign-matter identification in cotton and have improved that capability. Although these studies have used a camera and an image analysis system to measure cotton color and trash content, the idea of measuring micronaire with such a system is novel.
luminate the presented sample, (5) optical filters and a mechanism capable of positioning and changing them to restrict reflected light to specified wavebands, (6) a data acquisition and computing device to store and process data collected by the imaging sensor and to control automated functions including filter changing and image acquisition, and (7) a set of algorithms to analyze the images and estimate micronaire.
An Indigo Alpha NIR camera with a visible In-dium Gallium Arsenide detector (FLIR Technologies, Wilsonville, OR) was selected as the imaging sensor. It has NIR sensitivity in a wavelength range sensitive to fiber fineness and maturity as well as visible light sensitivity, which can enable clear differentiation of foreign matter from cotton fiber. Images collected with this sensor have 256 x 318 pixels with 12-bit resolution and are stored in double precision (64-bit) binary arrays. A sampling window of 3-mm thick Borofloat glass was
integrated into a press frame (Fig. 2), enabling samples to be compressed flat against the window, presenting a roughly planar and void-free surface of cotton with some foreign matter interspersed. Because of the physi-cal compression of the cotton sample against sampling glass, the surface image was taken as representative of the cotton and foreign matter composition. The overall imaging system was designed to be compact to simplify harvester adaptation, but minimum size was limited by the 25-mm focal distance of the camera’s lens. A steel frame was built to hold the camera and cotton sample at a constant position relative to each other. A pair of 50-W quartz-tungsten-halogen (QTH) lamps (MR16 Superline™ Reflecto™ Series; Ushio Corp., Cypress, CA) served as the light source because of their consis-tent spectral output and emission across the visible and NIR range. The lamps were placed at the corners of the frame in positions that prevented direct reflection from the sampling window to the sensor.
Wavelength (nm)
Reflectance (%)
0 20 40 60 80 100
0 300 600 900 1200 1500 1800 2100
Fiber Trash
Figure 1. Spectral reflectance of cotton fiber and cotton trash (unpublished data).
The objective of this research was to design, build, and test a system that collects and analyzes visible and NIR images to estimate micronaire on cotton samples. Specific questions address (1) how accurately the system could measure micronaire in samples of machine-harvested seed cotton and lint and (2) how different methods of segmenting foreign matter from fiber affected the accuracy.
MATERIALS AND METHODS
System Design. The following components were required for a system to collect, store, and process images of cotton samples: (1) an imaging sensor that (a) provides sensitivity to variation in cotton fiber fine -ness and maturity and (b) can differentiate between fiber and foreign matter, (2) a device to present cot -ton samples to the imaging sensor, (3) a frame that defines and maintains the relative position between
388
The sensing system required multiple images of the same cotton sample through different opti-cal filters, so a motor-driven wheel (model F102B; ThorLabs, Newton, NJ) was incorporated to switch the filters without moving other system components. Optical band-pass filters at 1450, 1550, and 1600 nm (part number FB1450-12, Fig. 3; FB1550-12, Fig. 4; and FB1600-12, Fig. 5; ThorLabs, Newton, NJ) were selected for their transmission properties in wavebands that had shown strong correlation to cotton fiber micronaire in the work of Sui et al. (2008). Filters at 650 and 1300 nm (part number FB650-40, Fig. 6; FB1300-30 Fig. 7; ThorLabs, Newton, NJ) were selected for their ability to dif-ferentiate fiber from foreign matter according to unpublished data by Thomasson and Sui. A set of biconvex lenses transmitted the image across the filters in the filter wheel (Fig. 8). In the images collected each pixel represented 0.0625 mm2 of a
cotton-sample surface.
Figure 3. Transmission curve for the 1450-nm band-pass filter with 12-nm FWHM.
0% 5% 10% 15% 20% 25% 30% 35% 40% 45%
1400 1410 1420 1430 1440 1450 1460 1470 1480 1490 1500
0% 10% 20% 30% 40% 50% 60% 70%
1500 1510 1520 1530 1540 1550 1560 1570 1580 1590 1600
Figure 4. Transmission curve for the 1550-nm band-pass filter with 12-nm FWHM.
0% 10% 20% 30% 40% 50% 60% 70%
1550 1560 1570 1580 1590 1600 1610 1620 1630 1640 1650
Figure 5. Transmission curve for the 1600-nm band-pass filter with 12-nm FWHM.
0% 10% 20% 30% 40% 50% 60% 70% 80% 90%
600 610 620 630 640 650 660 670 680 690 700
Figure 6. Transmission curve for the 650-nm band-pass filter with 40-nm FWHM.
0% 10% 20% 30% 40% 50% 60%
1240 1260 1280 1300 1320 1340 1360
Figure 7. Transmission curve for the 1300-nm band-pass filter with 30-nm FWHM.
A laptop computer (Dell Corp., Round Rock, TX) controlled the filter wheel through a USB-to-se -rial adapter and the camera through a frame-grabber card (PCI-1422; National Instruments, Austin, TX). Computer algorithms were written in C++ to control system operation, calibration, and image preprocess-ing. MATLAB (Version 7; MathWorks, Natick, MA) code was written to post-process images.
The control system was designed to receive input from the sampling mechanism during automated op-eration, which would indicate that a cotton sample had been collected and placed on the sample window. The control system would then position the appropriate optical filter between the image sensor and the cotton The camera’s spectral sensitivity, along with
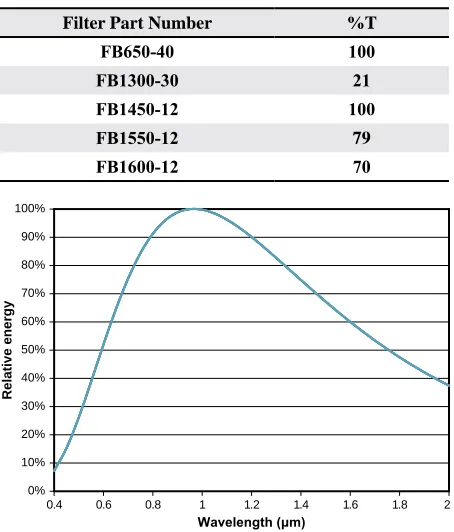
the spectral transmission properties of the vari-ous filters and the spectral emission properties of the light source, caused great variation in sensor response when filters were changed. Thus, neu -tral density filters were added to the band-pass filters, and the required transmission level of each (Table 1) was estimated by considering spectral energy content from light source to sensor. The components included in the calculations were the lamps (Fig. 9), the reflectance of a typical cotton sample (Fig. 10), each of the band-pass filters, and the imaging sensor (Fig. 11). Spectrally flat components (i.e., lenses) were excluded. These filter modifications roughly balanced the camera sensitivity across all the filters so that aperture and integration times could be held constant. Even though no significant refraction was expected to occur due to minor thickness differences of the optical filter combinations, a clear glass blank was attached to each to equalize the thickness of the filter combinations.
Table 1. Neutral density requirements on commercially available optical band-pass filters
Filter Part Number %T
FB650-40 100
FB1300-30 21
FB1450-12 100
FB1550-12 79
FB1600-12 70
Figure 9. Spectral data for the relative energy provided by the QTH lamps.
0% 10% 20% 30% 40% 50% 60% 70% 80% 90% 100%
0.4 0.6 0.8 1 1.2 1.4 1.6 1.8 2
Relative energy
Wavelength (μm)
0% 10% 20% 30% 40% 50% 60% 70% 80% 90%
400 600 800 1000 1200 1400 1600 1800 2000 Wavelength (nm)
Reflectance
Figure 10. Average spectral reflectance data for cotton fiber (Sui et al., 2008).
390
sample. Then an image specific to the current filter would be collected and stored before the wheel would move again. After images were collected through all optical filters, the processor would direct the sampling mechanism to release the current sample and begin collecting the next. During the actual experiment, sampling was done manually and input to the control system was given by the operator.
The calibration program used flat-field correction to account for any non-uniform illumination on the cot-ton samples. The program directed the operator to place a plain white reference in the cotton sample holder so that it could be presented to the imaging sensor as a cot-ton sample would be. The system then acquired images through each filter and created a map of illumination variability that would be used during preprocessing to correct images of cotton for non-uniform illumination through each of the five optical filters.
During post-processing, a particular image was analyzed to identify and exclude foreign matter pixels from those used to measure the reflectance of cotton fiber at each wavelength. Pixels were classified as “cotton” or “foreign matter” based on a modified ver -sion of Otsu’s method (Otsu, 1979), a dynamic thresh -olding method that previously had resulted in a strong relationship between NIR reflectance of fiber from International Cotton Calibration Standards and their micronaire values (Sui et al., 2008). With this method, a histogram of the pixel values in the cotton sample image was generated, and the distance between each pixel value and the mode pixel value was calculated. Both high and low threshold limits were set based on a preselected proportional distance from the mode pixel value. Pixel values between the thresholds were taken as representing cotton and those outside the thresholds were taken as representing foreign matter. Two images were used to differentiate foreign matter from fiber and the results were compared between the two. (1) A ratio image of the 650-nm and 1300-nm waveband images was calculated based on unpublished data by Thomasson and Sui, which indicated major differ-ences in the way cotton fiber and foreign matter reflect light in these two wavelengths. The threshold limit parameters in this case were to exclude 10% of the pixels from the lower side of the histogram and pixels with values more than 1.5 times the mode value. (2) The original image at 650 nm was used by itself. The threshold limit parameters in this case were to exclude 12% of the pixels from the high end of the histogram and then set the lower limit at the same distance as from the upper limit to the mode.
Experiment. A laboratory-based experiment was conducted to evaluate the operation of the fiber-quality sensing system and to quantify the relationship between seed cotton fiber reflectance and HVI micronaire values. Cotton samples were collected at the Texas A&M AgriLife Research farm in Burleson County, Texas. Because Stanislav and Morgan (2007) found a relationship between soil apparent electrical conductivity (ECa) in these fields and cotton fiber micronaire, ECa data were
used to locate sampling points likely to maximize variation in micronaire values. The ECa data were
organized into three groups: low, medium, and high. Stratified random sampling was used to generate a similar number of sampling points in each ECa
group. A total of 86 sampling points were located with GPS and flagged, and samples were collected during harvest operations in 2008 and 2009. At each flag, cotton samples were collected from the duct of a John Deere 9965 cotton picker by reaching with a gloved hand into the airflow at the duct outlet and intercepting the cotton before it went into the picker basket. Several handfuls were required to collect approximately 0.25 kg of seed cotton per sample site, allowing plenty for presentation to the fiber-quality sensing system.
Because QTH lamps take time to reach a consis -tent operating temperature and their energy output varies with temperature, the fiber quality sensing sys -tem was turned on and allowed to equilibrate for at least 30 min. at the beginning of each data-collection session. After warm up, the camera was calibrated by adjusting gain and offset to provide expected outputs for dark and light reference tiles that were relatively spectrally flat across the spectral range of interest. After calibration, a 100-g (0.22-lb) subsample from
each of the seed cotton samples was presented to the imaging system. The subsamples were pressed evenly in the press frame and then aligned with the positioning marks on the camera for image collec-tion. The user operated the control-system software to initialize data collection.
lev-els ranged from 3.1 to 4.7 for the 2008 harvest and 3.8 to 5.1 for the 2009 harvest. Samples from both years were combined into one group for analysis. The cotton pixel values in each sample’s NIR image set were averaged, and these averages were compared to HVI micronaire values of the samples using multiple linear regression, in which micronaire value was the dependent variable. Models of one, two, and three regressors (image wavelengths) were compared for their ability to estimate micronaire.
RESULTS AND DISCUSSION
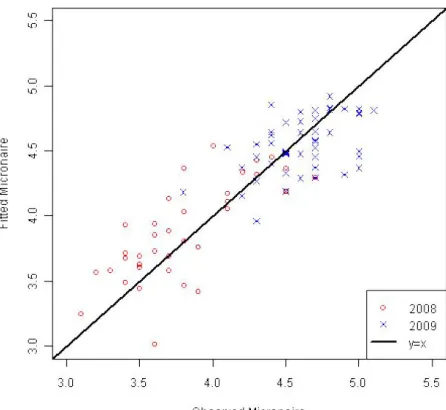
Overall, the fiber quality sensing system per -formed as designed and analysis of image data collected with the system resulted in a strong re-lationship between seed cotton image pixel values and the micronaire values of the ginned lint samples. The correlation was slightly stronger (R2 = 0.74)
when basing the cotton versus foreign-matter pixel classification on the single image at 650 nm than on the 650- and 1350-nm image ratio (R2 = 0.73;
Fig. 12; Table 2). Estimated micronaire values for seed cotton had a linear relationship with measured values, and half of the estimates were within 0.2 units of measured micronaire. The relationship between image pixel values and micronaire was even stronger (R2 = 0.85 and 0.86, respectively)
for the ginned lint samples.
It is clear that correlations between image-based reflectance and micronaire are stronger with lint cot -ton than with seed cot-ton (Table 2). This result is not surprising, because foreign matter makes up a much larger portion of seed cotton than lint. To confirm the effects of foreign matter on reflectance measurements, one can note that Thomasson et al. (2005b) showed the relationship between uncleaned lint color and cleaned lint color to be much stronger than the relationship between seed cotton color and cleaned lint color.
Figure 12. Estimated vs. observed ratio image method; seed cotton.
Table 2. Linear regression results; generated using both seed-cotton and lint-cotton, and both the single-image and
image-ratio method of trash removal
Optical band-pass filter
wavelength (nm)
Single Image Method Image Ratio Method
R2 Adj. R2 RMSE R2 Adj. R2 RMSE
Seed Cotton
1450 + 1550 + 1600 0.74 0.73 0.27 0.73 0.72 0.28
1450 + 1550 0.73 0.72 0.27 0.72 0.71 0.28
1550 + 1600 0.73 0.73 0.27 0.72 0.71 0.28
1450 + 1600 0.74 0.73 0.27 0.72 0.71 0.28
1450 0.68 0.67 0.30 0.66 0.65 0.31
1550 0.73 0.73 0.27 0.71 0.71 0.28
1600 0.73 0.73 0.27 0.71 0.71 0.28
Lint Cotton
1450 + 1550 + 1600 0.85 0.85 0.20 0.86 0.86 0.20
1450 + 1550 0.85 0.85 0.20 0.86 0.86 0.20
1550 + 1600 0.85 0.85 0.20 0.86 0.86 0.19
1450 + 1600 0.84 0.84 0.21 0.85 0.85 0.20
1450 0.80 0.80 0.23 0.81 0.81 0.23
1550 0.85 0.85 0.20 0.86 0.86 0.20
392
It is also clear that the image used for threshold-ing, whether a single image at 650 nm or an image ra-tio of 650 and 1350 nm, was not a major factor in the strength of relationship between cotton reflectance and micronaire. For seed cotton, the single-image method resulted in a slightly higher R2 value (0.74
vs. 0.73). For lint cotton, the ratio-image method resulted in a slightly higher R2 value (0.86 vs. 0.85)
What might be somewhat surprising is that in most cases, reflectance in one wavelength was virtually as predictive of micronaire as reflectance in multiple wavelengths (Table 2). For seed cotton, the best one-regressor model (1550 or 1600 nm) had an R2 value of 0.73, whereas the three-regressor
model had an R2 value of 0.74. For lint cotton, the best one-regressor model (1550 nm) had an R2 value
of 0.86, whereas the three-regressor model also had an R2 value of 0.86. One might infer from this result that one spectral band would be adequate for estimating micronaire, but experience suggests that a sensor including multiple wavelengths will have superior robustness over a wide range of samples and environmental conditions.
Although the relationship between lint reflec -tance and micronaire was not as strong (R2 = 0.86
vs. R2 = 0.99) as in the report of Sui et al. (2008), it
must be kept in mind that the lint used in this study was not specially prepared and had not been cleaned at all after harvest except for being run through a gin stand. The lint in the earlier report was specially prepared, very clean and uniform, International Cotton Calibration Standards. Thus it is likely that a major difference in strength of the relationship was the difference in foreign matter and prepara-tion in the sets of cotton samples. Furthermore, the range of micronaire values in this study was 3.1 to 5.1, whereas the earlier study had a range of 2.7 to 5.6. This difference likely also explains some of the difference in strength of relationship.
To develop a dedicated sensor for harvester-based fiber quality measurement, simplicity and speed are desirable. Both of these can be achieved by reducing the number of spectral bands measured to as few as possible without negatively affecting accuracy. Be-cause the results indicate that thresholding for trash based on one visible image was about as accurate as using a ratio of one visible and one NIR band, it is apparent that one visible band would be a better choice. Also, although one band was almost as accurate at estimating micronaire as were three bands, robustness is improved by using multiple bands, so it appears
that two bands would be the best choice. Thus, a vis-ible Indium Gallium Arsenide camera with rotating filters at 650, 1550, and 1600 nm should constitute a reasonably accurate and simple system.
CONCLUSIONS
A system was designed, built, and tested to acquire images of seed cotton, process them by removing the effects of the foreign-matter particles, and then aver-age the reflectance of the cotton pixels and relate it to the measured micronaire value of the cotton fiber. The prototype system operated as designed and offers potential for being adapted to use on board a harvester, which would enable the creation of detailed fiber quality spatial-variability maps. The system showed a strong linear relationship between the reflectance of the fiber portion of seed cotton samples and mi -cronaire values, and 50% of the estimated mi-cronaire values were within 0.2 micronaire units of the HVI measured value. Analyses suggest that a camera sensitive to visible and NIR energy could be used as the sensor in such a system with only three optical band-pass filters. One at 650 nm could be used to detect foreign matter, and two at 1550 and 1600 nm could be used to estimate micronaire.
REFERENCES
ASTM. 2011. Standard Test Method for Micronaire Reading
of Cotton Fibers. ASTM Standard D1448–11. ASTM
International, West Conshohocken, PA.
Ge, Y., J.A. Thomasson, R. Sui, C.L. Morgan, S.W. Searcy,
and C.B. Parnell. 2008. Spatial variation of fiber quality and associated loan rate in a dryland cotton field. Preci
-sion Agric. 9(4):181–194.
Ge, Y., J.A. Thomasson, C.L.S. Morgan, S. Stanislav, and R. Sui. 2011. Cotton revenue apportioned between lint yield
and fiber quality: a precision agriculture perspective. J. Cotton Sci. 15:274–281.
Ge, Y., J.A. Thomasson, and R. Sui. 2012. Wireless and GPS
system for cotton fiber-quality mapping. Precision Agric. 13(1):90-103.
Johnson, R.M., R.G. Downer, J.M. Bradow, P.J. Bauer, and
E.J. Sadler. 2002. Variability in cotton fiber yield, fiber quality, and soil properties in a Southeastern Coastal Plain. Agronomy J. 94(6):1305–1316.
Otsu, N., 1979. A threshold selection method from gray-level histograms. IEEE Trans. Syst., Man, Cybern., Syst.
Rodgers, J., J. Montalvo, G. Davidonis, and T. Von Hoven.
2009. Near infrared measurement of cotton fiber micro
-naire, maturity and fineness – a comparative investiga
-tion. Textile Res. J. 80(9):780–793.
Sassenrath, G.F., E.R. Adams, and J.R. Williford. 2005. Rapid
sampling system for determination of cotton fiber quality spatial variability. Applied Eng. Agric. 21(1): 9–14.
Sjolander, A.J., J.A. Thomasson, R. Sui, and Y. Ge. 2011a. Wireless tracking of cotton modules. Part 1: automatic
message triggering. Comput. Electron. Agric. 75(1):23–
33.
Sjolander, A. J., J.A. Thomasson, R. Sui, and Y. Ge. 2011b. Wireless tracking of cotton modules. Part 2: automatic
machine identification and system testing. Comput. Elec
-tron. Agric. 75(1):34–43.
Stanislav, S., and C. Morgan. 2007. Poster: Evaluating electri-cal conductivity based management zones for cotton lint
quality. Presented at ASA Annual International Meeting, 4-8 Nov. 2008, New Orleans, LA.
Sui, R., J.A. Thomasson, Y. Ge, and C. Morgan. 2008.
Mul-tispectral sensor for in-situ cotton fiber quality measure -ment. In Proc Amer. Soc. Agric. Biol. Eng. Inter. (AS -ABE) Meeting. July 9-12, 2006, Portland, OR. ASABE
Paper No. 083735. ASABE, St. Joseph, MI.
Thomasson, J.A., and S.A. Shearer. 1995. Correlation of NIR
data with cotton quality characteristics. Trans. ASAE 38(4):1005–1010.
Thomasson, J.A., S.A. Shearer, and R.K. Byler. 2005a. Image-processing solution to cotton color measurement problems: Part I. Instrument design and construction.
Trans. ASAE. 48(2):421–438.
Thomasson, J.A., S.A. Shearer, and D.L. Boykin. 2005b. Image-processing solution to cotton color measurement problems: Part II. Instrument test and evaluation. Trans.
ASAE. 48(2):439–454.
Zhang, H., and D. Li. 2014. Applications of computer vision techniques to cotton foreign matter inspection: a review.
Comput. Electron. Agric.109(2014):59–70.