University of New Orleans University of New Orleans
ScholarWorks@UNO
ScholarWorks@UNO
University of New Orleans Theses and
Dissertations Dissertations and Theses
Summer 8-4-2011
Subsurface controls on mainland marsh shoreline response
Subsurface controls on mainland marsh shoreline response
during barrier island transgressive submergence
during barrier island transgressive submergence
Mary Ellison
University of New Orleans, [email protected]
Follow this and additional works at: https://scholarworks.uno.edu/td
Part of the Earth Sciences Commons, Environmental Sciences Commons, and the Fresh Water Studies Commons
Recommended Citation Recommended Citation
Ellison, Mary, "Subsurface controls on mainland marsh shoreline response during barrier island transgressive submergence" (2011). University of New Orleans Theses and Dissertations. 458.
https://scholarworks.uno.edu/td/458
This Thesis is protected by copyright and/or related rights. It has been brought to you by ScholarWorks@UNO with permission from the rights-holder(s). You are free to use this Thesis in any way that is permitted by the copyright and related rights legislation that applies to your use. For other uses you need to obtain permission from the rights-holder(s) directly, unless additional rights are indicated by a Creative Commons license in the record and/or on the work itself.
Subsurface controls on mainland marsh shoreline response during barrier island transgressive submergence
A Thesis
Submitted to the Graduate Faculty of the University of New Orleans in partial fulfillment of the requirements for the degree of
Master of Science in
Earth and Environmental Sciences Coastal Geology
by
Mary S. Ellison
B.A. Boston University, 2008
ii
iii
Acknowledgements
I would like to acknowledge the funding provided by the Gulf Coast Association of
Geological Societies Student Research Grant and the U.S. Geological Survey Northern Gulf of
Mexico (NGOM) Ecosystem Change and Hazard Susceptibility Project.
I would like to thank my advisor, Dr. Mark Kulp, for his guidance and assistance. Your
willingness to set aside time in your hectic schedule and your dedication to science has been
greatly appreciated. I would also like to thank Dr. Michael Miner for his input and help forming
ideas and editing this thesis. Your insight and knowledge has expanded my understanding of not
only Louisiana coastal geology, but geologic processes in general. Last but certainly not least, I
would like to thank Dr. Ioannis Georgiou for miscellaneous advice. You have been incredibly
helpful and compassionate throughout this process.
Thanks to Mike Brown and Phil McCarty for putting up with me during field work and
showing me the way it is done down in Louisiana. Thanks to Dallon Weathers for helping me
with any technical issues, and as always, providing some much needed laughter.
Finally, thanks to all my family and friends who have always been supportive of my
iv
Table of Contents
List of Figures ... vi
List of Tables ... ix
Abstract ...x
Introduction ...1
Key Questions ...3
Research Goals and Hypothesis ...5
Background ...8
Delta Plain Development ...8
St. Bernard Delta Complex ...9
Marsh Platforms of the Mississippi River Delta Plain ... 11
Barrier Island Formation ... 12
Barrier Island Response to Sea Level Rise ... 14
Barrier Island Formation on the Mississippi River Delta Plain ... 16
Methods and Data ... 21
Historic Datasets and Regional Stratigraphic Relationships ... 21
Recent Data and Shallow Stratigraphy ... 23
Modern Marsh Surface Data ... 25
Coastwide Reference Monitoring System ... 26
Bathymetric Data of Chandeleur Sound ... 28
Results ... 30
Regional Stratigraphy ... 30
Shallow Stratigraphy ... 38
Modern Marsh Surface ... 43
Bathymetric Profiles of Chandeleur Sound and Seaward of the Chandeleur Islands ... 45
Discussion ... 47
Stratigraphic Models... 47
Volumetric Calculations ... 47
Modern Marsh Surface ... 50
Conclusion ... 59
v
Modern Marsh Surface ... 59
References ... 63
Appendix A - Vibracore Description Sheets ... 72
Appendix B - Cross-sections ... 99
vi List of Figures
Figure 1 - Area map showing the locations of major water bodies: Lake Pontchartrain, Lake Borgne, and Chandeleur Sound as well as the Mississippi River-Gulf Outlet (MR- GO) and the Mississippi River to the south. The study area is located to the northeast of the MR-GO in the red circle. ...4 Figure 2 - Map showing the timing and spatial relationships between various delta complexes of
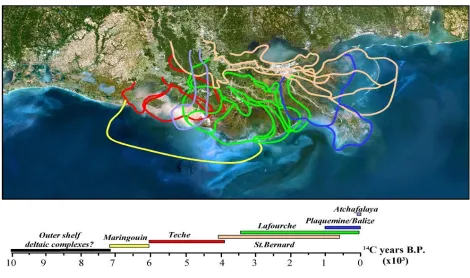
the Mississippi River. The St. Bernard delta complex is located in the east (color tan here), and extends out past the arc of the Chandeleur Islands. Kulp et al. (2005) modified from Frazier (1967). ...9 Figure 3 - Conceptual model of the delta cycle. The top half of the graph has two scales: Delta
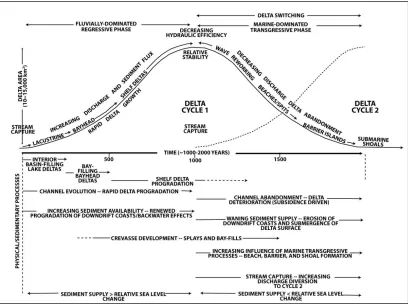
area and time. Notice that time also correlates to the shift between the regressive and transgressive phases. The lower half of the graph describes the sedimentary processes related to relative sea level rise and sediment supply. Reproduced from Roberts (1997). 10 Figure 4 - Formation and evolution of barrier islands on the Mississippi River delta plain. The
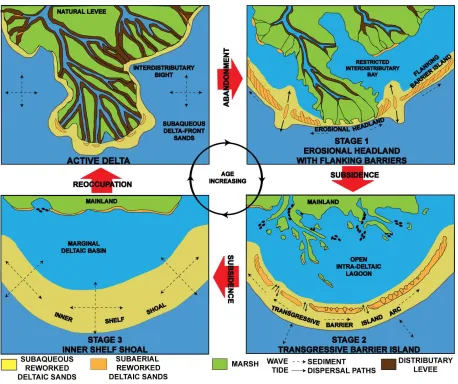
first stage is initiated by fluvial abandonment, and further stages are driven by the combined forces sea-level rise and subsidence. The transition from Stage 2 to Stage 3 is the primary focus of this research, and the formation of the sandy shoreline shown in Stage 3. Modified from Penland et al. , 1988... 18 Figure 5 - Locations of borings and cross-sections. Borings and cross-sections from Kolb and
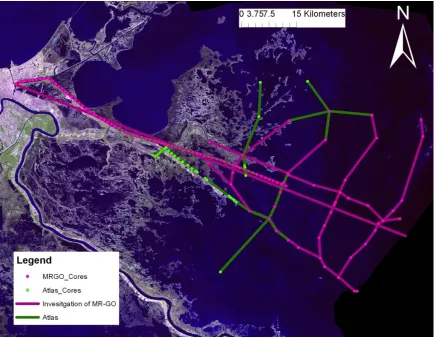
van Lopik (1958a) are shown as magenta dots and lines. Borings and cross-sections from Kolb and van Lopik (1958b) are shown as green dots and lines. Satellite image is a 2005 LANDSAT image accessed through Louisiana State University's Atlas website
(atlas.lsu.edu) ... 22 Figure 6 - Locations of vibracores in the St. Bernard Marsh from 2001 to 2009. Satellite image
was accessed through LSU's Atlas website (atlas.lsu.edu) ... 24 Figure 7 - Locations of CRMS sites in the St. Bernard marsh from coordinates obtained online at
www.lacoast.gov/crms. CRMS data includes locations, accretion rates, vegetation types, as well as hydrologic data for a given site. ... 28 Figure 8 - Bathymetry of the north-central Gulf of Mexico (Schindler, 2010). Transects (pink)
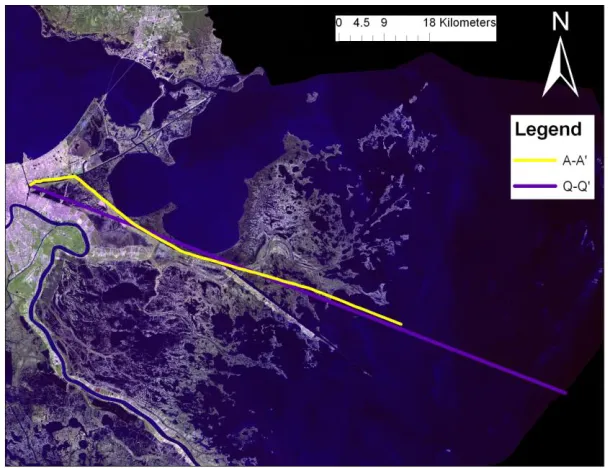
were extracted from this data to produce profiles of the marsh and Chandeleur island shoreline. Grid coordinates are in meters, Universal Transverse Mercator (UTM) Zone 15N. ... 29 Figure 9 - Locations of cross-sections A-A' and Q-Q'. ... 30 Figure 10 - Cross-section based on over 60 borings, modified from Kolb and van Lopik (1958a),
showing discrete locations of deltaic deposits, including locations of formerly active distributary channels. ... 33 Figure 11 - Idealized cross-section of the St. Bernard delta complex showing the distribution and
location of deltaic deposits. Modified from Kolb and van Lopik (1958a). ... 34 Figure 12 - Fence diagram of the St. Bernard delta complex showing the location and
vii
van Lopik (1958a, b). This model contains spatial inaccuracies (i.e. the location of point bar deposits), but does provide a useful conceptual model for the St. Bernard delta.
Vertical Exaggeration is 1000. ... 36 Figure 13 - Fence diagram of the lower St. Bernard delta complex showing a more detailed view
of the lower-delta complex. Vertical Exaggeration is 600. ... 37 Figure 14 - Three dimensional block diagram of the St. Bernard delta complex based on cores
and cross-sections provided by Kolb and van Lopik. Vertical Exaggeration is 1500. ... 38 Figure 15 - C-C' trending north to south along Bayou La Loutre for 5 kilometers. Notice the lack
of sand-rich material in the cores and also in the cross-section in general. CL is clay, ST is silt, FS is fine sand, and MS is medium sand. The vertical scale is in meters. ... 42 Figure 16 - Cross-section Z-Z' that trends north-south across the study area for a distance of 6
km. This cross section indicates the high sand content and the range of lithologies that are present in this area. Lithofacies have been interpreted to show the depositional
environments. ... 43 Figure 17 - Shoreface profiles, both from bathymetric data (Schindler, 2010) in red and blue,
and an empirically derived equation (blue; Wilson and Allison, 2008; y=-1.5e(-0.05x)), showing the window of ravinement between the blue and red profiles. The blue and green lines are considered the current shoreline profiles of the St. Bernard marsh. The red profile, which was extracted from the Gulf side of the Chandeleur Islands, is considered to be the profile to which the current marsh profiles will equilibrate as the Chandeleur Islands disintegrate and submerge. ... 46 Figure 18 - Locations of sand bodies in the St. Bernard delta complex located above the window
of ravinement depth (12 m). ... 48 Figure 19 - Oblique aerial photograph near Isle Au Pitre in the northermost extent of the St.
Bernard marshes, looking south. Notice the evidence of waves washing into the marsh and overwash platforms behind the shell shoreline. ... 53 Figure 20 - Oblique aerial photograph of Martin Island, located in Chandeleur Sound, looking
west. Notice the marsh platform exposed seaward of the shell shoreline on the southern shoreline. ... 54 Figure 21 - Plan-view conceptual geomorphic model suggesting a progression of shell pocket
beaches to submerged shell mounds, note the shell pocket beaches occur more inland than the shell-rimmed marsh islands and the subaqueous shell mounds. Relict distributary channels are preferentially preserved due to their lithology (compacted silts and clays more resistant to erosion). As these channels become isolated, shell-rimmed islands form, which eventually become shell islands due to the inability of the marsh to accrete
vertically. Eventually, subsidence forces the entire mass to submerge as a shell mound. 55 Figure 22 - Conceptual model of marsh-edge processes contributing to the formation of shell
viii
winnowed, leaving behind a shell pocket beach. Eventually, this shells smother the marsh, but also serve to armor the shoreline and fundamentally change the equilibrium profile. S1, S2, and S3 are subsidence lines indicating the progression of subsidence in the marsh system. ... 56 Figure 23 - Conceptual model showing the the influence of sandy material on the shoreline. C is
ix List of Tables
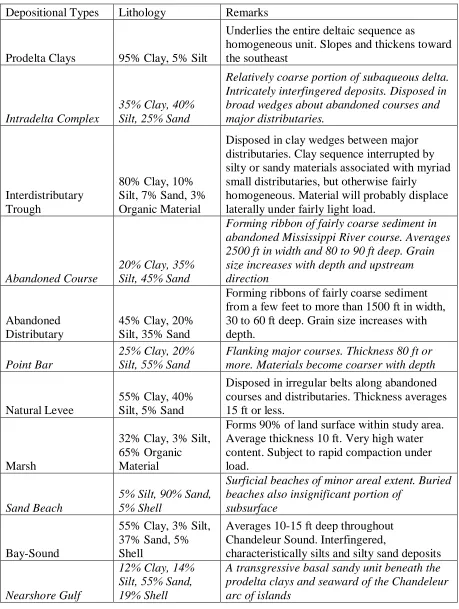
Table 1 - Table of the stratigraphic facies as identified and described by Kolb and van Lopik (1958a). The italicized facies are sand-rich. All text is from Kolb and van Lopik (1958a), but percentages are from Kolb and van Lopik (1966). ... 31 Table 2 - This table shows volumetric calculations for various sand bodies located in the
x Abstract
Many recent studies have sought to understand the response of barrier islands and their attendant marshes to sea level rise. The Mississippi River delta plain, specifically the Chandeleur Islands and associated interior wetlands in eastern Louisiana, serves as an excellent natural laboratory for studying these responses. This region is presently undergoing the highest rates of shoreline erosion (> 15 m yr-1) in North America as wetlands are converted to open water in a regime of subsidence-driven rapid relative sea-level rise (~1 cm yr-1). Three conceptual models were developed based on the geomorphic relationships observed in the marsh that describe and predict shoreline processes as the Chandeleur Islands continue to disintegrate and submerge. These models indicate that shells are the dominant shoreline-forming material in the marsh due to the lack of sand-rich strata in the subsurface of the marsh.
1 Introduction
The Mississippi River delta plain is currently experiencing high rates of erosion as
formerly active deltaic headlands and associated wetlands become inundated due to combined
pressures of eustatic sea level rise and subsidence (Williams et al., 2006; Penland et al., 1990).
An average of 5 mm yr-1 of relative sea level rise for southeast Louisiana has been suggested by
various authors using a variety of methods (Törnqvist et al., 2004; Penland and Ramsey, 1990;
Kolb and van Lopik, 1958b) and is considered an accurate value for relative sea level rise in
southeast Louisiana. While relative sea level rise across the modern delta plain is detrimental to
the many coastal environments and ecosystems, it is also a fundamental component of the
regional coastal system evolution through geologic timescales.
In a healthy deltaic system, sediment deposited by the river would allow for vertical
accretion in the marshes and offset the impacts of relative sea level rise. Since the 1950s, the
Mississippi River has been increasingly channelized and restricted by man-made levee systems
so that the majority of the sediment from the river deposits in deep water off the modern Birdfoot
delta (Blum and Roberts, 2009). Additionally, the amount of sediment carried by Mississippi
River during construction of the Holocene delta was much higher than modern sediment loads in
the river, mainly due to the abundance of upstream dams and irrigation (Meade et al., 1990). As
a result, the Mississippi River delta is sediment-starved and unable to combat relative sea level
rise as effectively as in the recent past (Blum and Roberts, 2009)
The Mississippi River delta plain is composed of active and inactive distributary
networks separated by interdistributary bays and wetlands. The majority of the flow from the
Mississippi River is concentrated to the modern "Birdfoot" delta and Atchafalaya River bayhead
2
structure is fronted by barrier islands, such as Grand Isle, associated with Holocene delta lobes.
An existing three-stage, conceptual model for the formation and evolution of barrier islands from
abandoned deltaic headlands within the Holocene Mississippi River delta plain invokes a high
rate of relative sea level rise as a contributory mechanism by which Mississippi River delta
barrier island systems form (Penland et al., 1988). The first stage of the evolutionary model
commences when a delta lobe is abandoned by fluvial processes and attendant sediment load due
to an upstream avulsion. In turn, a new deltaic depocenter is developed at a distant geographic
location. As a consequence of the reduced sediment load the abandoned deltaic headland is
subjected to transgression and reworking by marine processes, which leads to the generation of
terminal spits and barrier islands flanking the deltaic headland (stage 1 of the conceptual model;
Figure 4; Penland et al., 1988). Interior wetland submergence due to relative sea level rise, edge
erosion by waves in bays, and scour due to tidal currents forces the transgressive shoreline to
become detached from the mainland, forming a barrier island arc (stage 2; Penland et al., 1988).
Continued loss of sandy sediment from the barrier shoreline and relative sea level rise leads to
transgressive submergence, the conversion of barriers islands to subaqueous sand shoals (stage 3;
Penland et al., 1988). There remains however temporal intervals of the conceptual model (100 to
1,000 yrs) for which the process controlling the overall evolution are not well understood. For
example, the mainland detachment process as the stage 1 barrier forms a detached stage 2 barrier
is not well understood and the timeframe of this evolution is not well defined. Moreover, it is
widely recognized that a fundamental requirement of forming a sandy barrier shoreline is the
presence of coarse-grained sediment that can be liberated from the deltaic headland through
shoreface retreat. The source of sediment for the barriers in this conceptual model is sand-rich
3
al., 1988). The relative role and importance that the availability of subsurface sediment, relative
sea level rise processes, and tidal prism evolution play in shoreline formation along the
Mississippi River delta are prime examples where many questions yet remain.
Key Questions
The research presented herein focuses on the fate of the St Bernard marshes which are
located to the east of New Orleans (Figure 1). During the last decade, the Chandeleur Islands,
which front the marshes, have become progressively more fragmented due to lack of sediment
supply and relative sea level rise. It has been suggested that the islands are crossing the
transgressive submergence threshold and becoming a subaqueous shoal system (Fearnley et al.,
2009; Miner et al., 2009; Rogers et al., 2009, and others). As the Chandeleur Islands have
fragmented, the St. Bernard marshes have been exposed to progressively more open Gulf
processes, and the complete disappearance of the islands would lead to fully open marine
conditions impacting the St. Bernard marshes. On the basis of existing models for shoreline
systems of the Mississippi River delta, submergence of the Chandeleur Islands could lead to the
development of a sandy shoreline along the modern seaward periphery of the upper Chandeleur
Sound marshes (Penland et al., 1988; Figure 1, circled area). This is possible if there is an
adequate volume of sandy sediment in the subsurface to contribute to sandy shoreline
development. Typical barrier shorelines in Louisiana are composed of fine-grained sand, and this
is the coarse fraction of sediment found in the Mississippi River delta plain (Penland et al.,
1988). If sand is absent from the eroding marsh, it is unlikely that a sand-rich shoreline will
form, unless this sand originated from another source. Moreover, if an adequate amount of sandy
sediment is present, then the marsh that backs the shoreline must be stable enough to support
4
ability to remain in place during changing marine conditions and the ability of the marsh to
remain above sea level when loaded with coarse-grained sediment. Thus a secondary focus of
this thesis addresses the geomorphology and erosional processes within the marsh and their
correlation to modern marsh accretionary processes. Marsh stability during periods of 100 to
1000 years relevant to this study is locally governed by types of erosion and rates of accretion
(and thus stability; DeLaune et al., 1989). However, if there are no sand-rich strata in the
subsurface to contribute to a sandy shoreline, but the marsh is stable enough to support a sandy
beach shoreline, a "substitute" coarse-grained material, such as shells and shell hash, may
contribute toward development of coarse-grained shorelines. A third point of this research
focuses on the timing and nature of marine conditions that will likely impact the marsh shoreline
if the Chandeleur Islands become submerged and fully converted to inner shelf shoals as
predicted by Fearnley et al., (2009).
Figure 1 - Area map showing the locations of major water bodies: Lake Pontchartrain, Lake Borgne, and Chandeleur Sound as well as the Mississippi River-Gulf Outlet (MR- GO) and the Mississippi River to the south. The
5
Research Goals and Hypothesis
The research goals for this study are to: (1) identify and quantify the availability and
amount of subsurface sediment that would be hydrodynamically suitable for barrier shoreline
material, (2) describe and categorize the historic St. Bernard marsh response to relative sea level
rise, and (3) quantify the relative contribution and nature of marine conditions that will impact
the shoreline with the disappearance of the Chandeleur Islands. Examination of the underlying
stratigraphy of the marsh will reveal the presence or absence of sandy facies, as well as identify
stable, relatively compaction resistant strata such as distributary natural levees. Marsh accretion,
in relation to localized subsidence, is important for determining marsh stability and soil content
and to assess its potential long term sustainability as a subaerial substrate supporting sandy
shoreline development. The geomorphic evolution of the marsh is important to understand
because it may provide insight into underlying stratigraphic controls on marsh stability and
response to hydrodynamic forcing. Additionally, geomorphic evolution of the Chandeleur
Islands, and particularly the surrounding bathymetry, will elucidate on the nature of the potential
marine conditions that will be affecting the future marsh shoreline.
The goal of this research is to establish whether sand-rich strata are present in the
subsurface of the upper Chandeleur Sound marshes. A second goal is to estimate whether there is
sufficient quantity of sand to generate a sandy shoreline as the periphery of the marsh platform
becomes progressively more exposed to open marine conditions. A working hypothesis of this
research is that if sand-rich strata exist in the subsurface of the upper sound marshes, they will
be localized to former distributary networks. Distributary networks are typically composed of
channel deposits, point bar and mouth bar deposits, and natural levees, all of which contain large
6
1) Is the sand located at a depth accessible by erosion? Specifically, will the equilibrium
profile for marsh erosion (Wilson and Allison, 2008) in this area intersect sand layers at
depth, or has relative sea level rise and marsh accretion led to the sands being too deep in
the subsurface? A second hypothesis is: If the sand-rich strata are available for
liberation during marsh shoreface retreat, they will be located within the vertical
ravinement envelope. The ravinement envelope is defined by the space above the
shoreline profile of the Chandeleur Islands but below the shoreline profile of the St.
Bernard marsh.
2) Is the marsh stable enough to enable a shoreline to form against it if sandy sediments
are liberated during shoreface ravinement in a regime of increasing wave energy?
Stability in marshes is achieved by balancing the magnitude of accretion with subsidence
and eustatic sea level change as well as the ability to resist wave erosion along the marsh
edge. Typically, in a marsh system where subsidence is high and clastic sediment
accumulation is low, organic vertical accretion must be sufficiently high to historically
keep pace with relative sea level changes. A fourth hypothesis is: If the marsh is stable,
then the accretion rates will be equal to or greater than relative sea level rates.
3) What do historical to recent marsh fragmentation patterns and mode of marsh
shoreline erosion tell us about response to increasing wave energy, tidal current and
prism evolution, and zones of relative stability? It appears that most of the remaining
marsh along the fringe overlies former distributary levees, which are fine-grained, highly
compacted deposits overlying coarser-grained channels, point bars, and crevasse splays.
7
hypothesis is that: If historical patterns of erosion in the marsh continue into the future,
8 Background
Delta Plain Development
The Mississippi River constructed an 30,000 km2 delta plain (Coleman et al., 1998)
along the northern Gulf of Mexico during the Holocene. Early studies of the Mississippi River
delta plain found different ages for the oldest deposits from 4250 years BP to 7250 years BP
(Fisk, 1944; Kolb and van Lopik, 1958b; and Frazier, 1967). Additionally, multiple delta
complexes and delta lobes within the delta plain were identified by each author. For the purposes
of clarification, a hierarchy of delta terminology was established by Roberts (1997). Delta
complexes are composed of multiple delta lobes fed by many distributary networks (Roberts
1997). Several studies (including those mentioned above and others) have sought to assign
chronology to not only delta complexes but also delta lobes within those complexes. A more
recent study by Törnqvist et al. (1996) revised ages for some of the delta complexes identified by
Frazier (1967; Figure 2). Törnqvist et al. (1996) developed this revision by dating basal peats
marking the initiation of fluvial occupation instead of the peats marking the end of activity,
which were sampled by Frazier (1967).
For the sake of simplicity, the delta complex terminology established by Frazier and the
chronology of deltaic development of Törnqvist et al. (1996) for each Holocene delta complex
will be used. Frazier (1967) identified four delta complexes, the Teche, the St. Bernard, the
Lafourche and the Modern-Plaquemines (also called the Balize). Törnqvist et al. (1996) assigned
timeframes of fluvial occupation to each lobe on the basis of radiocarbon dated peat deposits.
Each of these delta complexes represents a specific depo-center for the Mississippi River as it
9
overlap of these deltaic deposits produces complex subsurface stratigraphy, including multiple
transgressive and regressive facies successions (Figure 3; Roberts, 1997).
Figure 2 - Map showing the timing and spatial relationships between various delta complexes of the Mississippi River. The St. Bernard delta complex is located in the east (color tan here), and extends out past the arc of the Chandeleur
Islands. Kulp et al. (2005) modified from Frazier (1967).
St. Bernard Delta Complex
The St. Bernard delta complex was initially active at approximately 3,500 years BP and
abandoned approximately 1,500 years BP (Tornqvist et al., 1996). The delta complex extends
east from Lake Pontchartrain to the Chandeleur Islands (Frazier, 1967; Rogers et al. 2009). Once
the delta complex was abandoned, marine processes became dominant over fluvial processes and
shoreline processes, such as longshore transport, began to rework the deltaic sediment leading to
10
Figure 3 - Conceptual model of the delta cycle. The top half of the graph has two scales: Delta area and time. Notice that time also correlates to the shift between the regressive and transgressive phases. The lower half of the graph describes the
sedimentary processes related to relative sea level rise and sediment supply. Reproduced from Roberts (1997).
Kolb and van Lopik (1958a) completed a report on the Mississippi River-Gulf Outlet
(MRGO) channel as a pre-construction report on the sedimentary packages within the proposed
construction area in the late '50s and '60s. This report includes 115 borings and seven transects
along the proposed MRGO channel as well as within the St. Bernard marsh and Chandeleur
Sound to develop a regional stratigraphic framework of the delta complex. The work completed
by Kolb and van Lopik (1958a) classified the sedimentary units within these borings based on
environment of deposition and correlated these units along transects.
Subsequent studies, such as Frazier (1967), used the borings and cross-sections produced
by Kolb and van Lopik (1958a) to establish delta lobe and facies relationships in the St. Bernard
delta complex. Delta lobe relationships include both numbers assigned to individual lobes as well
11
lobe. Facies relationships include more detail than the original cross-sections of Kolb and van
Lopik (1958a); specifically, Frazier (1967) further divides the aforementioned facies
(progradational) into specific environments of deposition and lithology (i.e. delta-front silty
sand).
Marsh Platforms of the Mississippi River Delta Plain
Marshes form by vegetation colonizing low-lying muddy areas, such as tidal flats,
subsiding natural levees, or interdistributary deposits. Once these areas are well established with
vegetation, the marshes begin a cycle of accretion where they balance the magnitude of accretion
with subsidence and absolute sea level change as well as the ability to resist wave erosion along
the marsh edge (Delaune et al., 1989). Primarily, marshes maintain elevation in relation to sea
level through the process of vertical accretion. Accretion is the balance of sediment accumulation
and peat formation (DeLaune et al., 1989). Typically, in a marsh system where subsidence is
high and mineral accumulation is low, organic vertical accretion must be sufficiently high to
historically keep pace with regional subsidence-driven relative sea level changes. In Louisiana
marshes, a variety of studies have concluded that modern mineral sedimentation rates are not
adequate to offset rates of relative sea level rise (Cahoon and Reed, 1995; Rybczyk and Cahoon,
2002). These studies largely assumed that the mineral accretion was the primary source for
accretion on the marsh surface. In a study by Nyman et al. (2006), results indicated that marshes
were able to accrete organically through vegetative growth, even in marshes with considerably
high mineral sedimentation rates. These studies focus on the marsh surface processes: that is,
ponding of surface water, mineral sedimentation, organic accretion and vegetative growth. There
are two erosion processes that occur in the St. Bernard marshes: interior and edge erosion.
12
the same circular patterns formed by the ponding process. This process is obvious in land loss
maps of the St. Bernard marshes (Couvillion et al., 2011). Marsh edge erosion is a separate topic
that is the result of wave action and tidal scour on marsh shorelines. In a study by Wilson and
Allison (2008), marsh shoreline morphology was analyzed and quantified in response to relative
sea level rise and wave action. Their study proposed a quantitative model for shoreline erosion
and retreat in marsh systems. The resulting conceptual model described not only the impacts of
relative sea level rise on Louisiana marshes, but also the proposed impact on other marshes
during eustatic sea level rise alone. Since the St. Bernard marsh has an historically low rate of
land loss (Couvillion et al., 2011), the dominant marsh erosion process in this area is marsh edge
erosion, as discussed by Wilson and Allison (2008).
Barrier Island Formation
Barrier islands are thin strips of land composed of unconsolidated material that trend
parallel to the mainland shoreline and are separated from the mainland by a lagoon or wetland
complex (Hoyt, 1967). Barrier island genesis is has been the subject of much debate in the
literature (deBeaumont, 1845; Gilbert, 1885; McGee, 1890; Johnson, 1919; Hoyt, 1967; Fischer,
1968; Otvos, 1979). deBeaumont (1845) proposed that offshore erosion at the shoreface and
onshore movement of sediment allowed subaqueous bars to emerge and become subaerially
exposed, eventually organizing into barrier islands. This process occurs frequently on shorelines
as sediment is reworked onshore in the form of bars that become subaerial and adhere to the
mainland shoreline. Gilbert’s (1885) hypothesis posited that wave action and longshore transport
formed spits from existing coastal features such as headlands. Eventually, the spit becomes
detached from the mainland by a breach that stays open as a tidal inlet, thus forming a barrier
13
as glacial drumlins on glaciated coasts (e.g. Boston Harbor). McGee (1890) proposed that barrier
islands were relict mainland beach ridges and dune fields that formed during lower sea level
positions. During sea level rise, these ridges became isolated and the low-lying area behind the
shoreline became a lagoon. Hoyt’s (1967) hypothesis for barrier island formation rekindled the
debate between the three previous hypotheses and agreed with McGee (1890) that sea level
fluctuations are the key driver for development of barrier islands. Fisher (1968) responded to
Hoyt's hypothesis, championing Gilbert's spit-building hypothesis. The debate completed the full
circle when Otvos (1970) cited deBeaumont's model of barrier island formation from submerged
sand shoals.
What is interesting about the shoal hypothesis and the spit hypothesis is that the processes
driving these barrier island genesis mechanisms are known to alter existing barrier island
geomorphology. Longshore transport does produce spits that prograde and can develop into a
significant morphologic feature of a barrier island (Gilbert 1885; Fisher 1968). Wave action does
create sand shoals (deBeaumont, 1845; Otvos, 1970), although the ability of those shoals to
become subaerially exposed is questioned. However, the only hypothesis for island formation
that invokes a larger-scale process, sea level rise, is that provided by McGee (1890) and later,
Hoyt (1967). Once a beach ridge is drowned and converted into an island, longshore transport
along the shoreface will likely produce a spit, as in the hypotheses of Gilbert (1885) and Fisher
(1968). Additionally, offshore sand bars or shoals may move onshore and weld to the shoreface
of a barrier island; a process similar to the processes driving barrier formation proposed by the
hypotheses of deBeaumont (1845) and Otvos (1970). The widely recognized hypothesis of
barrier island formation, following the work of McGee (1890) and Hoyt (1967), is that of Swift
14
irrelevant because modern barrier islands have migrated to such an extent that any underlying
stratigraphy indicating their origins has been removed. Thus, the questions surrounding barrier
island migration and response to sea level rise became the focus of a variety of studies.
Barrier Island Response to Sea Level Rise
There has been extensive debate in the literature regarding barrier island response to sea
level rise. Rampino and Sanders (1981) propose that during rapid sea-level rise, barrier islands
drown in-place, becoming submerged as the surf zone abruptly jumps landward to the former
mainland shoreline. Furthermore, the back barrier lagoon deepens and widens, preventing the
barrier from retreating and forcing an abrupt jump in shoreline to the mainland. This proposed
mode of barrier response to sea level rise contrasts with that of shoreface retreat; an equilibrium
response to sea level rise where the barrier continually migrates landward and the lagoon is
maintained during retreat (Fischer, 1961; Swift, 1975). A third hypothesis, transgressive
submergence, that was developed based on geomorphic and stratigraphic relationships identified
in Mississippi River delta plain barrier island systems, suggests that high rates of relative sea
level rise submerge the island system while simultaneous transgression results in shoreface
retreat (Penland et al., 1988). Unlike the backstepped barrier island in shoreface retreat and the
new mainland shoreline resulting from in-place drowning, the end result of transgressive
submergence is the formation of a subaqueous offshore retrograding sand shoal.
In a discussion by Swift and Moslow (1982), the authors disagree with the in-place
drowning hypothesis posited by Rampino and Sanders (1981) for two specific reasons. The first
is that lagoons are natural sediment traps with depths equal to the shallow wave base based on
fetch for that lagoon. Therefore, the wide, deep lagoons discussed by Rampino and Sanders
15
addressed by Swift and Moslow (1982) is the aforementioned equilibrium response to sea level
rise. Barriers are highly dynamic features that change on small timescales and sea level rise
occurs slowly over hundreds to thousands of years. Therefore, it is unlikely that the barriers
would resist the affects of sea level rise and respond suddenly once a threshold has been crossed.
Instead, it is more likely, according to Swift and Moslow (1982), that barriers respond to sea
level rise on a daily basis.
Shoreface retreat, as hypothesized by Fischer (1961) and Swift (1975) presents a
significant caveat: sediment supply. With an adequate supply, the barrier can migrate landward
as sediment is transferred landward in response to sea level rise. However, as more sand is lost in
the system, the barriers would be unable to migrate. For this reason, shoreface retreat is not fully
applicable to barrier systems along the sediment-starved Mississippi River delta plain.
Furthermore, Swift's (1975) barriers migrate up a coastal plain with some relief, so not only are
they migrating landward, but also gaining elevation as they migrate. The barriers on the
Mississippi River delta plain are essentially migrating across a flat plain, and so the loss of
sediment from the system has a larger effect on the ability of those barrier islands to survive
subaerially.
The transgressive submergence hypothesis that invokes the three-stage evolutionary
model proposed by Penland et al. (1981) was tested by Otvos (1986) using by aerial
photography, historical maps, and shallow stratigraphy. Otvos (1986) suggested that the
variables cited within the three-stage model, such as rates of island evolution and degradation,
and shelf shoal formation are inadequately defined and thus present weaknesses in the model.
Specifically, Otvos hypothesizes that barrier islands form from reworked subaqueous deltaic
16
Barrier Island Formation on the Mississippi River Delta Plain
The Penland et al. (1988) three-stage evolutionary model for Mississippi Delta
transgressive barrier islands (Figure 4) invokes components from each of the three earlier
proposed models of barrier island formation. In Stage 1, after the initial fluvial abandonment of
the headland due to an upstream avulsion, marine processes rework the coarse fraction of the
deltaic sediment into flanking spits (Penland et al., 1988). Eventually these spits are breached to
form flanking barrier islands similar to the mode of barrier formation proposed by Gilbert (1885)
and Fisher (1968) (Penland and Boyd, 1981; Penland et al., 1988). In Stage 2, continued
subsidence and erosion of interior wetlands results in the sandy shoreline becoming detached
from the headland forming a transgressive barrier island arc similar to the drowned beach ridges
in Hoyt’s (1967) model (Penland and Boyd, 1981; Penland et al., 1988). Continued subsidence
and loss of sand to deepwater sinks results in barrier island transgressive submergence and the
development of a Stage 3 submerged inner-shelf shoal (Penland et al., 1988). During the
transition from Stage 2 to Stage 3, the barrier island arc may become submerged during high
energy events, such as seasonal storms. Additionally, before the inner-shelf shoal becomes fully
submerged, it may become subaerially exposed during fairweather conditions due to constructive
wave processes (Otvos, 1970; Fearnley et al., 2009). However, the ability of the inner-shelf shoal
to maintain subaerial exposure is compromised by relative sea level rise and loss of sand
offshore, and thus the conversion to an inner-shelf shoal cannot be reversed in a regime of
continual relative sea level rise, as stated by Otvos (1970). Modern analogs and type areas for the
model proposed by Penland et al. (1988) include: the LaFourche erosional headland with
Timbalier Islands and Grand Isle as flanking barriers (Stage 1); the Chandeleur Islands
17
The Chandeleur Islands are Stage 2 transgressive barrier islands formed by reworking of
the St. Bernard delta complex of the Mississippi River. This lobe was abandoned approximately
1,800 years BP (Frazier, 1967) and has been undergoing transgression since that time. The
Chandeleur Islands are arc-shaped islands, approximately 72 km in length from the southernmost
spit at Breton Island to the northernmost spit at Hewes Point. Historically, the dominant
direction of sediment transport is north due to the islands orientation to the dominant wave
climate in the Gulf of Mexico (Penland et al., 1988), although there is some variation at the
southern end of the islands. More recently, studies (Georgiou and Schindler, 2009) have shown
that longshore transport is bidirectional which moves material laterally towards the flanks of the
Chandeleur Islands. As a result, the northern islands sand lithosome is thicker with wide beaches
and sand bars within the surf zone (Penland et al., 1988) primarily as a function of lateral spit
accretion. The southern islands are much thinner and more fragmented, indicating a lack of
sediment supply and accommodation, and mainly consist of shell beaches. The Chandeleur
Islands are separated from the St. Bernard marsh complex by 25 km of open water, Chandeleur
18
Figure 4 - Formation and evolution of barrier islands on the Mississippi River delta plain. The first stage is initiated by fluvial abandonment, and further stages are driven by the combined forces sea-level rise and subsidence. The transition from Stage 2 to Stage 3 is the primary focus of this research, and the formation of the sandy shoreline shown in Stage 3.
Modified from Penland et al. , 1988.
Shoreline and bathymetric data from multiple time periods (dating to the 1850s) for the
Chandeleur Islands demonstrate that large sectors of island have crossed the transgressive
submergence threshold (Fearnley et al., 2009; Miner et al., 2009), a trend that was greatly
accelerated by the 2004 and 2005 hurricane seasons. Recent studies predict that the Chandeleur
Islands will be completely converted to ephemeral barrier islands/shoals within two decades
(Fearnley et al., 2009). Studies conducted in the 1980s—prior to the increased hurricane intensity
and frequency observed during the past decade—predicted that the transgressive submergence
19
important to understand the processes currently affecting the mainland marsh as well as the
processes and changes that will occur once the seaward fronting Chandeleur Islands become
completely submerged. This study focuses on the response of the marsh in the St Bernard delta
complex as the Chandeleur Islands are progressively submerged.
As the Chandeleur Islands undergo continual thinning, breakup, and conversion to shoals,
the entire system will ultimately evolve into a series of submerged sand shoals through
transgressive submergence (Penland et al., 1988; Fearnley et al., 2009). The Chandeleur Islands
today act as a buffer between the saltwater conditions of the Gulf and the estuarine conditions in
St. Bernard Marsh and Pontchartrain Basin. In the absence of fronting barrier islands, the
marshes could possibly be subjected to higher levels of salinity and greater wave energy,
resulting in accelerated deterioration of the marsh. However, the changing conditions and
processes affecting the marshes may also facilitate onshore movement of sand or reworking of
sand at depth, producing a sandy shoreface along the marsh.
An unusual characteristic of the Chandeleur Islands is their relative stability in
comparison with other barrier island systems in the Mississippi River delta plain, specifically
Isles Derniere. Despite an earlier abandonment by the St. Bernard lobe (~1800 years BP; Frazier
1967), the Chandeleur Islands are in the same stage of barrier evolution as the Isles Derniere
which are reworked remnants of the Lafourche delta complex which was abandoned (~700 years
BP; Frazier 1967). It is likely that a difference in substrate lithology, volume of sand available
for natural island maintenance, or variability in the rate of relative sea level rise between these
two locations can explain the similarity in geomorphic phase yet the large age discrepancy.
The Isles Derniere were originally a single barrier chain associated with the LaFourche
20
distributary sands from Bayou La Loutre, the source of sediment for the Isles Derniere is not
necessarily from the associated distributary, but rather from updrift sources (i.e. Caminada
Headland; Penland et al. 1988). In the 1850s, the Isles Derniere consisted of an attached
headland with flanking barrier islands but through rapid subsidence, land loss, and bay
expansion, the islands have become detached barriers (Penland et al., 1988). In the recent past,
the Isles Derniere have steadily decreased in size and fragmented into multiple islands. Ship
Shoal is a large subaqueous sand body offshore from the Isles Derniere that is generally
migrating landward (Penland et al., 1988). Because Ship Shoal has migrated landward over a
distance equal to or greater than its width, no barrier island facies are preserved in the
stratigraphy of Ship Shoal; however, the presence of beachrock and an estuarine shell
assemblage identified in vibracores provide evidence of barrier island origin (Penland et al.,
1988). Additionally, it has been hypothesized that the Isles Derniere formed along the marsh
periphery in response to the decline of Ship Shoal as a barrier island chain (Penland et al., 1988).
If this holds true, then a similar shoreline is likely to form along the St. Bernard marsh as a
response to the disintegration and submergence of the Chandeleur Islands.
In a study by Stone et al. (2005), Ship Shoal was analyzed as a sediment source for
restoration projects. One of the goals of this study was to model the affects of different scenarios
on the Isles Derniere assuming the entire removal of Ship Shoal. During storm conditions, waves
generally break on Ship Shoal before they reach Isles Derniere. With the removal of Ship Shoal,
the wave heights increased almost 100% (Stone et al., 2005). However, because these waves are
generally larger, the surf zone associated with Isles Derniere was moved seaward and the
resulting wave energy impacting the shorelines was roughly the same with Ship Shoal present.
21
Methods and Data
Historic Datasets and Regional Stratigraphic Relationships
Kolb and van Lopik (1958a, b) produced two reports that relied upon borings and
cross-sections in the Mississippi River delta plain (Figure 5) to document regional stratigraphic
relationships. These borings were most likely collected using a thin-wall, or Shelby, tube sampler
(J. Dunbar, personal communication). A Shelby tube sampler collects undisturbed samples in
12.7 cm (5 in) diameter tubes of 60.9 cm (24 in) to 76.2 cm (30 in) in length (Fang, 1991).
Sediment samples from the Shelby tubes were analyzed according to the Unified soil
classification system (USCS) which was modified to best characterize the local soil
characteristics by the New Orleans District of the U.S. Army Corps of Engineers. Lithological
associations and stratigraphic relationships, based on the sediment samples, were determined and
described by Kolb and van Lopik (1958a, b). These borings and stratigraphic cross-sections were
22
Figure 5 - Locations of borings and cross-sections. Borings and cross-sections from Kolb and van Lopik (1958a) are shown as magenta dots and lines. Borings and cross-sections from Kolb and van Lopik (1958b) are shown as green dots
and lines. Satellite image is a 2005 LANDSAT image accessed through Louisiana State University's Atlas website (atlas.lsu.edu)
Stratigraphic relationships were interpolated using RockWare, Inc., Rockworks 14
(revision 2009.3.23) software which uses locations, depths, and stratigraphic characteristics to
construct two-dimensional and three-dimensional models of subsurface relationships. Although
there are several options for making a three-dimensional model in Rockworks 14, the most
important is the method option, or algorithm because this option determines the extent of
interpolation that occurs for a given model. To produce stratigraphic models using Rockworks,
an inverse distance algorithm was selected for spatial interpolation. This algorithm assigns a
value to a node based on a weighted average of the nodes surrounding it (RockWare, Inc., 2008).
23
points, and is determined by an exponent. Essentially, this algorithm along with the value of the
weighting exponent determines how localized or regional the data will appear. For example,
point bars and channels are highly localized data located primarily near former distributary
networks. Other deposits, such as prodelta deposits, are less localized and fall into a more
regional-scale of deposition. For this specific model, and because there are several stratigraphic
units which are highly localized (and of particular interest due to the sand content in deposits like
point bars), a weighted exponent with the value of 2.0 was selected (the lower the value, the
more localized the units in the model will appear) (RockWare 2008). This value, essentially, is
related to the heterogeneity of the stratigraphy in these borings. Because sand-rich strata, such as
distributary channels, are highly localized, selecting a lower number effectively shows these
deposits in a more realistic way. Numerous attempts were undertaken to assess how different
values affected the generation of stratigraphic models. In the versions using high values, the
result was sheet-like deposits of distributary channels, presenting an unrealistic representation of
the deposits.
Recent Data and Shallow Stratigraphy
Vibracores were collected by the University of New Orleans Coastal Research
Laboratory in 2001, 2003, 2004, and 2009 (Figure 6) within the study area using a custom-built
system consisting of a vibrating cement mixer and aluminum piping. The vibrating cement mixer
allows the core tubing to penetrate by essentially liquefying the surrounding sediment (Lanesky
et al,. 1979; Hoyt and Demarest, 1981). Additionally, the mixer can be adjusted to vibrate at
various frequencies as needed to maintain sediment liquefaction and core penetration. Once the
core has reached refusal, measurements are taken to calculate compaction in the core. In order to
24
putting a stopper in the top of the core. A tripod and pulley system is used for extracting the
vibracore. Once the core returns to the laboratory, it is split lengthwise with a circular saw: one
half is archived and the other half is used for sampling and describing. Core description sheets
(Appendix A - Vibracore Description Sheets) show percent sand, color, organic content, and
other pertinent information to describing the core.
Figure 6 - Locations of vibracores in the St. Bernard Marsh from 2001 to 2009. Satellite image was accessed through LSU's Atlas website (atlas.lsu.edu)
Graphic lithologic core logs and stratigraphic cross-sections were created from these core
description sheets using Adobe Illustrator. Each core was digitized individually and represented
with various colors and swatches according to the description of the core. Once all the cores
were digitized, they were put into cross-sections. Stratigraphic relationships were drawn on the
25
Modern Marsh Surface Data
Two marsh peat cores (SBD2 and SBD3; Figure 6) were collected in selected locations in
the St. Bernard marsh in Summer 2009 using a Russian Peat Borer. Once a target depth was
reached (for example, 1 meter, or 0.5 meter), the device was rotated, trapping the sample inside
the core tube with a cover plate. This system is used in marshes because it minimizes vertical
compaction. Once the core was extracted, it was placed into half-cylinder PVC pipes wrapped in
plastic to avoid contamination, and then the core itself was wrapped in plastic and secured with a
strong adhesive, such as duct-tape. Once the core returned to the lab, it was sampled in 2-cm
sections, samples were placed in small bags. The samples were then dispersed depending on the
processing methods, which included water content, loss-on-ignition, dry bulk density, 210Pb, and 137
Cs.
Water content of each sample was determined by weighing the sample soon after it was
collected, and then comparing this wet weight against a dry weight. The samples were typically
dried in an oven set at 60° C, but some samples were also dried at room temperature. The only
difference between the drying methods is the amount of time before the sample is sufficiently
dry. The Loss-on-Ignition (LOI) method of Delaune et al. (2003) was used to obtain an organic
content for the specific sample. The samples, which had been dried by the method discussed
above, were weighed before being placed into a muffle furnace at 400° C for 16 hours. The
resulting weight was subtracted from the pre-ignition weight. This "lost" weight was then
divided by the starting weight to obtain a percentage of organic material that was ignited and lost
during the LOI process.
One marsh core, SBD2, was processed for 210Pb, 137Cs and organic content by the
26
simultaneously to provide vertical accretion rates across a range of timescales (10-100 year;
DeLaune et al., 1989). 137Cs is an unnatural atmospheric gas isotope that exists as a result of
nuclear weapons testing during the late 1950's and early 1960's (DeLaune et al., 1989). As a
result, high concentrations of this isotope were present during peak times of nuclear weapons
testing: specifically, the early 1950s, and again in 1963-1964 (DeLaune et al., 1989). 137Cs
decays with a half life of approximately 30 years to 137Ba. DeLaune et al. (1989) admit that there
may be migration of these isotopes within the sediment, but that peak concentrations "do not
shift (vertically) substantially". 210Pb is a naturally occurring atmospheric gas isotope that is
trapped by rainfall with a mean atmospheric residence time of 9.6 days (DeLaune et al., 1989)
The concentration of 210Pb in rainwater is therefore believed to be constant (DeLaune et al.,
1989; Benninger 1976). Additionally, 210Pb in sediment decays to 226Ra. The excess 210Pb from
rainwater in relation to the total 210Pb activity is used for 210Pb dating (DeLaune et al., 1989).
These qualities of the two radioisotopes provide unique dating tools that can be applied to
estimate vertical accretion rates in wetland soils. However, without an established vertical
chronology from 137Cs, the accretion data from 210Pb is useless and for that reason, 210Pb and 137
Cs are used together.
Unfortunately, the accretion data from SBD2 have multiple difficulties including large
calculated errors for accretion rates, as well as significant outliers at specific intervals. Due to
these difficulties, the data are not discussed further.
Coastwide Reference Monitoring System
The Louisiana Coastwide Reference Monitoring System (CRMS) is a program funded by
the Coastal Wetlands Planning, Protection and Restoration Act (CWPPRA) and consists of 390
27
2006; USGS, 2010). Each station monitors wetland health, with data on vegetation, hydrologic
index, salinity, and accretion rates. Nine locations (Figure 7), established in the Spring of 2008,
were selected in the Pontchartrain Basin for this study. Data and methods for accretion rates are
readily available online at www.lacoast.gov/crms. The accretion data collected from these sites
results from measurements of accreted sediment thickness above a feldspar layer. The feldspar
powder provides a reference marker horizon because it was sprinkled onto the marsh when the
station was established (Cahoon et al., 1995; lacoast.gov/crms). The feldspar forms a vibrant
white layer against which to measure vertical accretion. Once established, the site is later
revisited and cores are taken from the marsh where the feldspar marker was laid down (Cahoon
et al., 1995; lacoast.gov/crms). If accretion has taken place, the feldspar marker will be buried
and the thickness of material represents the total magnitude of accretion. Liquid nitrogen is
poured down this core before extraction to preserve the core until it can be properly analyzed.
However, in some cases, the feldspar has been removed from the system perhaps by flooding of
the marsh or herbivory and thus no accurate accretion data can be collected (lacoast.gov/crms).
The data collected at CRMS sites included vegetation type, hydrologic index, vertical
accretion, and soil elevation change measured with a Rod Surface Elevation Table (RSET;
lacoast.gov/crms). These measurements are typically collected over a short period of time (i.e.
months to years) and are indicative of short term changes within the marsh.
28
Figure 7 - Locations of CRMS sites in the St. Bernard marsh from coordinates obtained online at www.lacoast.gov/crms. CRMS data includes locations, accretion rates, vegetation types, as well as hydrologic data for a given site.
Bathymetric Data of Chandeleur Sound
Bathymetric data (Figure 8) are from the ADCIRC grid SL15v06r09 which was used in
previous studies (Bunya et al., 2010; Dietrich et al., 2010; Schindler, 2010). These data were
compiled using bathymetric data from a variety of sources such as The National Oceanographic
and Atmospheric Association (NOAA), the National Ocean Service (NOS) and the U.S.
Geological Survey (USGS). Most of these data are historic hydrographic charts from NOAA
29
Figure 8 - Bathymetry of the north-central Gulf of Mexico (Schindler, 2010). Transects (pink) were extracted from this data to produce profiles of the marsh and Chandeleur island shoreline. Grid coordinates are in meters,
30 Results
Regional Stratigraphy
Kolb and van Lopik (1958a) identified a suite of Holocene deltaic, coastal, and marine
environments in their analysis of the Mississippi River-Gulf Outlet: prodelta clays, intradelta
complex, interdistributary trough, abandoned course, abandoned distributary, point bar, natural
levees, swamp, marsh, lacustrine, sand beach, bay-sound, and nearshore gulf. Of these
environments, the most commonly encountered within the upper 80m of this study area are
prodelta clays, intradelta complex, interdistributary trough, abandoned course, abandoned
distributary, point bar, natural levee, marsh, sand beach, bay-sound, and nearshore gulf (Table 1).
In order to define the facies associations and distribution, a series of stratigraphic
cross-sections were constructed in Adobe Illustrator using data from Kolb and van Lopik (1958a, b).
The following sections discuss two cross-sections (Figure 9) and the overall stratigraphic
framework of the delta complex. All other cross-sections can be found in Appendix B -
Cross-sections.
31
Table 1 - Table of the stratigraphic facies as identified and described by Kolb and van Lopik (1958a). The italicized facies are sand-rich. All text is from Kolb and van Lopik (1958a), but percentages are from Kolb and van Lopik (1966).
Depositional Types Lithology Remarks
Prodelta Clays 95% Clay, 5% Silt
Underlies the entire deltaic sequence as
homogeneous unit. Slopes and thickens toward the southeast
Intradelta Complex
35% Clay, 40% Silt, 25% Sand
Relatively coarse portion of subaqueous delta. Intricately interfingered deposits. Disposed in broad wedges about abandoned courses and major distributaries.
Interdistributary Trough
80% Clay, 10% Silt, 7% Sand, 3% Organic Material
Disposed in clay wedges between major distributaries. Clay sequence interrupted by silty or sandy materials associated with myriad small distributaries, but otherwise fairly
homogeneous. Material will probably displace laterally under fairly light load.
Abandoned Course
20% Clay, 35% Silt, 45% Sand
Forming ribbon of fairly coarse sediment in abandoned Mississippi River course. Averages 2500 ft in width and 80 to 90 ft deep. Grain size increases with depth and upstream direction
Abandoned Distributary
45% Clay, 20% Silt, 35% Sand
Forming ribbons of fairly coarse sediment from a few feet to more than 1500 ft in width, 30 to 60 ft deep. Grain size increases with depth.
Point Bar
25% Clay, 20% Silt, 55% Sand
Flanking major courses. Thickness 80 ft or more. Materials become coarser with depth
Natural Levee
55% Clay, 40% Silt, 5% Sand
Disposed in irregular belts along abandoned courses and distributaries. Thickness averages 15 ft or less.
Marsh
32% Clay, 3% Silt, 65% Organic Material
Forms 90% of land surface within study area. Average thickness 10 ft. Very high water content. Subject to rapid compaction under load.
Sand Beach
5% Silt, 90% Sand, 5% Shell
Surficial beaches of minor areal extent. Buried beaches also insignificant portion of
subsurface
Bay-Sound
55% Clay, 3% Silt, 37% Sand, 5% Shell
Averages 10-15 ft deep throughout Chandeleur Sound. Interfingered,
characteristically silts and silty sand deposits
Nearshore Gulf
12% Clay, 14% Silt, 55% Sand, 19% Shell
32
MRGO A-A'
This cross-section (Figure 10) shows a general north-west to south-east trend from
interdistributary-dominated marsh environments to more fluvial-dominated intradelta complexes
and abandoned distributaries. The end of this cross section follows, essentially, the end of Bayou
La Loutre, which is a former Mississippi River channel (Kolb and van Lopik 1958a, b). The
prevalence of coarse-grained deposits correlate with fluvial-dominated deposits, and thus
beneath the approximate modern shoreline of St. Bernard marsh is the highest concentration of
sand-rich strata. However, much of these strata, in particular the intradelta complex, exist below
3m (Kolb and van Lopik, 1958a,b).
MRGO Q-Q'
The cross-section Q-Q' (Figure 11) is an idealized cross-section that is similar A-A'
except that borings have been extrapolated to make a straight cross-section across the delta
complex. Noticeable first is the Pleistocene deposit beneath St. Bernard marsh that gradually
thins to the southeast. The base of the Pleistocene surface is not defined by Kolb and van Lopik
(1958a), but rather these "thicknesses" indicated the maximum depth of penetration. The prodelta
wedge is stratigraphically above the Pleistocene surface and thickens to the southeast. As noticed
in previously discussed cross-sections, the distribution of intradelta complexes is limited and
bounded along the southeast by the mouth of Bayou La Loutre. The presence of intradelta
complexes is also correlated with the presence of modern marsh deposits. Overall, this
cross-section provides a basic understanding of St. Bernard Delta complex regional stratigraphy
because it highlights the smaller scale stratal relationships observed in other cross-sections, such
33
34
Figure 11 - Idealized cross-section of the St. Bernard delta complex showing the distribution and location of deltaic deposits. Modified from Kolb and van Lopik (1958a).
Interpretation
The overall stratigraphy of the St. Bernard Delta complex, from the previously described
cross-sections, is dominated by interdistributary deposits. The coarse-grained deposits, such as
intradelta complexes, natural levees, and abandoned distributary channels are limited. Natural
levees and their corresponding abandoned distributary channels are highly localized and spatially
variable features. These features have been exposed during ravinement and were likely
responsible for the initial sandy supply to the Chandeleur Island system (Penland et al 1988). The
volume of sediment in intradelta complex deposits is much greater than in natural levees, less
35
However, it appears that the majority of intradelta complex deposits are confined
between the southwestern most extent of Bayou La Loutre and the intersection between the Gulf
Intracoastal Waterway and the Mississippi River-Gulf Outlet.
Stratigraphic Models
Two fence diagrams (Figure 12 and Figure 13) and a three dimensional model (Figure
14) were created using Rockworks 14 (revision 2009.3.23, RockWare Inc., 2008) from the data
provided by Kolb and van Lopik (1958a, b). Fence diagram 1 (Figure 12) was created by
mapping cross-sections in similar locations to cross-section locations in Kolb and van Lopik
(1958). Also, the longest cross-section from Kolb and Lopik was included because it follows the
depositional strike of the St. Bernard delta complex. The shorter perpendicular cross-sections
follow the dip. This fence diagram shows very similar stratigraphy to the cross-section it was
derived from. However, there is significant error in the distribution of the sediments. In the
model it appears that abandoned distributary and point bar deposits are located throughout the
delta and are not particularly associated with any known distributary networks. The model
extrapolated the presence of these deposits that are known to be isolated to the immediate
vicinities of abandoned distributary channels. What can be gleaned from this model is the
36
Figure 12 - Fence diagram of the St. Bernard delta complex showing the location and relationship between stratigraphic units based on the cross-sections provided by Kolb and van Lopik (1958a, b). This model contains spatial inaccuracies (i.e.
the location of point bar deposits), but does provide a useful conceptual model for the St. Bernard delta. Vertical Exaggeration is 1000.
Fence diagram 2 (Figure 13) was created using the cross-sections from the seaward end
of fence diagram 1 and is essentially a sub-section of Fence diagram 1. The purpose of this was
to obtain better resolution on delta stratigraphy and ignore the stratigraphy updip of the delta
complex. Because the area of interest is the stratigraphy directly below the modern shoreline, the
stratigraphy updip (i.e. closer to New Orleans) is not relevant in this study. As in the first
diagram, this diagram shows an inaccuracy in the distribution of point bar and abandoned
distributary deposits, but displays the complex nature of the relationship between intradelta
complex and interdistributary deposits. What is more prominent in this diagram is that the
37
(i.e. they thin towards the distal edge of the delta complex). This is also observed in the
cross-section, but is clearer in this diagram.
Figure 13 - Fence diagram of the lower St. Bernard delta complex showing a more detailed view of the lower-delta complex. Vertical Exaggeration is 600.
The three-dimensional model (Figure 14) is a solid block representation of the fence
diagrams. Interestingly, the marsh surface in this diagram looks fairly accurate (i.e. a
semi-continuous mainland with some islands). However, the abandoned distributary and point bar
deposits are not realistically displayed (as noted in the fence diagrams). What is different in this
model from the fence diagrams is that the relative thicknesses of deposits can be estimated. For
example, the prodelta deposits are quite thick in comparison to interdistributary and intradelta
complex deposits. Once again, the thickest deposits of intradelta complex and interdistributary
38
Figure 14 - Three dimensional block diagram of the St. Bernard delta complex based on cores and cross-sections provided by Kolb and van Lopik. Vertical Exaggeration is 1500.
Shallow Stratigraphy
The sections below describe cross-sections created in Adobe Illustrator from vibracores
taken by the University of New Orleans Coastal Research Laboratory in 2003 and 2004. All
other vibracore description sheets can be found in Appendix A - Vibracore Description Sheets
and other cross-sections can be found in Appendix B - Cross-sections. Additionally, some of
these vibracores and cross-sections can be found in Calvin (2002).
C-C'
04BL-08, 04L-09, 03BL-10, 04BL-03, and 03BL-3 are cores that make up the