in the population sciences published by the Max Planck Institute for Demographic Research Konrad-Zuse Str. 1, D-18057 Rostock · GERMANY www.demographic-research.org
DEMOGRAPHIC RESEARCH
VOLUME 12, ARTICLE 11, PAGES 273-300
PUBLISHED 13 MAY 2005
www.demographic-research.org/Volumes/Vol12/11
DOI: 10.4054/DemRes.2005.12.11
Research Article
Decline in human cancer
incidence rates at old ages:
Age-period-cohort considerations
Konstantin G. Arbeev
Svetlana V. Ukraintseva
Lyubov S. Arbeeva
Anatoli I. Yashin
1 Introduction 274
2 Data 279
3 Age-period-cohort models applied to human cancer incidence rates 279
4 Discussion 293
5 Acknowledgements 296
Decline in human cancer incidence rates at old ages:
Age-period-cohort considerations
Konstantin G. Arbeev 1 Svetlana V. Ukraintseva 2
Lyubov S. Arbeeva 3 Anatoli I. Yashin 4
Abstract
Analysis of age-specific trajectories of cancer incidence rates for all sites combined (data source: International Agency for Research on Cancer) reveals a leveling-off and decline of the rates at old ages in different countries and time periods. We apply a non-linear age-period-cohort model (James and Segal 1982) to obtain declining cancer incidence rates at old ages. The age effects are represented by a power function of age in accordance with a multistage model of carcinogenesis (Armitage and Doll 1954). Applications to cancer incidence in England and Wales, Japan (Miyagi prefecture) and the USA (New York State and San Francisco) illustrate the approach. Further topics of research are discussed.
1 Duke University, Center for Demographic Studies, Durham, USA. Ulyanovsk State University, Ulyanovsk, Russia.
E-mail: [email protected]
2 Duke University, Center for Demographic Studies, Durham, USA. E-mail: [email protected] 3 Ulyanovsk State University, Ulyanovsk, Russia
4 Duke University, Center for Demographic Studies, Durham, USA. Max Planck Institute for Demographic Research, Rostock, Germany.
1. Introduction
In many countries and time periods, the age-specific trajectories of the cancer incidence rate for all sites combined reveal a deceleration or decline at old ages (Fig. 1, 2; source: International Agency for Research on Cancer (IARC), IARC 1965-1997). Most researchers who studied relationships between age and cancer risks focused mainly on an increase in cancer risks with age (see e.g., Peto et al. 1975, Rainsford et al. 1985, Volpe and Dix 1986, Dix 1989, Krtolica and Campisi 2002). They ignored other typical features of cancer rate patterns, such as deceleration and decline at old ages. A reason might be that they have used data on age-specific cancer mortality rather than incidence data. Typical data on cancer mortality are limited to age 75, thus not allowing observations to be made on the decline in cancer mortality rates observed at oldest old ages (see e.g., EUCAN and GLOBOCAN databases). IARC (1965)-(1997) data on cancer incidence rates, by contrast, are available in 5-year age groups up to age 85 and above, therefore enabling us to observe the rates’ behaviors at oldest old ages.
Figure 1: Female cancer incidence rates for all sites combined (A) – England and Wales
(C) – USA (New York State)
(D) – USA (San Francisco, whites)
Figure 2: Male cancer incidence rates for all sites combined (A) – England and Wales
(C) – USA (New York State)
(D) – USA (San Francisco, whites)
They performed a combined analysis in four groups: all cancers combined, a group of cancers related to smoking, cancers whose detection rates have been rising due in large part because of recent increases in screening, and all cancers except those in the smoking and screening categories. The incidence rate for all sites combined is a mixture of site-specific rates. However, incidence patterns for all cancers considered together permit a general crude assessment of trends in the cancer-induced demand for health care (Dinse et al. 1999). APC modeling can be a useful tool to gain a deeper understanding of these trends as well as predict future disease-related burdens for health care systems.
This paper is organized as follows. Section 2 describes the human cancer incidence data used in our APC analyses. Section 3 presents the respective APC models and describes the results of applications to the cancer incidence data. The last section discusses the results and some possible further investigations.
2. Data
We apply APC models to data on human cancer incidence rates in different countries and time periods. The data are provided by the International Agency for Research on Cancer (IARC) in seven volumes (IARC 1965 - 1997). Each volume covers a time period of several years (usually three to five) for each country (or province and/or ethnic group) under study. The periods vary for different countries. The volumes each provide the female and male average annual cancer incidence per 100,000 over the corresponding time period for the specific country (province and/or ethnic group) in 5-year age groups up to 85 and above (for some countries, the first group, 0-4, is separated into two groups: 0 and 1-4). The data are provided for separate sites and for all sites combined. Not all countries are presented in each volume. Only the countries presented in several volumes thus are suitable for our analyses. Among these, we selected England and Wales, Japan (Miyagi prefecture), and the USA (New York State and San Francisco), representing three continents and different ethnic groups.
3. Age-period-cohort models applied to human cancer incidence
rates
there are not only linear effects, but also non-linear interactions. For instance, Moolgavkar et al. (1979) proposed and James and Segal (1982) extensively analyzed the following non-linear age-period-cohort model:
,
ln
µ
ijk=
α
i+
β
jδ
i+
γ
k(1)
where
µ
ijk denotes the rate in year i, i = 1,…, I, at age j = 1,…, J in the cohort k = i – j+ J,
α
i represents additive period effects,γ
k is used for additive cohort effects,β
jcaptures age effects, and
δ
i can be interpreted as period effects acting multiplicativelyon age effects. The latter effects will be called multiplicative period effects throughout the paper to distinguish them from additive period effects
α
i. These kinds of models donot suffer from non-identifiability, given nonlinear age effects and non-equal
δ
i’s(James and Segal 1982).
Many epidemiological studies on human cancers revealed an increasing age-specific incidence rate. Often, the rate increased as a power function of age. The first stochastic models for carcinogenesis were developed in the 1950s to explain these observations. A multistage theory of carcinogenesis was used as a biological basis. The biological aspects of this multistage theory can be found everywhere (see e.g., Peto 1977). Nordling (1953) introduced the hypothesis that several mutations in a cell are required to transform a normal cell into a malignant one. Armitage and Doll (1954) presented a mathematical model based on Nordling’s hypothesis. The Armitage-Doll (AD) model postulates that several successive irreversible transformations of a normal stem cell lead to a malignant cell. It also assumes that the intensities of transitions between the stages (transformations) are age-independent. In most cases, the intensities are small, so that the approximated expression for the incidence rate originally suggested by Armitage and Doll (1954) can be used. It has a Weibull functional form
( )
. )! 1 ( 1 11 − −
= =
−
=
∏
m mm
l l s
AD x ax
m N x
λ
µ
(2)
The AD model in the original form has been extensively used since the 1950s. Most applications are concerned with cancer of specific sites. Obviously, the AD model captures the increase of the rates with age as it was originally developed to explain such observations. However, some specific sites show incidence patterns that contradict the AD model. Moreover, it also fails to explain the decline in the overall cancer incidence rate at oldest old ages. The decline nevertheless can be obtained if the AD model is viewed within the APC context. For instance, we can fix
β
j=
ln
x
j (wherej
x
denotes the respective ages) in the James and Segal model (1) to obtain Armitage-Doll’s (1954) rates with year- and cohort-dependent parameters:( )
exp
(
)
i,
j k i j
ik
x
x
δ
γ
α
µ
=
+
(3)
where parameter
a
ik=
exp
(
α
i+
γ
k)
is proportional to the product of the number of susceptible stem cells and intensities of transitions between the stages (hits) necessary to transform a normal stem cell into a malignant cell, andb
i=
δ
i+
1
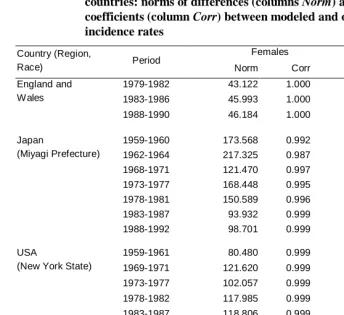
is interpreted as the number of these hits.Table 1: APC analysis of female and male cancer incidence in different countries: norms of differences (columns Norm) and correlation coefficients (column Corr) between modeled and observed incidence rates
Females Males
Country (Region,
Race) Period Norm Corr Norm Corr
1979-1982 43.122 1.000 77.435 1.000
1983-1986 45.993 1.000 67.874 1.000
England and Wales
1988-1990 46.184 1.000 71.402 1.000
1959-1960 173.568 0.992 178.290 0.998
1962-1964 217.325 0.987 218.058 0.996
1968-1971 121.470 0.997 167.227 0.999
1973-1977 168.448 0.995 208.941 0.998
1978-1981 150.589 0.996 178.700 0.999
1983-1987 93.932 0.999 97.724 1.000
Japan
(Miyagi Prefecture)
1988-1992 98.701 0.999 65.226 1.000
1959-1961 80.480 0.999 191.681 0.999
1969-1971 121.620 0.999 236.459 0.998
1973-1977 102.057 0.999 199.704 1.000
1978-1982 117.985 0.999 252.117 0.999
USA
(New York State)
1983-1987 118.806 0.999 235.006 0.999
1969-1973 55.093 1.000 152.083 1.000
1973-1977 120.007 0.999 189.989 0.999
1978-1982 99.367 1.000 187.081 1.000
1983-1987 135.689 0.999 289.161 0.999
USA
(San Francisco, White)
1988-1992 147.776 0.999 234.413 0.999
Figure 3: APC model (James and Segal 1982) with Armitage-Doll’s (1954) age effects applied to data on female cancer incidence rates in different countries
(A) – England and Wales
(C) – USA (New York State);
(D) – USA (San Francisco, whites)
Figure 4: APC model (James and Segal 1982) with Armitage-Doll’s (1954) age effects applied to data on male cancer incidence rates in different countries
(A) – England and Wales
(C) – USA (New York State)
(D) – USA (San Francisco, whites)
We see from Fig. 5-8 that estimates of parameters follow the same patterns for males and females in all data sets except for England and Wales: they exhibit nearly linear increases of additive period effects, a convex shape of cohort effects and an almost linear decline of
δ
i. There are also stable male/female differences in the parameters for all data sets except for England and Wales. First, it is the faster increase of additive period effects for males resulting in the intersection of male and female curves around the 1980s. Second, multiplicative period effects (δ
i) decline faster in males. Third, female cohort effects almost exactly reproduce male cohort effect patterns but shifted upwards. All of these differences are related to the observed male/female differences in cancer incidence rate patterns.Figure 5: APC model (James and Segal 1982) with Armitage-Doll’s (1954) age effects applied to data on female and male cancer incidence rates in England and Wales
(B) – multiplicative period effects
(
δ
i)
(C) – cohort effects
(
γ
k)
Figure 6: APC model (James and Segal 1982) with Armitage-Doll’s (1954) age effects applied to data on female and male cancer incidence rates in Japan (Miyagi prefecture)
A – additive period effects (
α
i)(C) – cohort effects (
γ
k)Data source: IARC (1965) – IARC (1997).
Figure 7: APC model (James and Segal 1982) with Armitage-Doll’s (1954) age effects applied to data on female and male cancer incidence rates in the USA (New York State)
(B) – multiplicative period effects (
δ
i)(C) – cohort effects (
γ
k)Figure 8: APC model (James and Segal 1982) with Armitage-Doll’s (1954) age effects applied to data on female and male cancer incidence rates in the USA (San Francisco, whites)
(A) – additive period effects (
α
i)(C) – cohort effects (
γ
k)Data source: IARC (1965) – IARC (1997)
4. Discussion
This paper addressed the issue of declining cancer incidence rates at old ages in an age-period-cohort context. We considered the age-trajectory of the cancer incidence rate within the Armitage-Doll framework with period- and cohort-dependent parameters. Changes associated with period and cohort effects impose changes on age-trajectories of period incidence rates. Hence, the model can produce both leveling-off and declining rates, whereas the original AD model can not.
malformations and, therefore, the respective cohorts have increased incidence rates. Similarly, a decrease in the proportion of smoking women can produce a decrease in the risk of smoking-related susceptibility to diseases in young generations compared to the older cohorts. Despite the clear distinction between these two effects (period and cohort) sometimes it is difficult to attribute some event to any of them exclusively. For instance, some event or process (e.g., changing dietary habits) can affect all age groups but have more pronounced effect on some specific age group. Therefore, the same event can produce both period and cohort effects.
A specific nature of period and cohort effects may differ for different cancer sites. Trends in site-specific incidence rates are usually explained by a combined influence of such factors as improved diagnostics, an increased exposure to external carcinogens, a changing life style (dietary habits, behavioral changes), etc. Overall cancer rates consist of all site-specific rates. Therefore, the same factors manifest themselves in forming the shape of the overall cancer incidence rates and the overall rates are the result of a combined influence of these factors on the site-specific incidence rates.
Concerning our model (3), the period and cohort effects modifying incidence rates over time and age are related to the internal processes in an organism that lead to cancer development. That is, the events that are attributed to the period or cohort effects modify the intensities of transitions between the stages (hits) necessary to transform a normal stem cell into a malignant cell either for all age groups uniformly (period effects) or only for persons born in the same period of time (cohort effects). The changing multiplicative effects may also reflect changing decomposition of site-specific cancers in the overall cancer over time (resulting in the variability in the average number of hits necessary to develop a malignant cell). Thus, the increasing patterns of male and female period effects (except for England and Wales that can be possibly related to identifiability issues, see below) imply that the influence of the factors that affect all ages at some time point (e.g., exposure to external carcinogens) increases over time. All cohort effects (except for the special case of England and Wales) have a “bell-like” shape with a peak around the 1900-1920s. This may reflect, on the one hand, a relatively poor health status of cohorts born around the World War I and, on the other hand, the continuing decrease in susceptibility to cancer in new generations afterwards. This decline in the cohort effects turns to stagnation during the late 1940s and the early 1950s in the cohorts born after the World War II (Fig. 7-8) and it continues in the following generations.
application, small values of multiplicative period effects in the last periods in all data sets except for England and Wales seem implausible. Moreover, if the original (linear) APC model fits data adequately, the non-linear model (1) is likely to degenerate to a linear model. This means that the identifiability issue appears again (Clayton and Schifflers 1987, Tango and Kurashina 1987, Holford 1992). Some other factors should also be taken into account. Cohort effects associated with old ages in the earliest periods and young ages in the latest periods are based on few observations. Therefore they can be unstable. The term “cohort” is ambiguous when the model is applied to age and/or period groups because of overlapping cohorts for different age groups (Holford 1991). In addition, we estimate cohort effects using only a limited range of ages for each cohort. Nevertheless, the cohort effects are not restricted to these age groups and the analysis of the data on the entire cohort would change the results.
Several approaches have been suggested to solve the problem of non-identifiability in APC models (see the recent reviews by Robertson and Boyle 1998, and Robertson et al. 1999). The methods based on various constraints (e.g., penalty functions) (Osmond and Gardner 1982, Decarli and La Vecchia 1987) lack a sound biological basis for the constraints (they are used to provide identifiability and there is no particular reason to prefer any arbitrary constraint). The availability of statistical software that incorporates APC models with linear constraints (GLIM, Francis et al. 1993) has lead to considerable popularity of this approach to resolve non-identifiability in APC models despite the absence of prior knowledge justifying any specific form of constraints. Another method proved to be “…recommended for use in all circumstances” (Robertson et al. 1999) is based on estimable functions such as curvatures (Holford 1983, Clayton and Schifflers 1987, Tango and Kurashina 1987, Tarone and Chu 1996). Deviations from linearity can be estimated, whereas this does not apply to linear trends (Holford 1983). This method can provide valuable insights into age-period-cohort determinants underlying changes in incidence or mortality over age and time despite lacking information on linear period or cohort trends. For instance, patterns of cohort deviations that “open upward” typically could be viewed as unfavorable as they indicate a qualitative acceleration of incidence rates regardless whether the rates increase or decline on average (Dinse et al. 1999).
1977). This provides a solid background for using power functions to specify age effects in APC models. Holford (1992) discussed this approach in application to cancer incidence data. Holford et al. (1994) considered several non-linear APC models for cancers. They are based on the multistage model of carcinogenesis (Moolgavkar 1978). Here, the underlying biology of carcinogenesis dictates the functional forms of age effects that are consistent with the multistage theory. Lee and Lin (1995) also developed APC models for cancers, using the biologically plausible model of carcinogenesis in human populations.
Various epidemiological and molecular-biological studies provide compelling evidence on the importance of cell proliferation and differentiation in the process of carcinogenesis (Moolgavkar et al. 1999). The two-stage model of carcinogenesis developed by Moolgavkar and colleagues (Moolgavkar and Venzon 1979, Moolgavkar and Knudson 1981, Moolgavkar et al. 1988, Moolgavkar and Luebeck 1990) incorporates cell proliferation and differentiation. Hanayama (2001) presented a model for projecting cancer death rates, viewing the two-stage model on the Lexis diagram. The model deduces the whole range of effects on the Lexis diagram (age, period, and cohort) from the cancer development process. The two-stage model of carcinogenesis can also be applied to cancer incidence data in the period-cohort context. The age-period-cohort effects reflect the combined influence of various factors (e.g., social, behavioral, environmental, medical) on the dynamics of age-specific cancer incidence rates over time. All of these factors are interconnected with changes in internal (molecular-biological) factors responsible for cancer development. If a convincing rationale exists that represents a disease etiology in a specific mathematical model, then this possibility is not to be ignored in data analysis. Age-period-cohort analysis of cancer incidence data in relation to the two-stage model can help reveal the factors that are associated with the time period or birth cohort influence on the respective parameters of carcinogenesis in human populations. However, lack of available data on age- and time-specific trends in the intensities of cell transformations responsible for carcinogenesis (let alone the parameter estimation issues mentioned above in relation to non-linear models) can complicate the analysis. New extensive epidemiological and molecular-biological studies can be very useful for these purposes.
5. Acknowledgements
References
Arbeev K.G., Ukraintseva S.V., Arbeeva L.S., Yashin A.I. (2005). “Mathematical Models for Human Cancer Incidence Rates”, Demographic Research, 12, 10, 237-260.
Armitage P., Doll R. (1954). “The age distribution of cancer and a multistage theory of carcinogenesis”. Br. J. Cancer, 8: 1-12.
Chirpaz E., Colonna M., Menegoz F., Grosclaude P., Schaffer P., Arveux P., Lesec'h J.M., Exbrayat C., Schaerer, R. (2002). “Incidence and Mortality Trends for Prostate Cancer in 5 French Areas From 1982 to 1996”. International Journal of
Cancer, 97: 372-376.
Clayton D., Schifflers E. (1987). “Models for Temporal Variation in Cancer Rates. 2. Age Period Cohort Models”. Statistics in Medicine, 6: 469-481.
Colonna M., Grosclaude P., Remontet L., Schvartz C., Mace-Lesech J., Velten M., Guizard A.V., Tretarre B., Buemi A., Arveux P., Esteve J. (2002). “Incidence of Thyroid Cancer in Adults Recorded by French Cancer Registries (1978-1997)”.
European Journal of Cancer, 38: 1762-1768.
Decarli A., La Vecchia C. (1987). “Age, period and cohort models: A review of knowledge and implementation in GLIM”. Riv Stat Applic, 20: 397-410.
Dinse G.E., Umbach D.M., Sasco A.J., Hoel D.G., Davis D.L. (1999). “Unexplained Increases in Cancer Incidence in the United States From 1975 to 1994: Possible Sentinel Health Indicators?” Annual Review of Public Health, 20: 173-209.
Dix D. (1989). “The role of aging in cancer incidence: an epidemiological study”. J.
Gerontol., 44, 6: 10-18.
Francis F.F., Green M., Payne R.D. (Eds.) (1993). GLIM 4 The Statistical System for
Generalized Linear Interactive Modelling. Oxford: Clarendon Press.
Hanayama N. (2001). “A simple two-stage model for cancer risk in the environment”.
Environmetrics, 12: 757-773.
Ho P.S., Ko Y.C., Yang Y.H.C., Shieh T.Y., Tsai, C.C. (2002). “The Incidence of Oropharyngeal Cancer in Taiwan: An Endemic Betel Quid Chewing Area”.
Journal of Oral Pathology & Medicine, 31: 213-219.
Holford T.R. (1991). “Understanding the Effects of Age, Period, and Cohort on Incidence and Mortality-Rates”. Annual Review of Public Health, 12: 425-457.
Holford T.R. (1992). “Analysing Temporal Effects of Age, Period and Cohort”.
Statistical Methods in Medical Research, 1: 317-337.
Holford T.R., Zhang Z.X., McKay L.A. (1994). “Estimating age, period and cohort effects using the multistage model for cancer”. Statistics in Medicine, 13: 23-41.
IARC (1965). Cancer Incidence in Five Continents. Volume I. Lyon: International Agency for Research on Cancer.
IARC (1970). Cancer Incidence in Five Continents. Volume II. Lyon: International Agency for Research on Cancer.
IARC (1976). Cancer Incidence in Five Continents. Volume III. Lyon: IARC Sci Publ, 15.
IARC (1982). Cancer Incidence in Five Continents. Volume IV. Lyon: IARC Sci Publ, 42.
IARC (1987). Cancer Incidence in Five Continents. Volume V. Lyon: IARC Sci Publ, 88.
IARC (1992). Cancer Incidence in Five Continents. Volume VI. Lyon: IARC Sci Publ, 120.
IARC (1997). Cancer Incidence in Five Continents. Volume VII. Lyon: IARC Sci Publ, 143.
James I.R., Segal M.R. (1982). “On a Method of Mortality Analysis Incorporating Age-Year Interaction, with Application to Prostate Cancer Mortality”. Biometrics, 38, 2: 433-443.
Krtolica A., Campisi J. (2002). “Cancer and aging: a model for the cancer promoting effects of the aging stroma”. Int. J. Biochem. Cell. Biol., 34, 11: 1401.
Lambert R., Guilloux A., Oshima A., Pompe-Kirn V., Bray F., Parkin M., Ajiki W., Tsukuma H. (2002). “Incidence and Mortality from Stomach Cancer in Japan, Slovenia and the USA”. International Journal of Cancer, 97: 811-818.
Liu S.L., Semenciw R., Mao Y. (2003). “Increasing Incidence of Non-Hodgkin's Lymphoma in Canada, 1970- 1996: Age-Period-Cohort Analysis”.
Hematological Oncology, 21: 57-66.
McGlynn K.A., Devesa S.S., Sigurdson A.J., Brown L.M., Tsao L., Tarone R.E. (2003). “Trends in the Incidence of Testicular Germ Cell Tumors in the United States”.
Cancer, 97: 63-70.
Moolgavkar S.H. (1978). “Multistage theory of carcinogenesis and age distribution of cancer in man”. Journal of the National Cancer Institute, 61: 49-52.
Moolgavkar S.H., Stevens R.G., Lee J.A.H. (1979). “Effect of age on incidence of breast-cancer in females”. Journal of the National Cancer Institute, 62: 493-501.
Moolgavkar S.H., Venzon D.J. (1979). “Two-event models for carcinogenesis: incidence curves for childhood and adult tumors”. Math. Biosci., 47: 55-77.
Moolgavkar S.H., Knudson A.G. (1981). “Mutation and cancer: a model for human carcinogenesis”. J. Natl. Cancer Inst., 66: 1037-1052.
Moolgavkar S.H., Dewanji A., Venzon D.J. (1988). “A stochastic two-stage model for cancer risk assessment. I. The hazard function and the probability of tumor”.
Risk Anal., 8: 383-392.
Moolgavkar S.H., Luebeck E.G. (1990). “Two-event model for carcinogenesis: biological, mathematical and statistical considerations”. Risk Anal., 10: 323-341.
Moolgavkar S.H., Krewski D., Zeise L., Cardis E., Møller H. (1999). Quantitative
Estimation and Prediction of Human Cancer Risks. Lyon: IARC Sci Publ.
Nordling C.O. (1953). “A new theory on the cancer inducing mechanism”. British J.
Cancer, 7: 68-72.
Osmond C., Gardner M.J. (1982) “Age, period and cohort models applied to cancer mortality rate”. Statistics in Medicine, 1: 245–259.
Peng J., Ganry O., Tramier B., Dubreuil A., Raverdy N., Thulliez A. (2002). “Incidence and Prevalence Estimates for Breast and Colorectal Cancer in the Picardie Area of France”. Revue D Epidemiologie Et De Sante Publique, 50: 427-432.
Peto R., Roe F.J., Lee P.N., Levy L., Clack J. (1975). “Cancer and ageing in mice and men.” Br. J. Cancer, 32, 4: 411-426.
Peto R. (1977). “Epidemiology, multistage models, and short-term mutagenecity tests”. In: Hiatt H.H., Winsten J.A., eds. Origins of Human Cancer. Book C. Human
Rainsford J., Cohen P., Dix D. (1985). “On the role of aging in cancer incidence: analysis of the lung cancer data”. Anticancer Res, 5, 4: 427-430.
Ries L.A.G., Kosary C.L., Hankey B.F., Miller B.A., Harras A., Edwards B.K., eds. (1997). SEER Cancer Statistics Review, 1973–1994. NIH Pub. No. 97–2789. Bethesda, MD: Natl. Cancer Inst.
Robertson C., Boyle P. (1998). “Age-Period-Cohort Analysis of Chronic Disease Rates. I: Modelling Approach”. Statistics in Medicine, 17: 1305-1323.
Robertson C., Gandini S., Boyle P. (1999). “Age-Period-Cohort Models: A Comparative Study of Available Methodologies”. J Clin Epidemiol, 52, 6: 569-583.
Strickler H.D., Goedert J.J., Devesa S.S., Lahey J., Fraumeni J.F., Rosenberg P.S. (2003). “Trends in US Pleural Mesothelioma Incidence Rates Following Simian Virus 40 Contamination of Early Poliovirus Vaccines”. Journal of the National
Cancer Institute, 95: 38-45.
Svensson E., Grotmol T., Hoff G., Langmark F., Norstein J., Tretli S. (2002). “Trends in Colorectal Cancer Incidence in Norway by Gender and Anatomic Site: An Age-Period-Cohort Analysis”. European Journal of Cancer Prevention, 11: 489-495.
Tango T., Kurashina S. (1987). “Age, period and cohort analysis of trends in mortality from major diseases in Japan, 1955 to 1979 - peculiarity of the cohort born in the early Showa Era”. Statistics in Medicine, 6: 709-726.
Tarone R.E., Chu K.C. (1996). “Evaluation of Birth Cohort Patterns in Population Disease Rates”. American Journal of Epidemiology, 143: 85-91.
Tarone R.E., Chu K.C. (2002). “The Greater Impact of Menopause on Er- Than Er+ Breast Cancer Incidence: A Possible Explanation (United States)”. Cancer
Causes & Control, 13: 7-14.
Vaupel J.W., Yashin A.I. (1999). “Cancer rates over Age, Time, and Place: Insights from Stochastic Models of Heterogeneous Populations”. MPIDR Working Paper WP 1999-006