Print ISSN: 2383-451X Online ISSN: 2383-4501 Web Page: https://jpoll.ut.ac.ir, Email: jpoll@ut.ac.ir
Assessment of Spatial and Temporal Variations in Water Quality
Dynamics of River Ganga in Varanasi
Singh, A. N.1, Shrivastava R.1, Mohan D.2, Kumar, P.1*
1. Environmental Pollution Impact Assessment Laboratory, Department of Botany, Udai Pratap Autonomous College, Varanasi.-221002, India 2. Environmental Science Division, Department of Civil Engineering I.I.T.
(B.H.U.), Varanasi-221005, India.
Received: 28.08.2017 Accepted: 16.11.2017
ABSTRACT: River Ganga is one of the prime sacred National Rivers of India, closely
associated with economic, social, and cultural heritage of Indian people. Recently, it has been subjected to immense degradation and pollution as a result of receiving huge amounts of domestic and industrial wastewater as well as religious ritual activities and surface runoff. The present study attempts to study spatial and temporal changes in water quality of River Ganga while calculating its Water Quality Index (WQI) by analyzing 9 physico-chemical, 7 trace metal, and 4 microbiological parameters at eleven sampling stations, on the basis of River Ganga index of Ved Prakash. Thus it can assess water’s suitability for drinking and irrigation purposes along with other human uses. The study is directed towards the use of WQI to describe pollution level in the river for a period of 1 year (from January to December 2014). It has been shown that index values as per CPCB class range between medium to good, while the ones as per NSF Index range from bad to good water quality. The study also identifies critical pollutants, affecting the river water quality within its course through the city. Finally, pH, DO, BOD, DO, EC, and FC have been found to be critical parameters for the stretch in each season of this research. Keywords: Nitrate, Heavy Metals, Manikarnika Ghat, spatial distribution, temporal variation
INTRODUCTION
It is universally accepted that the environment keeps degrading and deteriorating at a rapid rate. The degrading development, industrialization and its concomitant urbanization, unlimited use of fossil fuels, rapid population growth, and indiscriminate use of chemical fertilizers and insecticides have depleted natural resources (Singh, 2010; Pejman et al., 2009; Kunwar, 2004). Rivers are the most vital natural resource for human development, yet
*
Corresponding author, Email: pankaj74bhu@gmail.com
quality parameters. However, due to spatial and temporal variations in water quality, often difficult to interpret, a monitoring program that provides a representative and reliable estimation of surface waters quality is necessary (Noori et al. 2010).
The River Ganga is one of world’s greatest rivers, perhaps not in physical terms but in spiritual ones. It is a fact that there are few rivers on earth to be so important to so many people. Not only is it the largest inland body of water in India, it is the sustainer of its cultural, emotional, religious, philosophical, economic, and commercial system, also (Bhutiani et al., 2015). It flows in a basin in which about 37% of India’s population lives. This densely populated basin with its rich water resources has always been subject to high socio-economic pressures due to rapid growth in population, urbanization, agriculture practices, industry, and deforestation, resulting in depletion of its natural characteristics. (Tavakol et al., 2017b; Basant Rai, 2013; Hamner et. al, 2006). With most of the cities and towns on the banks of Ganga having neither sewerage nor sewage treatment plant, the river water has been considerably polluted along many of these river cities. The extraordinary resilience as well as the recuperative capacity of the river has not been able to cope up with the pollution and check the rapid deterioration of its water quality anymore (Bhutiani and Khanna, 2016; Sharma and Kansal, 2011; Mishra, 2010; Vega, 1998).
The sacred city of Varanasi on the banks of River Ganga is one of the oldest living cities of the world with a recorded history of about 3000 years, being referred to even in earlier literary and mythological texts. Varanasi is situated on the left bank of the river, 1395 km away from its source at an average altitude of 80 m above sea level. There are more than 100 Ghats alongside Ganga in Varanasi. It is believed that people are cleansed physically, mentally, and
spiritually in Ganga Ghats. It is in Ganga Ghats where we see life and death together. For thousands of years people have been coming to these Ghats to offer their morning prayers to the rising sun. The year 1860 saw the first attempt to build a drainage system on modern scientific lines in Dashaswamedh Ghat. A sewer line was constructed in 1899, which having passed through the entire old city of Varanasi discharged in Raj Ghat. The beginning of Ganga pollution with sewage is most closely linked to flush toilets and sewerage systems, the use of which began to spread after 1912. Further growth in using the sewerage system and increase in sewage flows to Ganga took place at the upstream point of the city. In 1964 the Diesel Locomotive Works (DLW) started discharging its sewage and industrial wastes to Ganga. Furthermore, another industrial site opened on the other side of the river, near Ram Nagar, some 5 km upstream Varanasi. This also resulted in a convenient recourse of sewage discharge into one of previously-noted open channels –the Shahi drain or Assi and Varuna River, by the Benaras municipal board. Every year millions of people bathe in Ganga River ghats in Varanasi region. It is important to monitor and judge the river water quality with reference to the indicators near the river bank (and not in terms of their average value for entire width). It is also important to keep this bathing area free from any pollution with regards to all water quality indicators, particularly the fecal coliform count.
MATERIAL AND METHOD
region’s climate is tropical monsoonal with the year divided into a hot and dry summer (Pre-Monsoon), a humid rainy season (Monsoon), and a cold winter season (Post-Monsoon). The ambient mean temperature was lowest in December (9.9 to 26.1 °C) and highest in May-June (27.8 to 40.9 °C). The rainy months remained warm and wet, with humidity reaching close to saturation. The day length was recorded to be the longest in June (about 14 hours) and the shortest in
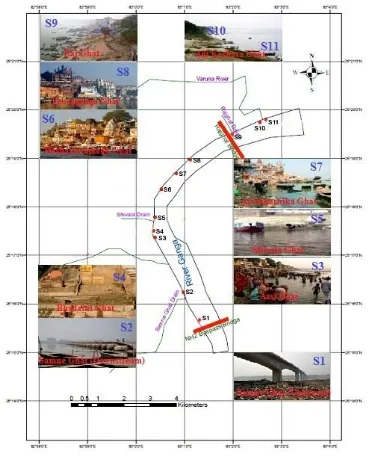
December (about 10 hours). Wind direction shifted predominantly westerly and south-westerly in October through April and easterly and north-westerly in remaining months. Varanasi’s principal attractions for pilgrims and tourists are a long string of bathing Ghats along the Ganga River. After a vigorous survey of Ganga River eleven sampling sites were selected along the stretch of the river for water quality assessment (Figure 1, Table 1).
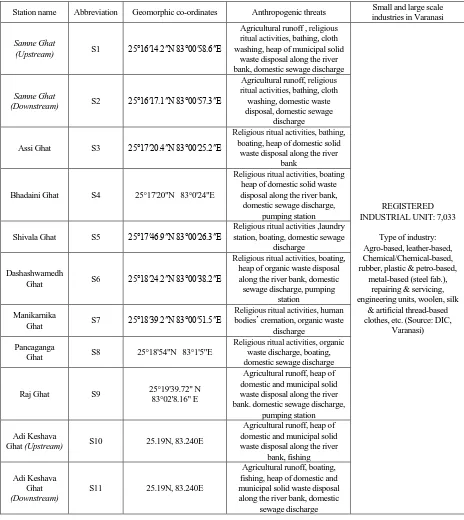
Table 1. Detailed description of the study sites at Ganga River in Varanasi along with the respective point and non-point sources of pollution.
Station name Abbreviation Geomorphic co-ordinates Anthropogenic threats Small and large scale industries in Varanasi
Samne Ghat
(Upstream) S1 25°16′14.2″N 83°00′58.6″E
Agricultural runoff , religious ritual activities, bathing, cloth washing, heap of municipal solid
waste disposal along the river bank, domestic sewage discharge
REGISTERED INDUSTRIAL UNIT: 7,033
Type of industry: Agro-based, leather-based, Chemical/Chemical-based, rubber, plastic & petro-based,
metal-based (steel fab.), repairing & servicing, engineering units, woolen, silk
& artificial thread-based clothes, etc. (Source: DIC,
Varanasi) Samne Ghat
(Downstream) S2 25°16′17.1″N 83°00′57.3″E
Agricultural runoff, religious ritual activities, bathing, cloth washing, domestic waste disposal, domestic sewage
discharge
Assi Ghat S3 25°17′20.4″N 83°00′25.2″E
Religious ritual activities, bathing, boating, heap of domestic solid
waste disposal along the river bank
Bhadaini Ghat S4 25°17'20"N 83°0'24"E
Religious ritual activities, boating heap of domestic solid waste disposal along the river bank, domestic sewage discharge,
pumping station
Shivala Ghat S5 25°17′46.9″N 83°00′26.3″E
Religious ritual activities ,laundry station, boating, domestic sewage
discharge
Dashashwamedh
Ghat S6 25°18′24.2″N 83°00′38.2″E
Religious ritual activities, boating, heap of organic waste disposal along the river bank, domestic sewage discharge, pumping
station
Manikarnika
Ghat S7 25°18′39.2″N 83°00′51.5″E
Religious ritual activities, human bodies’ cremation, organic waste
discharge
Pancaganga
Ghat S8 25°18'54"N 83°1'5"E
Religious ritual activities, organic waste discharge, boating, domestic sewage discharge
Raj Ghat S9 25°19'39.72" N 83°02'8.16" E
Agricultural runoff, heap of domestic and municipal solid waste disposal along the river bank. domestic sewage discharge,
pumping station
Adi Keshava
Ghat (Upstream) S10 25.19N, 83.240E
Agricultural runoff, heap of domestic and municipal solid waste disposal along the river
bank, fishing
Adi Keshava Ghat (Downstream)
S11 25.19N, 83.240E
Agricultural runoff, boating, fishing, heap of domestic and municipal solid waste disposal along the river bank, domestic
sewage discharge
Samples were collected in the summer (pre-monsoon), the humid rainy season (monsoon), and the cold winter season (post-monsoon) of 2014 to monitor changes, caused by agricultural runoff, urban discharge, laundry, heap of municipal solid waste, industrial effluent, and anthropogenic as well as natural sources. The samples were
fecal coliform Salmonella paratyphi, and Salmonella typhi. In situ measurement was adopted to determine unstable parameters, including pH, temperature, total dissolved sold (TDS), and dissolve oxygen (DO) by a portable multi parameter (Eutech -PCD650 and Eutech-CyberScan DO 110), to minimize the errors with time due to biological and chemical reactions between the atmosphere and the sample (Hutton
1983). Sampling, preservation,
transportation, and analysis of other parameters was carried out in accordance with standard methods of APHA (2001). Composite sampling took place at each site, with the samples being qualitatively analyzed and presented in Table 2. The indexes used, are described below:
The River Ganga Index of Ved Prakash et al. (Abbasi and Abbasi 2012) Water Quality over the study period was evaluated, using the Ganga River Index of Ved Prakash et al. This WQI is based on the weighted multiplication form and is obtained from the following equation:
WQI WiIi
1
p
i
where Wi is the weight associated with the ith water quality parameter; Ii, the sub index for the ith water quality parameter; and p, the number of water quality parameters. This index is based on WQI by National Sanitation Foundation (NSF-WQI) with slight modifications in terms of the weights to conform to water quality criteria for different categories of usages, set by the Central Pollution Control Board, India.
RESULTS AND DISCUSSION
Table 2 shows the seasonal statistical variations of physicochemical, heavy metals, and microbiological parameters at different sampling sites in Ganga River during the 1-year period (January 2014– December 2014).
It has been well established that huge sewage discharge and dead body cremation are the prime sources of organic matter of
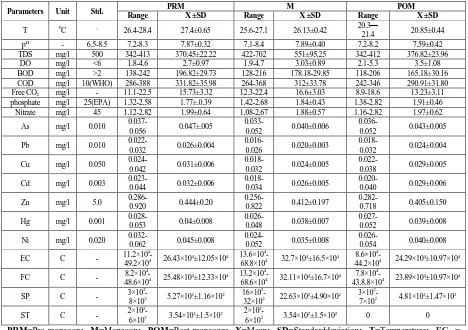
Table 2. Seasonal Statistical variations (Range, X ±SD) among various Physico-chemical, microbiological, and heavy-metal parameters in water from eleven study sites of Ganga River, recorded in 2014
Parameters Unit Std. PRM M POM
Range X ±SD Range X ±SD Range X ±SD
T 0C - 26.4-28.4 27.4±0.65 25.6-27.1 26.13±0.42 20.3—
21.4 20.85±0.44 pH - 6.5-8.5 7.2-8.3 7.87±0.32 7.1-8.4 7.89±0.40 7.2-8.2 7.59±0.42
TDS mg/l 500 342-413 370.45±22.22 422-702 551±95.25 342-412 376.82±23.96 DO mg/l <6 1.8-4.6 2.7±0.97 1.9-4.7 3.03±0.89 2.1-5.3 3.5±1.08 BOD mg/l >2 138-242 196.82±29.73 128-216 178.18-29.85 118-206 165.18±30.16 COD mg/l 10(WHO) 286-388 331.82±35.98 264-368 312±33.78 242-346 290.91±31.80 Free CO2 mg/l - 11.1-22.5 15.73±3.32 12.3-22.4 16.6±3.03 8.9-18.6 13.23±3.11
phosphate mg/l 25(EPA) 1.32-2.58 1.77±.0.39 1.42-2.68 1.84±0.43 1.38-2.82 1.91±0.46 Nitrate mg/l 45 1.12-2.82 1.99±0.64 1.08-2.67 1.88±0.57 1.16-2.82 1.97±0.62
As mg/l 0.010
0.037-0.056 0.047±.005
0.033-0.052 0.040±0.006
0.036-0.052 0.043±0.005
Pb mg/l 0.010
0.022-0.032 0.026±0.004
0.016-0.026 0.020±0.003
0.018-0.032 0.024±0.004
Cu mg/l 0.050
0.024-0.042 0.031±0.006
0.018-0.032 0.024±0.005
0.022-0.038 0.029±0.005
Cd mg/l 0.003
0.023-0.044 0.032±0.006
0.018-0.034 0.026±0.005
0.020-0.040 0.029±0.006
Zn mg/l 5.0 0.286-0.920 0.444±0.20 0.256-0.822 0.412±0.197 0.282-0.718 0.405±0.150
Hg mg/l 0.001
0.028-0.053 0.04±0.008
0.026-0.048 0.038±0.007
0.027-0.052 0.039±0.008
Ni mg/l 0.020
0.032-0.062 0.045±0.008
0.024-0.052 0.035±0.008
0.026-0.054 0.040±0.008
EC C - 11.2×10
4
-49.2×10⁴ 26.43×10⁴±12.05×10⁴ 13.6×10 4
-68.8×10⁴ 32.7×10⁴±16.5×10⁴ 8.6×10 4
-44.2×10⁴ 24.29×10⁴±10.97×10⁴
FC C - 8.2×10
4
-48.6×10⁴ 25.48×10⁴±12.33×10⁴
13.2×10⁴
-68.6×10⁴ 32.11×10⁴±16.7×10⁴
7.8×10⁴
-43.8.8×104 23.89×10⁴±10.97×10⁴
SP C - 3×10
2
-8×10² 5.27×10²±1.16×10²
16×102
-32×102 22.63×10²±4.90×10²
3×10²
-7×10² 4.81×10²±1.47×10²
ST C - 2×10
2
-6×10² 3.54×10
2±1.5×10² 2×10²
-6×10² 3.54×10
2±1.5×10² 0 0
PRM=Pre-monsoon; M=Monsoon; POM=Post-monsoon; X=Mean; SD=Standarddeviation; T=Temperature; EC =
Escherichia coli; FC= feacal Coliform; SP= Salmonella paratyphi: ST= Salmonella typhi; C= CFU/100ml,
Std.=Standard(BIS 10500 : 2012)
to the strong presence of dissociate electrolyte and dissolved organic matter, entering into the river water through a number of point and non point sources. DO is essential to maintain various forms of life in the river water. It ranged from 1.8 to 5.3 with the highest value being recorded in post-monsoon season at S2 and the lowest one in pre-monsoon at S7 and S9. The current trends of DO depletion in most sampling stations is due to the presence of high organic load, poured by drain, as well as religious ritual activities along the river bank. Inorganic reducing agents such as hydrogen sulphide, ammonia, nitrite, ferrous iron, and certain oxidizable substances also tend to decrease dissolved oxygen in water (Tarzwell, 1957). The BOD value, recorded in the river water,
to this phenomenon, too. COD is quite useful to find out the pollution strength of sewage as well as industrial waste. The amount of COD, recorded in the river, ranged between 242 mg/l and 388 mg/l. Maximum COD of 388 mg/L belonged to S7, followed by S9 in pre-monsoon, while the minimum (242mg/l) was found in S4 during post-monsoon season. The current trends in increasing COD concentration were found in the bottom water, which possesses more organic matter (Prasad & Qayyum, 1976). Discharge of untreated industrial and domestic waste as well as religious ritual activities along the bank of river can be considered a considerable contributor to inorganic and organic carbon to raise COD. Free CO2 is present in river water as dissolved gas, being quite useful to find out the pollution strength of organic waste. The amount of free CO2, recorded in the River water, ranged between 8.9 mg/l and 22.5 mg/l. Free CO2 were observed to be the highest 22.5 mg/l and 22.4 at S7 in pre-monsoon and monsoon seasons, respectively with the minimum value being 8.9 mg/l at S2 in post-monsoon season. Degrading organic waste as well as nutrient richness may increase free CO2 in river water. The nitrate ranged from 1.08 to 2.82 mg/l, while phosphate fluctuated between 1.32 and 2.82 mg/l. Nitrate proved to be the highest 2.82 mg/l at S9 in pre-monsoon and S6 in post pre-monsoon, followed by S6 in pre-monsoon and S5 in post-monsoon. The minimum value was 1.08 mg/l at S8 in monsoon, followed by S8 in pre-monsoon season. At the same time, the highest amount of phosphate, equal to 2.82 mg/l, belonged to S9 in post-monsoon and the lowest one, 1.32 mg/l, to S3 in pre-monsoon. Most of the sites had been receiving domestic sewage too; therefore, heavy influx of organic load was noticed, here. Phosphate and Nitrate were higher in most locations, due to the increase of pollution load through domestic sewage, addition of nutrients, agricultural
runoff, and organic matter in water (Sanap et al. 2006; Bhutiani et al. 2016).
physico-chemical conditions (Pandey et al. 2014; Qiao et al., 2013; Sharma and Subramanian, 2010). The concentration of zinc was the lowest at S8 (0.256 mg/l) in monsoon season and the highest at S11 (0.920 mg/l) in pre-monsoon. The source of Zn in Varanasi could be various small scale iron-alloy industries as well as discharge of untreated effluents from other medium- and small-scale establishments. In the present study, Mercury concentration varied from 0.026 mg/l (at S10 in monsoon season) to 0.053 mg/l (at S2 followed by S9, both in pre-monsoon season). Presence of mercury in the river showed that the source of pollution in Varanasi might have been untreated drains, carrying waste from urban and industrial effluent. The highest concentration of nickel (Ni) in the present study belonged to S9 (0.062 mg/l), followed by S9 (0.054 mg/l) in post-monsoon, while the lowest concentration was recorded at S1 (0.024 mg/l) in monsoon season. The higher concentration of Ni in the river water than the baseline concentration suggested the anthropogenic origin of the metal in the river (Qiao et al., 2013; Sharma and Subramanian, 2010).
Bacteria are the chief decomposer and indicator of organic pollution. Escherichia coli, Faecal coliform, Salmonella paratyphi, and Salmonella typhi were studied as microbiological pollution indicators. Bacterial population had been affected by seasonal variations with their maximum concentration being found in monsoon due to favorable temperature, high turbidity, and addition of further sewage and feacal matter through surface runoff. Low bacterial concentration of post-monsoon season was because of lowest water temperature and comparatively low input of organic matter. Feacal Coliform is supposed to be a more reliable indicator of feacal pollution of water than E. coli (Kennar, 1978), because not only are they unable to multiply outside the bodies of human and other warm blooded animals (Mathur and Ramanathan, 1966;
Mishra and Tripathi, 2007) but their survival is more prolonged in surface water than other coliform types. In favorable conditions, when they find suitable hosts, these pathogenic bacteria, like Salmonella typhi, and S. paratyphi, in the water may cause acute to severe diseases. The pathogenic bacteria were prominent in monsoon season as organic matters enhanced their growth and multiplication, which was followed by pre-monsoon season.
municipal sewage and industrial wastewater which is mixed with the city's sewage network and goes directly into the river untreated, being nonpoint sources of pollution in the study area. The variations of
WQI values in all stations are due to the fluctuations in the quantity of water and waste disposals in the river (religious ritual activities as well as domestic, industrial, and solid wastes).
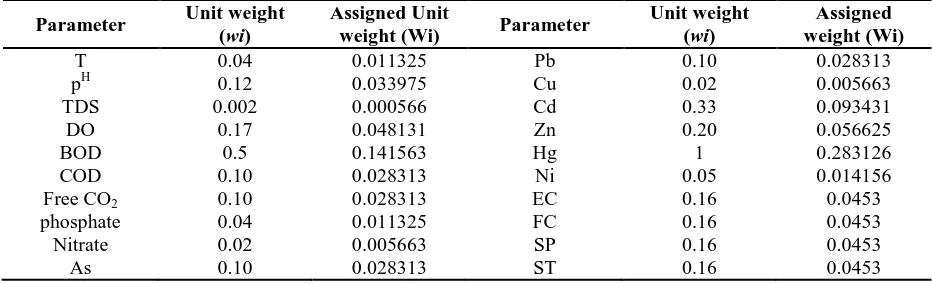
Table 3. Unit weights for the parameters of river water quality, used for the calculation of WQI
Parameter Unit weight (wi)
Assigned Unit
weight (Wi) Parameter
Unit weight (wi)
Assigned weight (Wi)
T 0.04 0.011325 Pb 0.10 0.028313
pH 0.12 0.033975 Cu 0.02 0.005663
TDS 0.002 0.000566 Cd 0.33 0.093431
DO 0.17 0.048131 Zn 0.20 0.056625
BOD 0.5 0.141563 Hg 1 0.283126
COD 0.10 0.028313 Ni 0.05 0.014156
Free CO2 0.10 0.028313 EC 0.16 0.0453
phosphate 0.04 0.011325 FC 0.16 0.0453
Nitrate 0.02 0.005663 SP 0.16 0.0453
As 0.10 0.028313 ST 0.16 0.0453
Table 4. WQI of water quality for Ganga River in Varanasi City
Site S1 S2 S3 S4 S5 S6 S7 S8 S9 S10 S11
WQI 44.61 45.3 51.51 44.62 49.21 50.69 53.67 45.95 59.19 46.21 51.45
Table 5. NSF WQI for various designated best use*.
Serial No NSF WQI Description of
quality (1978) Class by CPCB Remarks
1 63-100 Good to excellent A Non polluted
2 50-63 Medium to good B Non polluted
3 38-50 Bad C Polluted
4 38 & less Bad to very bad D,E Heavily polluted
*CPCB 2001, Abbasi 2002.
CONCLUSION
Using water quality index for a complete year, the present study took a seasonal variation into account in order to make the necessary conclusions. WQI Value is a very useful tool for evaluation of overall pollution of water bodies. The WQI values of the present study indicate that the water samples from the river have been moderately contaminated with respect to physico-chemical, heavy metal, and microbiological parameters. The data for different sampling sites have been successfully collected during the aforementioned time period and it has been used to discuss the pollution level of Ganga River. Over the course of a year, the river has been subjected to human interference regularly and the water quality has been continuously deteriorated profoundly. Major anthropogenic activities, practiced in and around the stretch, including agriculture, obstruction of water for irrigation and drinking, washing clothes and utensils, discharge of sewage water as well as industrial effluent, disposal of municipal solid waste along the bank of river, and religious ritual activities along the stretch, has been posing a serious threat to biota by
altering the physico-chemical,
microbiological, and heavy metal concentration of the river system. Moreover, this analysis will help in future water control management program as it has outlined the parameters, contributing to pollution for every site. It is, therefore, necessary to develop a comprehensive river water quality monitoring program all over the world (Sharma and Kansal 2011).
Authors’ contributions
All of the authors have the same contribution, having read and approved the final manuscript.
Acknowledgments
Authors are grateful to the Head, Department of Botany, Udai Pratap College (Autonomous), Varanasi and Environmental Science Division, Department of Civil
Engineering I.I.T. (B.H.U.), Varanasi for technical support and laboratory facilities during this research work.
REFERENCE
Abbasi, S. A. (2002). Water Quality Indices. State of the Art Report, National Institute of Hydrology, Scientific Contribution No. INCOH/SAR-25/2002, Roorkee: INCOH, 73.
Acharyya, S. K. (2005). Arsenic levels in groundwater from Quaternary alluvium in Ganga Plain and the Bengal Basin, Indian subcontinent: Insights into influence of stratigraphy. Gondwana Research, 8:55-66.
APHA (2001). Standard methods for the examination of water and wastewater, American Public Health Association Washington D.C., Ed.19. Basant, R. (2013). Pollution and Conservation of Ganga River in Modern, India. International Journal of Scientific and Research Publications, 3(4):1-4.
Bhutiani R., Khanna D. R., Kulkarni D. B. and Ruhela M. (2016). Assessment of Ganga River ecosystem at haridwar, Uttarakhand, India with reference to water quality indices. Appl Water Sci., 6(2), 107–113. DOI 10.1007/s13201-014-0206-6. Bhutiani, R., and Khanna, D. R. (2016). DO-BOD modeling of River Ganga from Devprayag to Roorkee, India using BMKB model. Pollution, 2(1), 25-34. DOI: 10.7508/PJ.2016.01.003.
Bhutiani, R., Khanna, D. R., Tyagi, B., Tyagi, P. and Kulkarni, D. (2015). Assessing environmental contamination of River Ganga using correlation and multivariate analysis. Pollution, 1(3), 265-273. DOI: 10.7508/PJ.2015.03.003.
Hamner, S., Tripathi, A., Misra, R. K., Bauskill, N., Broadway, S. C., Pyle, B. H. and Ford, T. E. (2006). The role of water use patterns and sewage pollution in incidence of water borne/enteric disease along the Ganges River in Varanasi, India. International Journal of Environmental Health Research, 16:113-132.
Hutton, L. G. (1983). Field testing of water in developing countries. Water Research Center/Water and Waste Engineering for Deivloping Countries Group. Medmenham, England.
Jain, S. K., Agarwal, P. K. and Singh, V. P. (2007) Hydrology and Water Resources of India, , 57:333-418.
Kesharwani, S., Mandoli, A. K. and Dude K. K. (2004). Determination of water quality Index (WQI) of Amkhera pond of Jabalpur city (M. P.). Ntl. J. Life Sci.,1, 61-66.
Kumari, M., Smriti, T., Vinita, P., Tripathi B. D. (2013). Chemometric characterization of river water quality. Environmental Monitoring and Assessment 185(4):3081-3092.
Mathur, R. P. and Ramanathan, K. N. (1996). Significance of enterobacteria as pollution indicator. Envir. Health., 8(1):1-5.
Mayank, P., Smriti, T., Pandey, A. K. and Tripathi, B. D. (2014). Risk assessment of metal species in sediments of the river Ganga, Catena, 122:140–149. Mishra, A. and Tripathi, B. D. (2007). Seasonal and Temporal variations in physico-chemical and bacteriological characteristics of river Ganga in Varanasi. Current World Enviroment, 2(2):149-154. Mishra, A. (2010). Assessment of water quality using principal component analysis: a case study of the river Ganges. Journal of Water Chemistry and Technology, 32(4): 227–234.
Mishra, A., Mukherjee, A. and Tripathi, B. D. (2009). Seasonal and Temporal Variations in
Physico-chemical and Bacteriological
Characteristics of River Ganga in Varanasi. International Journal of Environmental Research, 3(3):395-402.
Nasirian, M. (2007). A new water quality index for environmental contamination contributed by mineral processing: a case study of among (Tin Tailing) processing activity. Journal of Applied Sciences, 7:2977-2987.
Noori, R., Sabahi, M. S., Karbassi, A. R., Baghvand, A. and Zadeh, H. T. (2010). Multivariate statistical analysis of surface water quality based on correlations and variations in the data set. Desalination, 260(1–3), 1-8. doi:10.1016/j.desal.2010.04.053.
Pejman, A. H., Bidhendi, G. R. N., Karbassi, A. R., Mehrdadi, N. and Esmaeili Bidhendi, M. (2009). Evaluation of spatial and seasonal variations in surface water quality using multivariate statistical techniques. Int. J. Environ. Sci. Tech., 6 (3), 467-476.
Prasad, D. Y. and Qayyum, M. A. (1976). Pollution aspects of Upper Lake Bhopal. Indian Journal of Zoology, 4(1):35-46.
Qiao, Y., Yang, Y., Gu, J. and Zhao, J.(2013). Baseline distribution and geochemical speciation of heavy metals in sediments fromcoastal area suffered rapid urbanization, a case study of Shantou Bay, China. Mar. Pollut. Bull. 68:140–146.
Raju, N. J. (2012). Arsenic exposure through groundwater in the middle Ganga plain in the Varanasi environs, India: A future threat, Journal of the Geological Society of India , 79(3): 302-314 Sharma, D. and Kansal, A. (2011). Water quality analysis of river Yamuna using water quality index in the national capital territory, India (2000–2009). Applied Water Science, 1:147–157.
Sharma, S.K. and Subramanian, V. ( 2010). Source and distribution of tracemetals and nutrients in Narmada and Tapti river basins, India. Environ. Earth Sci. 61:1337–1352.
Singh, A., Sharma, R. K., Madhoolika, A. and Marshall, F. M. (2010). Health risk assessment of heavy metals via dietary intake of foodstuffs from the wastewater irrigated site of a dry tropical area of India Food and Chemical Toxicology, 48(2):611–619. Singh, K. P., Mohan, D., Sinha, S. and Dalwani, R. (2004). Impact assessment of treated/untreated wastewater toxicants discharged by sewage treatment plants on health, agricultural, and environmental quality in the wastewater disposal area Chemosphere 55 (2): 227–255.
Singh, M. and Singh, A. K. (2007). Bibliography of Environmental Studies in Natural Characteristics and Anthropogenic Influences on the Ganga River. Environ Monit Assess, 129(1-3):421-432.
Singh, S., Malik, D., Thakur, J., Kaur, A., Singh, R. K. and Nijhawan, S. (2014). A Comparative Analysis of the Physico-chemical Properties and Heavy Metal Pollution in Three Major Rivers across India International Journal of Science and Research, 3(8): 1936-1941.
Sya, B. K. (2015). Pollution and the Renegotiation of River Goddess Worship and Water Use Practices among the Hindu Devotees of India’s Ganges/Ganga River The Changing World Religion Map: pp 557-576
Tarzwell, C. M. (1957). In: Biological problems in water pollution. U.S. Dept. of Health Education and Welfare. P.H.S. 246-272.
Tavakol, M., Arjmandi, R., Shayeghi, M., Masoud, S., Monavari, and Karbassi, A. (2017b). Application of Multivariate Statistical Methods to Optimize Water Quality Monitoring Network with Emphasis on the Pollution Caused by Fish Farms. Iran J Public Health, 46(1), 83-92.
Pollution is licensed under a "Creative Commons Attribution 4.0 International (CC-BY 4.0)" Tripathi, B., Pandey, R., Raghuvanshi, D., Singh,
H., Pandey, V. and Shukla, D. N. (2014). Studies on the Physico-chemical Parameters and Correlation Coefficient of the River Ganga at Holy Place Shringverpur, Allahabad, IOSR Journal of Environmental Science, Toxicology and Food Technology, 8(10):29-36.
Tripathi, S. and Tripathi, B .D. ( 2011). Efficiency
of combined process of ozone and bio-filtration in the treatment of secondary effluent. Bioresour. Technol. 102:6850–6856.