DEMOGRAPHIC RESEARCH
VOLUME 30, ARTICLE 52, PAGES 1445
−
1462
PUBLISHED 9 MAY 2014
http://www.demographic-research.org/Volumes/Vol30/52/ DOI: 10.4054/DemRes.2014.30.52
Descriptive Finding
Births to single mothers: Age- and
education-related changes in Poland between 1985 and 2010
Zuzanna Brzozowska
©2014 Zuzanna Brzozowska.
This open-access work is published under the terms of the Creative Commons Attribution NonCommercial License 2.0 Germany, which permits use, reproduction & distribution in any medium for non-commercial purposes, provided the original author(s) and source are given credit.
1 Introduction 1446
2 Data and methods 1446
3 Results 1448
3.1 Trends in marital and non-marital fertility 1448
3.2 Educational differences among single mothers 1450
3.3 Age-related changes among single mothers 1452
4 Discussionand conclusion 1455
5 Acknowledgments 1456
References 1457
Births to single mothers: Age- and education-related changes in
Poland between 1985 and 2010
Zuzanna Brzozowska1
Abstract
BACKGROUND
In Poland the share of non-marital births has increased steadily for more than two decades. Studies differentiating between births to unmarried partnered and unpartnered women are rare.
OBJECTIVE
This paper examines the age- and education-related changes in the share of births to unpartnered women in a setting characterised by a rising non-marital birth ratio.
METHODS
I use Polish birth registers for the years 1985 to 2011, which cover all births between 1985 and 2010 and contain some information on the parents (e.g., date of birth, education, and marital status at the time of the child’s birth).
RESULTS
In the analysed period the share of births to unpartnered women was stable at a level of 3%-5% of all births. Substantial increases were only noted among the least educated and teenage mothers, whose values exceeded 20% and 30%, respectively, in 2010. The share of teenagers among unpartnered mothers rose from around a quarter to more than one-third.
CONCLUSIONS
In Poland the share of births to unpartnered women remained stable in the period 1985-2010, but the number of the youngest and least educated mothers in this share increased.
1 Wittgenstein Centre for Demography and Global Human Capital (IIASA, VID/ÖAW, WU),
1. Introduction
Under state socialism Poland had a stable non-marital birth ratio of around 5% until the mid-1980s (Szukalski 2004). Thereafter the ratio rose steadily to 22% in 2012 (Eurostat 2013). The forces driving this upward trend are known to be a faster decline in marital than in non-marital fertility (Bolesławski 2001, Kotowska et al. 2008), along with women’s lower propensity to marry once they are pregnant (Baranowska 2010, Brzozowska 2012). However, what has not been studied much is the distinction between births to unmarried partnered, as opposed to single2 women. This paper examines the trends in the share of births to unpartnered mothers by education and age in Poland in the period 1985−2010.
2. Data and methods
The data were taken from Polish birth registers and covered all births between 1985 and 2010 (for estimating marital and non-marital birth rates I also used the 2011 birth register). Multiple births were counted as single births. Hence, the dataset used for the analyses encompassed women who gave birth in the given period rather than children born. Besides information on the newborns the birth registers also contained some data on the parents at the time of the child’s birth, e.g., date of birth, date of marriage if applicable, marital status, education, and the number of children the mother had previously given birth to. The dates of birth and marriage and the marital status were taken from legal documents (ID cards, marriage and divorce certificates), whereas information on education and parity was provided by the parents. Additionally, I used the female mid-year population structure by age as contained in the demographic yearbooks, and the female population structure by age and marital status obtained from the 1995 Polish population micro census and the 1988, 2002, and 2011 Polish population censuses (CSO 1989, 1996, 2003, 2013).
For married couples, paternity is established automatically once the father’s ID card and the marriage certificate have been presented at the register office. For unmarried couples, paternity is established by a formal acknowledgement signed by both the child’s mother and father. No information on the father, i.e., unknown fatherhood, indicates not only that the child’s father does not have an emotional bond with his child and the child’s mother (Štípková 2013), but also that mothers who want to receive child support face lengthy legal proceedings. Thus I took the lack of information on the father as a proxy for being a single mother at the time of giving
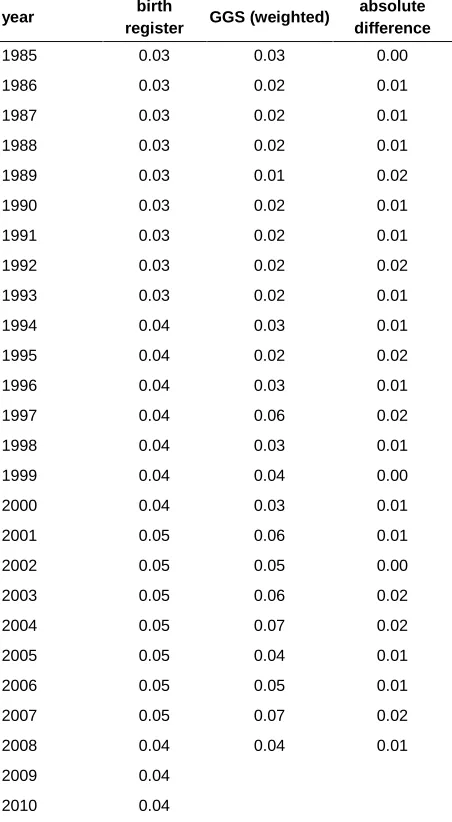
birth. By doing so I might have slightly underestimated single motherhood, as it is unlikely that all registered fathers live in partnership with their babies’ mothers. Unfortunately there was no way to thoroughly test the proxy as, to the best of my knowledge, no dataset contains explicit information on mothers who do not have a partner at the time they give birth. A year-by-year check against the Polish Generations and Gender Survey (GGS) yielded satisfactory results: the estimated shares of mothers who were single when they gave birth were similar to those obtained from the birth registers with the help of the proxy (average difference: one percentage point in the period 1985-2008, see Table 2 in Appendix). Therefore, missing information on the father seems to be a very good proxy for single motherhood. However, it should be noted that in the GGS partnership was defined as marriage or cohabitation; hence women not living together with their partners, i.e., women in a living-apart-together partnership, were classified as single.
I excluded births to widows (0.3% of all cases) from the analysis as the dataset did not contain information on the husband’s date of death, which made it impossible to decide whether the late husband or a new partner was the child’s legal father. I classified children of divorcees and women living in separation as non-marital. By law, children born up to 300 days after divorce or separation are regarded as being born in wedlock: the divorced or separated husband is presumed to be the father (Sejm of the People’s Republic of Poland 1964). However, in Poland it takes at least a few months to get a divorce and to acquire the legal status of a divorcee. I therefore worked with the assumption that only few women get pregnant by their husband when the couple is on the brink or in the middle of a divorce. In most cases the newborn is probably the child of a man to whom the mother is not married. But even if my assumptions were wrong or only partially true, the share of divorcees and women living in separation at the time of giving birth (i.e., the potentially biased results) amounted to 1.6% (1.9% if widows are included).
I excluded 0.15% of the cases because of missing information on the mother’s education. Adding this percentage to the births to widows yields a total of 0.45% cases that were excluded. The final dataset thus contained 12,158,821 cases (see Table 1 in Appendix).
3. Results
3.1 Trends in marital and non-marital fertility
The estimates (Figure 1a) show that while the marital birth rate declined sharply between 1988 and 2002, the number of non-marital births per 1,000 unmarried women oscillated around 12 at that time. Between 2002 and 2011 both marital and non-marital birth rates rose substantially from 52.06 and 11.97 to 58.85 and 18.15, respectively. When analysed in five-year age groups (Figure 1b and 1c) the trends in marital fertility among women aged 25 and more were very similar to the general trend. Among the 20-24 year-olds marital fertility declined continuously (from 323 to 186 marital births per 1,000 married women) and among teenagers the figures fluctuated between 628 and 455. Between 1988 and 2002 non-marital fertility decreased a little in the three oldest groups and varied slightly in the two youngest groups (between 6.2 and 7.5 among teenagers and 16.4 and 19.3 among the 20−24 year-olds). During the last two years observed it increased substantially in all age groups.
Figure 1a: Non-marital and marital births per 1,000 unmarried and married women, respectively, aged 15−49, Poland 1988−2011
0 10 20 30 40 50 60 70 80 90 100
1988 1995 2002 2011
Figure 1b: Marital births per 1,000 married women, by age, Poland 1988−2011
Figure 1c: Non-marital births per 1,000 unmarried women, respectively, by age, Poland 1988−2011
Source: Own calculations based on the female population structure by age and marital status (population micro census 1995, population censuses 1988, 2002, and 2011) and births by mothers’ age and marital status (birth registers 1988, 1995, 2002, and 2011).
0 100 200 300 400 500 600 700
1988 1995 2002 2011
below 20 20-24 25-29 30-34 35 and more
0 5 10 15 20 25 30 35
1988 1995 2002 2011
3.2 Educational differences among single mothers
Figures 2a-d show an increase in the non-marital birth ratio between 1985 and 2010 in all educational groups, albeit at a very different pace: from 9% to 57% among the least educated and from 3% to 10% among the highly educated. The higher the education, the later and slower non-marital childbearing began to spread, but it has proliferated noticeably faster in all educational groups since the year 2000. Except for the least educated, the increase in the non-marital birth ratio was almost entirely driven by a growing share of births to partnered women, while the percentage of births to single mothers remained low throughout the analysed period. In 1985 it was 3% among mothers with basic vocational education and 2% among those with secondary and tertiary education; in 2010 it amounted to 5%, 3%, and less than 1%, respectively. Among women with primary education the share of single mothers was already higher in 1985 (5%) and grew faster (to 22% in 2010), but was still outweighed by the percentage of births to unmarried women who had a partner (4% in 1985 and 35% in 2010). Thus, the educational differences in the share of non-marital births to both partnered and unpartnered women grew in the course of time. At population level the proportion of births to single mothers remained rather stable varying between 3% and 5% (see Table 2 in Appendix).
Figure 2a: Share of non-marital births to partnered and unpartnered women among all births, primary education
0% 10% 20% 30% 40% 50% 60%
1985 1986 1987 1988 1989 1990 1991 1992 1993 1994 1995 1996 1997 1998 1999 2000 2001 2002 2003 2004 2005 2006 2007 2008 2009 2010
Figure 2b: Share of non-marital births to partnered and unpartnered women among all births, basic vocational education
Figure 2c: Share of non-marital births to partnered and unpartnered women among all births, secondary education
0% 5% 10% 15% 20% 25% 30%
1985 1986 1987 1988 1989 1990 1991 1992 1993 1994 1995 1996 1997 1998 1999 2000 2001 2002 2003 2004 2005 2006 2007 2008 2009 2010
unmarried partnered women unpartnered women
0% 5% 10% 15% 20% 25%
1985 1986 1987 1988 1989 1990 1991 1992 1993 1994 1995 1996 1997 1998 1999 2000 2001 2002 2003 2004 2005 2006 2007 2008 2009 2010
Figure 2d: Share of non-marital births to partnered and unpartnered women among all births, tertiary education
Source: Own calculations based on birth registers 1985-2010.
3.3 Age-related changes among single mothers
The age composition of single mothers (Figure 3) shows that giving birth without having a partner is a pattern mostly found among young women. In the analysed period on average one-third was below age 20 (compared to one-seventh for all first births,3 see Figure 6 in Appendix). The share of teenagers in this group increased from 26% to 35%, while that of women in their early 20s slightly decreased (from 33% to 28%). The shares of women aged 25−29 and 30−34 dropped from 22% and 12% to 12% and 6%, respectively, until the mid-1990s and early 2000s, and then rose up to 19% and 10%, respectively. The share of the oldest category (aged 35 and more) oscillated around 7%. Overall, the age distribution of single mothers did not change radically over time. The age distribution of all first-time mothers, however, underwent considerable changes: the share of teenagers grew from 15% to 19% until 1993 and then shrank to 8% in 2010. The percentage of the 20-24 year-olds remained stable until 1995 (over 50%), when it started to decline (28% in 2010) and was only outweighed by the share of 25−29
3 As births to single mothers are overwhelmingly (around 70%) of order one, I refer to first births whenever I
compare births to single women and all births. 0%
5% 10% 15%
1985 1986 1987 1988 1989 1990 1991 1992 1993 1994 1995 1996 1997 1998 1999 2000 2001 2002 2003 2004 2005 2006 2007 2008 2009 2010
olds, which almost doubled to more than 40% in 2010. The share of the oldest categories (i.e., mothers aged 30−34 and older than 34) almost tripled and exceeded 17% and 4%, respectively (see Figure 6 in Appendix). Thus the changes in the age structure of single mothers and of all first-time mothers are characterised by a reverse development: while the former got younger over time, the latter got older.
Figure 3: Age composition of single mothers
Source: Own calculations based on birth registers 1985−2010.
The share of births to single women increased mostly at young ages: while it was stable at the level of 1%-3% among mothers aged 25 and above it slightly increased among those aged 20−24 (from 3% in 1985 to 7% in 2006; it then dropped to 5.5% in 2010, see Figure 7 in Appendix). The figures for teenagers, however, almost tripled, starting from less than 11% in 1985 and reaching 32% in 2010. In the same period the non-marital birth ratio among teenagers soared from 17% to 72% (Figure 4). Hence, the share of births to singles among all non-marital births to teenage mothers declined from 64% to 44%.
0% 10% 20% 30% 40% 50% 60% 70% 80% 90% 100%
1985 1986 1987 1988 1989 1990 1991 1992 1993 1994 1995 1996 1997 1998 1999 2000 2001 2002 2003 2004 2005 2006 2007 2008 2009 2010
Figure 4: Share of non-marital births to partnered and unpartnered women among all births to teenagers
Source: Own calculations based on birth registers 1985-2010.
Moreover, teenage single mothers became younger over time. While the share of those aged 18−19 amounted to almost two-thirds in 1985, it dropped to slightly more than one-third in 2010. The share of teenage single mothers aged 16 and 17 doubled, reaching one-fifth and two-fifths, respectively (see Figure 8 in Appendix). This means that in 2010 more than eight in ten teenage single mothers were still in education, which is compulsory up to age 18 in Poland. The percentage of those with primary (ISCED-97 1 or 2) education grew from 68% in 1985 to 85% in 2010 (results not shown).
The picture is similar when we analyse the trends for the share of teenagers who have a baby but no partner (Figure 5). In 1985 the probability of single motherhood was higher for older teenagers, but in 1993 the 17 year-olds, and in 2009 the 16 year-olds, outweighed those aged 18−19. While the percentage of single mothers among girls aged 18 and 19 decreased over time, the shares among those aged 15−17 more than doubled (see Figure 5). This was the only age group in which the probability of single motherhood increased, while it decreased in all other age groups. At the same time, the probability of becoming a mother for a teenage girl oscillated below 1% for the 15−17 year-olds and dropped from 7% to less than 3% for those aged 18−19 (results not shown).
0% 10% 20% 30% 40% 50% 60% 70%
1985 1986 1987 1988 1989 1990 1991 1992 1993 1994 1995 1996 1997 1998 1999 2000 2001 2002 2003 2004 2005 2006 2007 2008 2009 2010
Figure 5: Share of teenagers who become single mothers, by age
Source: Own calculations based on the female mid-year population structure as contained in the demographic yearbooks 1985-2010 and on birth registers 1985-2010.
4. Discussion and conclusion
This study shows that, similarly to the non-marital birth ratio, the share of births to unpartnered women is very strongly and negatively linked to education. Between 1985 and 2010 the vast increase in the non-marital birth ratio was related to a rise in the share of children born to unmarried partnered women. The percentage of births to single women was stable at a level of 3%-5% throughout the analysed period.
The educational differences in the share of births to single mothers became larger over time, ranging from 2% to 5% in 1985 and from 1% to 22% in 2010. The percentages were stable in the two better-educated groups, but increased among the poorly educated (i.e., those with primary and basic vocational education), whose share in the population of mothers giving birth between 1985 and 2010 shrank from 53% to 24% (from 45% to 18% for first births).
0.0% 0.1% 0.2% 0.3% 0.4% 0.5% 0.6% 0.7%
1985 1986 1987 1988 1989 1990 1991 1992 1993 1994 1995 1996 1997 1998 1999 2000 2001 2002 2003 2004 2005 2006 2007 2008 2009 2010
As educational attainment rose and single mothers were still most numerous among the least educated, they became a much more selective group than they had been in the 1980s and 1990s. In 2010 half of them had primary education and two-thirds were younger than 25. The substantial increase in the share of births to singles in the least-educated group resulted from a growing percentage of teenagers among poorly educated single mothers: in 2010 it exceeded 60%, of which around 80% were younger than 18 and still in compulsory education when they became pregnant. Moreover, girls aged 15−17 were the only group in which the probability of single motherhood increased over time.
All in all, the vast increase in the non-marital birth ratio did not go along with a significant increase in the share of births to single mothers. However, single motherhood became more age- and education-specific in the course of time.
5. Acknowledgments
References
Baranowska, A. (2011). Premarital conceptions and their resolution. The decomposition of trends in rural and urban areas in Poland 1985-2009. Warsaw School of Economics: Institute of Statistics and Demography (Zeszyty Naukowe ISiD).
Bolesławski, L. (2001). Urodzenia pozamałżeńskie i małżeńskie w latach 1989−2000.
Wiadomości statystyczne 46(11): 25−36.
Brzozowska, Z. (2012). Non-marital conceptions and births: Educational differences in Poland 1985-2010. Barcelona: Universitat Autònoma de Barcelona.
CSO (1989). Demographic Yearbook 1989. Warszawa: Główny Urząd Statystyczny.
CSO (1996). Demographic Yearbook 1996. Warszawa: Główny Urząd Statystyczny. CSO (2003). Ludność. Stan i struktura demograficzno-społeczna, Narodowy Spis
Powszechny 2002 [electronic resource]. http://www.stat.gov.pl/gus/8195_PLK_ HTML.htm.
CSO (2013). Ludność. Stan i struktura demograficzno-społeczna, Narodowy Spis Powszechny 2011 [electronic resource]. http://stat.gov.pl/gus/5840_14076_ PLK_HTML.htm.
Eurostat (2013). Live births by mother’s age at last birthday and legal marital status [electronic resource]. http://epp.eurostat.ec.europa.eu/portal/page/portal/ statistics/search_database .
Kotowska, I.E., Jóźwiak, J., Matysiak, A., and Baranowska, A. (2008). Poland: Fertility decline as a response to profound societal and labour market changes?
Demographic Research 19(22): 795−854. doi:10.4054/DemRes.2008.19.22.
Sejm of the People’s Republic of Poland (1964). Kodeks rodzinny i opiekuńczy (Dz.U. 1964, nr 9, poz. 59) [electronic resource]. http://isap.sejm.gov.pl/ Download;jsessionid=1649E3CBD169BCDC413516A59442C20B?id=WDU19 640090059&type=3.
Štípková, M. (2013). Declining health disadvantage of non-marital children: Explanation of the trend in the Czech Republic 1990-2010. Demographic Research 29(25): 663−706. doi:10.4054/DemRes.2013.29.25.
Appendix
Table 1: Number of births included in the analyses, Poland 1985−2010, by education and age
By education By age
primary basic
vocational secondary tertiary below 20 20-24 25-29 30-34 35 and
above
1985 146,860 211,427 278,647 44,339 43,089 245,570 228,884 115,444 48,286
1986 132,670 202,469 262,481 40,805 40,851 228,338 210,888 109,753 48,595
1987 121,255 199,467 248,724 37,670 40,645 217,926 194,719 105,060 48,766
1988 114,316 197,828 242,134 37,702 41,393 210,810 185,728 104,772 49,277
1989 100,493 188,575 224,130 34,253 40,067 197,903 166,928 96,542 46,011
1990 97,868 195,999 217,347 33,380 44,375 198,980 159,108 94,122 48,009
1991 97,311 196,150 213,978 33,704 46,340 198,645 154,322 92,197 49,639
1992 91,368 184,004 201,508 32,037 43,380 186,397 145,023 85,207 48,910
1993 86,798 180,345 189,922 30,590 40,951 176,786 137,470 81,497 50,951
1994 82,011 172,537 182,358 30,875 38,389 167,803 132,289 77,877 51,423
1995 74,894 160,971 170,861 31,049 35,422 158,769 126,341 70,809 46,434
1996 69,945 154,907 165,989 33,713 33,360 153,666 125,055 68,235 44,238
1997 64,605 145,656 159,801 36,587 30,947 147,092 122,844 64,733 41,033
1998 58,756 137,015 154,138 40,057 30,106 138,411 121,788 62,014 37,647
1999 55,684 128,546 150,234 43,592 28,617 131,208 122,264 60,057 35,910
2000 53,111 122,625 149,747 49,674 27,672 126,660 126,147 60,361 34,317
2001 49,486 112,760 145,546 56,304 25,742 116,245 127,076 61,613 33,420
2002 45,174 103,606 138,587 62,250 24,018 105,798 125,795 61,985 32,021
2003 41,786 96,198 135,397 71,801 22,162 100,569 127,120 64,714 30,617
2004 40,043 90,724 136,262 83,254 20,190 97,058 131,229 70,356 31,450
2005 38,210 85,692 141,131 95,049 19,174 94,918 135,810 77,866 32,314
2006 38,480 79,451 143,586 108,422 19,142 92,791 138,364 85,662 33,980
2007 38,475 76,482 147,587 121,440 19,806 92,261 140,900 93,994 37,023
2008 39,328 74,354 154,865 139,138 21,035 92,927 149,476 103,406 40,841
2009 37,929 67,820 152,922 154,859 20,371 86,628 152,923 109,084 44,524
2010 35,548 61,159 146,193 166,684 18,406 79,374 151,721 112,091 47,992
Table 2: Share of single mothers estimated from birth registers (1985−2010) and the Polish GGS (1985−2008)
year birth
register GGS (weighted)
absolute difference
1985 0.03 0.03 0.00
1986 0.03 0.02 0.01
1987 0.03 0.02 0.01
1988 0.03 0.02 0.01
1989 0.03 0.01 0.02
1990 0.03 0.02 0.01
1991 0.03 0.02 0.01
1992 0.03 0.02 0.02
1993 0.03 0.02 0.01
1994 0.04 0.03 0.01
1995 0.04 0.02 0.02
1996 0.04 0.03 0.01
1997 0.04 0.06 0.02
1998 0.04 0.03 0.01
1999 0.04 0.04 0.00
2000 0.04 0.03 0.01
2001 0.05 0.06 0.01
2002 0.05 0.05 0.00
2003 0.05 0.06 0.02
2004 0.05 0.07 0.02
2005 0.05 0.04 0.01
2006 0.05 0.05 0.01
2007 0.05 0.07 0.02
2008 0.04 0.04 0.01
2009 0.04
Figure 6: Age composition of first-time mothers, Poland 1985−2010
Source: Own calculations based on birth registers 1985−2010.
Figure 7: Share of births to single women among all births, by age, Poland 1985−2010
Source: Own calculations based on birth registers 1985−2010. 0%
10% 20% 30% 40% 50% 60% 70% 80% 90% 100%
1985 1986 1987 1988 1989 1990 1991 1992 1993 1994 1995 1996 1997 1998 1999 2000 2001 2002 2003 2004 2005 2006 2007 2008 2009 2010
below 20 20-24 25-29 30-34 35 and more
0% 5% 10% 15% 20% 25% 30% 35%
Figure 8: Age composition of teenage single mothers, Poland 1985−2010
Source: Own calculations based on birth registers 1985−2010. 0%
10% 20% 30% 40% 50% 60% 70% 80% 90% 100%
1985 1986 1987 1988 1989 1990 1991 1992 1993 1994 1995 1996 1997 1998 1999 2000 2001 2002 2003 2004 2005 2006 2007 2008 2009 2010