University of New Orleans University of New Orleans
ScholarWorks@UNO
ScholarWorks@UNO
University of New Orleans Theses and
Dissertations Dissertations and Theses
5-20-2005
Late Quaternary Louisiana Shelf-Margin Deltaic Deposition,
Late Quaternary Louisiana Shelf-Margin Deltaic Deposition,
North-Central Gulf of Mexico
Central Gulf of Mexico
Casey Mobley
University of New Orleans
Follow this and additional works at: https://scholarworks.uno.edu/td
Recommended Citation Recommended Citation
Mobley, Casey, "Late Quaternary Louisiana Shelf-Margin Deltaic Deposition, North-Central Gulf of Mexico" (2005). University of New Orleans Theses and Dissertations. 237.
https://scholarworks.uno.edu/td/237
This Thesis is protected by copyright and/or related rights. It has been brought to you by ScholarWorks@UNO with permission from the rights-holder(s). You are free to use this Thesis in any way that is permitted by the copyright and related rights legislation that applies to your use. For other uses you need to obtain permission from the rights-holder(s) directly, unless additional rights are indicated by a Creative Commons license in the record and/or on the work itself.
LATE QUATERNARY LOUISIANA SHELF-MARGIN DELTAIC DEPOSITION, NORTH-CENTRAL GULF OF MEXICO
A Thesis
Submitted to the Graduate Faculty of the University of New Orleans
in partial fulfillment of the requirements for the degree of
Master of Science in
The Department of Geology and Geophysics
by
Casey Ryan Mobley
B.S. University of Kentucky, 2001
TABLE OF CONTENTS
List of Figures ... iv
List of Tables ... vi
Abstract ... vii
Introduction...1
Gulf of Mexico Geologic Framework and Processes ...2
Structural Elements...4
Faulting ...4
Diapirism...4
Late Quaternary Glaciation and Sea-level Fluctuation...8
Depositional Response to Sea-level Fluctuation...9
Regional History ...15
Texas Shelf...15
Eastern Texas Shelf...17
Central Louisiana Shelf-Mississippi Canyon...19
Mississippi-Alabama Shelf ...23
Louisiana Shelf ...25
Summary ...28
Methods...29
Data Sets ...29
Geotechnical Foundation Borehole Data ...29
High-resolution Seismic Profile Data ...32
West Delta 96 Lease Block Survey Report...34
Seismic Sequence Stratigraphy...37
Seismic Sequence Analysis...38
Seismic Facies Analysis...40
Internal Seismic Facies Reflection Patterns...42
External Seismic Facies Forms ...46
Analysis of Relative Change of Sea Level ...47
Arguments Against Seismic Sequence Stratigraphy...53
In Defense of Seismic Sequence Stratigraphy ...54
Results...56
Modern Bathymetry ...56
Structural Features ...56
Seismic Sequence Analysis...59
Horizons...60
Horizon A...60
Horizon B...61
Horizon C...68
Horizon D...68
Horizon E ...69
Seismic Facies Units ...69
Package 1 ...70
Package 2 ...70
Package 3 ...80
Package 4 ...80
Late Wisconsin Unconformity ...81
Summary ...85
Discussions ...87
Late Quaternary Shelf-Margin Delta ...87
Seismic Characteristics ...87
Depositional History ...89
Comparison to Regional Studies...92
Paleodrainage Patterns ...94
Pearl River Scenario ...98
Conclusions...101
References...102
LIST OF FIGURES
Figure 1: Physiographic map of Gulf of Mexico basin...3
Figure 2: Miss. River Canyon/ Mississippi Fan...5
Figure 3: Diagrammatic structural cross-section of northern GOM basin ...6
Figure 4: Structural features of onshore and offshore Louisiana...7
Figure 5: Sea-level change, glacial cycles, and oxygen isotope stages ...10
Figure 6: Late Pleistocene-Holocene sea-level curves ...11
Figure 7: Depositional systems response to eustatic flux ...12
Figure 8: Fluvio-deltaic depositional patterns during a cycle of sea-level change...13
Figure 9: Map of Holocene Miss. River deltaic plain and related features ...14
Figure 10: Shelf-margin deltas described by Suter and Berryhill (1985)...16
Figure 11: Basemap of northwestern GOM shelf-margin, Morton and Suter (1996) ...18
Figure 12: Diagrams of lowstand deltaic deposition models...20
Figure 13: Basemap of Mississippi Canyon, from Goodwin and Prior (1989) ...22
Figure 14: Basemaps used in Kindinger (1989b), Lagniappe delta...24
Figure 15: Basemap of Coleman and Roberts (1988a) dataset...26
Figure 16: Diagrammatical representation of MC 268 borehole ...30
Figure 17: Basemap of study area showing location of datasets ...33
Figure 18: Basemap of West Delta 96 lease block survey report ...35
Figure 19: West Delta 96 lease block survey report seismic profile ...36
Figure 20: Idealized depositional sequence ...39
Figure 21: Idealized seismic sequence...40
Figure 22: Seismic reflector patterns ...41
Figure 23: Oblique and sigmoid progradational reflection configurations...43
Figure 24: External forms of seismic facies units...47
Figure 25: Vail et al. (1977a) diagrams for relative sea-level rise...49
Figure 26: Vail et al. (1977a) diagrams for relative sea-level fall and stillstand...51
Figure 27: Vail et al. (1977a) depositional models...52
Figure 28:Bathymetric map of study area...57
Figure 29: Structural map of study area...58
Figure 30: Seismic profile of Acadiana 89 Line 19, updip direction ...62
Figure 31: Seismic profile of Acadiana 86 Lines 31-33, downdip direction...63
Figure 32: Seismic profile of Acadiana 89 Line 19, updip direction ...64
Figure 33: Seismic profile of Acadiana 89 Line 1, downdip direction ...65
Figure 34: Seismic profile of Acadiana 89 Line 21, downdip direction ...66
Figure 35: Seismic profile of Acadiana 89 Line 22, updip direction ...67
Figure 36: Time-structure map of Horizon A ...71
Figure 37: Time-structure map of Horizon B ...72
Figure 38: Time-structure map of Horizon C ...73
Figure 39: Time-structure map of Horizon D ...74
Figure 40: Time-structure map of Horizon E ...75
Figure 42: Isochron map of Package 2 ...77
Figure 43: Isochron map of Package 3 ...78
Figure 44: Isochron map of Package 4 ...79
Figure 45: Diagram illustrating the correlation of Horizon A with the LWU ...83
Figure 46: Map of relic channels observed in seismic data ...88
Figure 47: Paleogeographic map of late Pleistocene northern GOM shelf ...90
Figure 48: Map of northern GOM shelf paleodrainage networks...91
Figure 49: Map of late Pleistocene paleodrainage networks, LA shelf ...95
Figure 50: Cross-sections showing paleodrainage patterns ...96
LIST OF TABLES
ABSTRACT
This study focuses on establishing a depositional framework model for an area of
the Louisiana shelf, north-central Gulf of Mexico. The depositional history of the study
area is poorly understood, especially within the last cycle of major eustatic fluctuation
(~18,000 yrs BP to present). Data sets include pre-existing and previously unanalyzed
two-dimensional, high-resolution seismic profile records (Acadiana 86 and Acadiana 89),
geotechnical foundation boring data (Coleman and Roberts, 1988a), and an industry lease
block survey report (Cole, 1983). Seismic sequence stratigraphic methods are used in
this study to analyze seismic profile data.
Seismic sequence analysis results indicate the presence of five unconformable
surfaces and five seismic facies units. Correlation of seismic profile data with lithologic
and chronologic data indicates that these seismic facies units represent shelf-margin
deltaic deposits formed during the last sea-level lowstand (~18,000 yrs BP). The Pearl
INTRODUCTION
The northern Gulf of Mexico has been an area of focus for sedimentary geology
for more than a half century. Numerous studies conducted in the Gulf of Mexico basin
have resulted in an in-depth understanding of fluvial and deltaic response to changes in
sea level (Fisk, 1944; Kolb and Van Lopik, 1958; Frazier 1967; Frazier 1974; Suter and
Berryhill, 1985; Coleman and Roberts, 1988a; Kindinger, 1988; Penland et al., 1991;
Sydow and Roberts, 1994; Morton and Suter, 1996; Anderson et al., 2004; and many
others). A substantial body of this research has been focused on establishing a
depositional framework for deltaic sediments deposited on the northern Gulf of Mexico
shelf and shelf edge within the last cycle of major eustatic fluctuation (~18,000 yrs BP –
present).
The modern Mississippi River Deltaic Plain, located in southern Louisiana, has
been the focus of much of this work due to its well-preserved regressive stratigraphy as
well as to the effects of transgression due to relative sea-level rise on this regressive
package (Fisk, 1944; Frazier, 1974; Penland et al., 1991; Stanley et al., 1996). Similar
studies have been performed on other fluvio-deltaic systems along the northern Gulf of
Mexico shelf (most recently Anderson et al., 2004). However, many uncertainties
regarding both the timing and the nature of deposition persist for areas of the northern
Gulf of Mexico shelf and shelf-edge environments.
The primary objective of this study is to develop an understanding of the
stratigraphic framework of an area extending from the mid shelf and across the shelf edge
to the upper slope in the north-central Gulf of Mexico. The study area represents a
has not been previously studied in detail. Bathymetric maps of the Louisiana shelf edge
to upper slope in this area show large-scale lobate features similar in morphology to
submerged delta lobes deposited by the Mississippi River during the early Holocene (Fig.
X) (Maringoin lobe; Frazier, 1974). Genesis and timing of these submerged morphologic
features is unknown. Preliminary interest in these submerged features provided the basis
for this study.
Gulf of Mexico Geologic Framework and Processes
The Gulf of Mexico basin is in the western northern hemisphere; bounded by the
United States to the east, north and west, by Mexico to the west and south, and flanked by
Cuba to the southwest. It is elongate along a northeast-southwest axis, with restricted
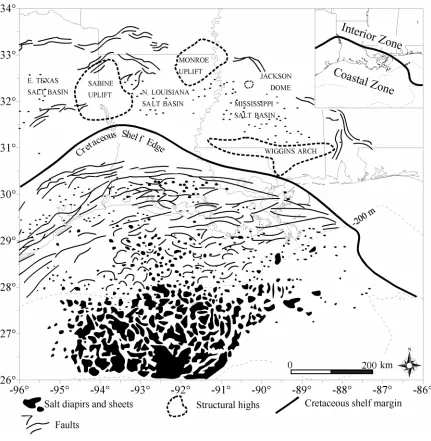
marine communication to the Atlantic Ocean along the southeast (Fig. 1). Major
physiographic provinces of the Gulf include shelf and slopes of East Mexico,
Texas-Louisiana, West Florida, and the Yucatan peninsula (Fig. 1). Physiographic regions of
particular interest to this study are the Louisiana Shelf and Mississippi Canyon
(sometimes referred to as the Mississippi Trough) (Fig. 2).
The Gulf of Mexico basin began forming in the Late Triassic with fragmentation
of the Pangean supercontinent (Salvador, 1991b). Rifting lasted until the Late Jurassic,
resulting in a large area of attenuated continental crust (transitional crust). Oceanic crust
(5-6 km thick) underlies the center of the basin, whereas thin transitional crust (8-15 km
thick) underlies much of the slope and shelf regions, and thick transitional crust (20-40
km thick) extends to the margins of the basin (Fig. 3) (Buffler and Thomas, 1994).
igure 1. Map of the Gulf of Mexico basin showing the primary physiographic provinces of the region and salient features discussed in the text. (Modified from Coleman et al., F
progradational depocenters overlie Late Triassic to Early Jurassic basement rocks (Fig.
3).
Structural Elements
Faulting
A common structural feature within the Cenozoic sedimentary package is the
existence of numerous, laterally continuous and typically down-to-the-south faults.
Locally, these faults indicate as much as 500 m of throw, with consequential thickening
of as much as several thousand meters in sedimentary units located on the downthrown
side (Lopez, 1990). These normal faults are common along the slope and shelf areas
(Fig. 3).
Diapirism
Upper Jurassic Louann salt is located stratigraphically below the Cenozoic
sedimentary packages (Fig 3). Deformation within the Louann salt has influenced
substantially the overlying stratigraphic framework (Ewing, 1991).
Sedimentary loading of the salt at depth has resulted in diapirism, a consequence
of density contrast between the salt and overlying compacted sedimentary units. This has
led to the piercement of overlying strata as salt is extruded upward to form diapers and in
some cases laterally to form large salt massifs (Nelson, 1991). The existence of many of
the diapirs is expressed in the modern bathymetry as local highs. They have directly
influenced depositional styles and thickness of some sedimentary units because of the
seafloor relief they created prior to, during, or after deposition (Suter and Berryhill, 1985;
Kindinger, 1988; Morton and Suter, 1996). Figure 4 shows the distribution of major salt
igure 2. Map of Gulf of Mexico basin showing the structural margins of the basin as efined by (Ewing, 1991). The Mississippi Canyon forms a large embayment along the
hs. F
d
continental margin that is indicated by the north to northwest indentations of the isobat Note the downdip relationship and location of the Mississippi Fan relative to the
Shelf Slope East Texas Salt Basin
THICK TRANSISTIONAL CRUST THIN TRANSITIONAL CRUST OCEANIC CRUST A A' 5 0 10 15 d ep th ( k m ) Pliocene Miocene Eocene
U. Jurassic U. C
retac eous Paleocene Oligo cene Eocene L. Cretaceous SALT SALT
U. Triassic - L. Jurassic
Pleis toce
ne
-86° -84° -82° -80° A'
A
Figure 3. Diagrammatic cross section of the northern Gulf of Mexico Basin. Upper Jurassic salt deposits and down-to-south movement of Cenozoic growth faults are
Late Quaternary Glaciation and Sea-level Fluctuation
Glacial cycles directly influenced changes in sea level throughout Quaternary
time (Chappell and Shackleton, 1986). Glacial and interglacial stages documented in
terrestrial domains correspond well with periods of sea-level lowstand and highstand
indicated by stratigraphic relationships and oxygen isotope data (16O to 18Oratios) (Fig.
5) (Chappell and Shackleton, 1986; Martinson et al., 1987).
Global-scale cycles of climatic cooling have resulted throughout the Cenozoic in
wide spread continental-scale glaciations. This process affects ocean waters in the
following ways: 1) a net loss of water from major ocean basins because of preferential
evaporation of 16O and storage of this isotope in snowfall when waxing ice sheets prevent
its return through glacial melting; 2) relative enrichment of ocean basins in the 18O
isotope as 16O -enriched water becomes stored in ice sheets; and 3) a decrease in
elevation of sea level as water is removed from the global ocean basins. During global
warming cycles, or interglacial stages, continental ice sheets melt thereby releasing large
volumes of 16O -enriched water into drainage basins that result in rapid rise in sea level
(Imbrie et al., 1984).
Four late Quaternary glacial stages have been identified on the North American
continent. In order of decreasing age they are the Illinoian, Sangamonian, Wisconsinan,
and Holocene. These glacial stages are correlated to six oxygen isotope stages (Fig. 5).
Oxygen isotope stages are determined on basis of the ratio between 16O to 18O(Chappell
and Shackleton, 1986). Of particular interest to this study is the Late Wisconsinan glacial
stage that took place approximately 22,000 - 18,000 yrs BP (Fig. 5). This glacial stage is
Holocene interglacial stage is responsible for the most recent transgression and current
highstand conditions (Fig. 5).
Many independent researchers have constructed sea-level curves for Late
Pleistocene-Holocene time (Curray, 1960; Ballard and Uchupi, 1970; Nelson and Bray,
1970; Frazier, 1974; Fairbanks, 1989; Penland et al., 1991; and, Tornqvist et al., 2004)
(Fig. 6). Several of these curves indicate sea level fell 90 to 160 meters (m) below
present elevation between 20,000 and 15,000 yrs BP, and then rose rapidly until
approximately 5,000 yrs BP when current highstand conditions were achieved. Except
for Fairbanks and Tornqvist et al., are all relative sea level (RSL) curves derived from
stratigraphic relationships. This study utilizes the lowstand timing of Fairbanks (1989),
which suggests that sea level was 120 +/-5 m below present elevation during the last
glacial maximum at approximately 18,000 yrs BP. This curve is based on
radiocarbon-dated coral reef samples collected from offshore Barbados. The timing and elevation of
this curve correlate well with results from a similar study performed in the Pacific Ocean
basin (Chappell and Shackleton, 1986).
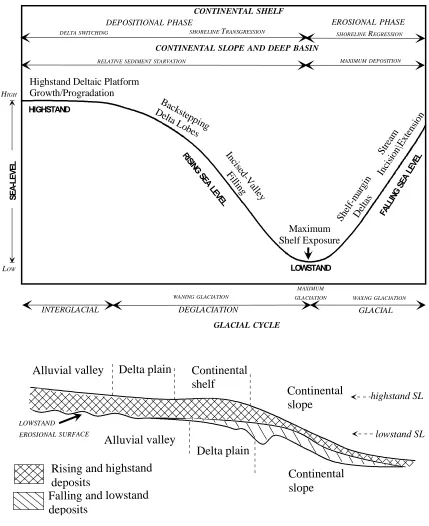
Depositional Response to Sea-level Fluctuation
Fluvio-deltaic systems are sensitive to glacio-eustatic changes (Fig. 7).
Depocenters shift geographic location as base level changes in response to
glacial-interglacial cycles. Significantly, depositional character and the resulting stratigraphic
relationships of fluvio-deltaic sedimentary packages also change as the location of
depocenters shift through time.
One response of fluvio-deltaic systems to eustatic fall is a basinward translation of
age (ka)
Holo-cene Sangamonian Illinoian
oxygen isotope stages
5 6 4 3 2 1 se a le v e l b e lo w pr e sen t (m ) δ
18 O
(n orm a li ze d)
0 20 40 60 80 100 120 140 160 180
100 120 80 60 40 20 0 140 Wisconsinan -1 +1 0 Late Wisconsinan lowstand Holocene transgression Late Quaternary
North American glacial stages
Figure 5. Late Quaternary North American glacial stages correlate well with oxygen isotope data to show patterns in sea-level fluctuation are linked to growth and decay of continental ice sheets (modified from Morton and Suter, 1996).
exposed as sea level falls creating an erosional surface classically referred to as a
lowstand unconformity (Fig. 8). Stream extension and incision may also occur across the
shelf as sea level falls and reaches lowstand. During maximum lowstand the greatest
amount of deposition takes place on the shelf-margin, continental slope, and in the deep
basin (Coleman et al., 1991) (Fig. 8). Large fluvio-deltaic systems such as the
Mississippi River produce incised alluvial valleys on the shelf that can be linked downdip
to an incised canyon on the shelf edge and large submarine fan on the basin floor
0
20
40
years B.P. (103) 60 80 100 120 140 160 20 15 10 5 0 el ev a ti o n b e lo w cu rr en t s ea l ev el ( m ) Fairbanks (1989) Curray (1960) Nelson and Bray (1970)
Frazier (1974)
Ballard and Uchupi (1970)
Figure 6. Chart showing the relationships of multiple sea-level curves for the last 20,000 years in the Gulf basin. Variations in the curves exist but overall the trends indicate that sea level fell to elevations of approximately 90 to 160 m below present sea level during the Late Wisconsin glacial maximum at approximately 18,000 to 15,000 yr BP.
CONTINENTAL SHELF
SHORELINE REGRESSION
Maximum Shelf Exposure Str eam Inci sion \Ext ensi on In cis ed -V alley Fillin g
Highstand Deltaic Platform Growth/Progradation
SHORELINE TRANSGRESSION
She lf-m argi n D elta s Backste pping Delta L
obes DELTA SWITCHING HIGHSTAND FALL ING SEA LEVE L RI SING SEA LEVE L LOWSTAND
CONTINENTAL SLOPE AND DEEP BASIN
DEPOSITIONAL PHASE EROSIONAL PHASE
MAXIMUM DEPOSITION RELATIVE SEDIMENT STARVATION
Falling and lowstand deposits
Rising and highstand deposits
Alluvial valley Delta plain Continental shelf Continental slope Alluvial valley Delta plain Continental slope LOWSTAND
EROSIONAL SURFACE
HIGH LOW SE A -L EV EL DEGLACIATION INTERGLACIAL GLACIAL WANING GLACIATION MAXIMUM
GLACIATION WAXNG GLACIATION
GLACIAL CYCLE
lowstand SL highstand SL
Deglaciation and subsequent rise in sea level result in a landward shift of
depocenters. This stage is marked by river valley aggradation and deposition of basal
transgressive facies directly on top of lowstand erosional surfaces (Coleman et al., 1991).
During sea-level rise fluvio-deltaic deposition decreases in slope and shelf-margin areas
as depocenters migrate backward, instead depositing retrogradational deltas on the shelf
(Fig. 7).
During interglacial sea level stabilizes and highstand conditions are achieved,
allowing for fluvio-deltaic platform growth and progradation. Delta switching occurs on
the continental shelf while the continental slope, whereas deep basins become relatively
starved of sediment (Fig. 8).
Regional History
This section summarizes the work of existing depositional framework studies that
examine late Quaternary fluvio-deltaic sedimentation on the northern Gulf of Mexico
shelf. Five selected studies are presented here, each analyzing a specific shelf-edge
segment or area along a west-to-east transect. The purpose of this section is to provide
the reader with an understanding of regional depositional architecture in order to more
fully establish a context for the results of this study.
Texas Shelf
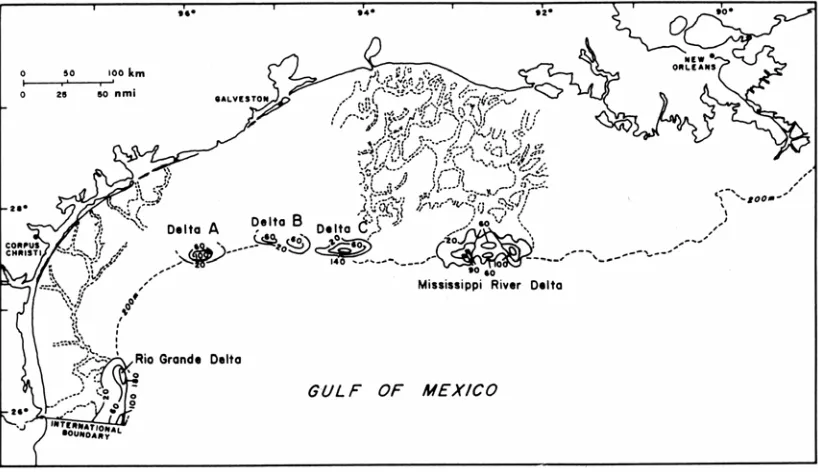
Suter and Berryhill (1985) examined 35,000 km of trackline of single-channel,
high-resolution, seismic reflection profile data collected from the Texas and Louisiana
shelf and upper continental slope. They identified five shelf-margin deltas: the Rio
Grande River delta, the Mississippi River delta, and three deltas labeled A, B, and C of
patterns connected to a well-developed network of ancient channels was the basis for
their determination that these sedimentary packages were fluvially derived. Age
determination for these sedimentary packages, based on stratigraphic relationships and
limited radiocarbon dates, ranges from 18,000 to 10,500 years BP. These dates suggest
deposition of these units occurred during the time of the Late Wisconsin glacial
maximum through Holocene transgression.
showing location of shelf-margin deltas identified by Suter and Berryhill (1985) and their associated paleodrainage networks. Contours indicate thickness of
shelf-The Rio Grand River delta, delta A, and delta B are similar in architecture. shelf-They
exhibit
ping Figure 10. Map
margin deltaic sediments (in meters).
a multilobate constructional framework. Locally, seismic reflection profiles
across these depocenters show features suggestive of syn- and post-depositional slum
indicated in cores suggest shoreline erosion took place during transgression of the
depocenters.
Delta C exhibits no multilobate architecture. Clinoform patterns show that a
ope,
Mississippi River delta is located on the
lta
three
uter (1996) analyzed an area of the eastern Texas outer shelf and diapirically formed basin controlled the style of deposition. Once this basin filled,
sediment bypass began and sedimentation took place directly onto the continental sl
forming a linked downslope submarine fan.
The late Wisconsin to early Holocene
southwest Louisiana shelf. It is multilobate and linked to a large channel complex. De
lobes fill diapirically controlled basins, and channel distribution patterns are controlled by
diapiric structures. Suter and Berryhill (1985) recognized this as the Mississippi River
delta due to the presence of the large channel complex linked to this delta and proximity
of the delta to a Pleistocene-age Mississippi River depocenter. Two submarine troughs
are recognized downslope of this delta. Based on stratigraphic relationships, these
troughs pre-date the Late Wisconsin lowstand and may have existed during the last
lowstands. These valleys served as conduits of mass-sediment transport.
Eastern Texas Shelf
Morton and S
upper slope (Fig 11). Data sets within their study included more than 100 foundation
borings and single channel, high-resolution sparker seismic profiles. Foundation
borehole depths exceed 90 m (295 ft) and provide lithologic information, such as
sediment composition, color, and textures. More than 2400 km of high-resolution
They identified three stacked deltaic sequences of Wisconsin age (120,000 yr BP
and younger). A more refined absolute-age determination is limited by the presence of
the Trimosina fault zone in the southern portion of the study area. Active faulting and
diapirism along this structural trend complicate establishing accurate chronostratigraphic
control. Sequence thickness, axial direction of major fluvial channels, and shelf-margin
delta lobe geometry for all three deltaic intervals is attributed to this fault zone.
On the basis of their observations, Morton and Suter (1996) suggested a new
model
lf-n Gulf of
.
the
t the
f-ver
helf - Mississippi Canyon
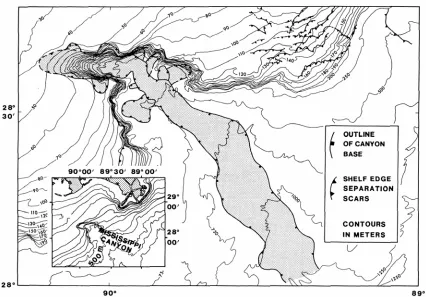
Goodwin and Prior (1989) investigated the most recent depositional history of
sediments filling the Mississippi Canyon (Fig. 13). They analyzed high-resolution for late Quaternary shelf-margin deltaic deposition, called the ‘Quaternary She
Margin Delta’ model, that has implications for the depositional framework of
sedimentary packages linked to small fluvial systems located along the norther
Mexico (Fig. 12). The standard shelf-margin depositional model (see Vail et al., 1977a)
requires that fluvial channels respond to falling sea level by extending their distributary
network basinward and incising the exposed shelf as sea level falls below the shelf break
This creates an incised valley complex that is cut into the relic shelf. Deltaic deposition
occurs on the outer shelf and upper continental slope as a prograding complex and is
linked downslope to a submarine fan. Morton and Suter (1996), however, found no
evidence of this pattern of deposition in their study area, instead the formation of
extensive fluvial channels were apparently coeval with their shelf-margin deltas.
Channels incised the delta complex, and in some examples incision was deep into
delta complex, but incision into the relic shelf was not observed. In their model deltaic
deposition occurs on the shelf margin only, with little transport of sediment to the
continental slope and no submarine fan formed. Morton and Suter (1996) state tha
Quaternary Shelf-Margin Delta model best describes the depositional framework of shel
margin deltas formed during most recent sea-level lowstands, whereas the Vail et al.
(1977a) model only applies to the very large, and therefore anomalous, Mississippi Ri
drainage system.
geophysical surveys that were acquired with 3.5-kHz subbottom profilers and m
penetration seismic reflection profilers. Two
geophysical surveys that were acquired with 3.5-kHz subbottom profilers and m
penetration seismic reflection profilers. Two borings, taken on the canyon axis and along
the canyon rim, provided lithological and paleontological control on un
profiles. Carbon-14 dating of selected samples within these cores allowed for age
determination.
They identified five seismic units: A, B, C, D, and E. Unit A is stratigraphically
located at the bottom of the canyon above a canyon-base unconformity. This
unconformity represents the oldest erosional event recorded in this data set; suggested to
be approximately 30,000 yr BP in age. Goodwin and Prior (1989) indi
could be older, but 30,000 yr BP was the oldest date that could be obtained using
radiocarbon dating methods. Seismically, Unit A is characterized by low am
discontinuous reflectors. A stratigraphically higher, second unconform
A from the overlying Unit B. Sediments above this unconformity were dated at 19,000
yr BP in age or younger. Unit B is expressed seismically as high am
laterally discontinuous reflectors. Overlying Unit B, Unit C shows chaotic internal
seismic reflectors. Radiocarbon dating of this unit indicates deposition took
to 15,000 yr BP. Unit D is the thickest unit (375 m) and overlies Unit C. This unit has a
chaotic internal seismic reflection character with some parallel reflectors ev
edium-its identified in
cate that this event
plitude,
ity separates Unit
plitude, parallel, but
place 19,000
ident. This
unit
clay drape that has a transparent seismic character.
Radiocarbon age data indicates the timing of deposition of this unit to be 7,500 yr BP to
present.
unit is dated to between 15,000 and 7,500 yr BP. The uppermost unit is Unit E. This
Figure 13. Bathymetric map of Mississippi Canyon area taken from Goodwin and Prior
are also provided.
(1989). Shaded area represents extent of canyon base; positions of shelf-margin faults
Using these data, Goodwin and Prior (1989) constructed the following
depositional history for the Mississippi Canyon. At approximately 30,000 yr BP, or prior
to this time, initial canyon incision began. The unconformity surface and stark age
contrast between Units A and B indicate that rapid deposition in the form of
down-canyon mudflows occurred along the down-canyon axis at this time, scouring and eroding older
sediments. A nearby lowstand delta, hypothesized as the Mississippi River delta, is
suggested as the source of the mudflows. Unit C and D are interpreted to be debris flows,
mudflows, and prodeltaic sediments deposited as canyon infilling progressed during
interbedded with debris flow sediments, contributing to a complex cut-and-fill
stratigraphy. By 7,500 yr BP, rising sea level forced a landward shift in the location of
the deltaic depocenter that resulted in a marked decrease in prodeltaic sediments
transported to the Mississippi Canyon. Most recent sedimentation is comprised of a
pelagic drape that has been deposited within the last 7,500 years.
Mississippi-Alabama Shelf
Kindinger (1988,1989b) researched the depositional framework of a previously
unstudied unit that he called the Lagniappe Delta on the outer Mississippi-Alabama shelf
east of the St. Bernard and Belize lobes of the Mississippi Deltaic Plain (Fig. 14). A total
of 3,200 trackline-km of high-resolution, single-channel seismic reflection profiles were
used by Kindinger (1988) to document the extent and geologic framework of the study
area.
e
e as an early Wisconsin lowstand erosional surface (~ 150,000 yrs
BP). Overlying this surface is a thin transgressive package correlated to the
mid-Wisconsinan highstand (128,000 – 75,000 yrs BP). An ensuing sea-level fall from
98,000 to 11,000 yrs BP initiated a basinward shift in fluvial-deltaic deposition. Three
stages of channel incision into shelf sediments indicate that sea-level fall was not
constant but instead occurred in a step-wise manner. The most recent sea-level fall was
the Late Wisconsin lowstand that produced a region-wide unconformable surface
(Horizon C). A thick package of sediments located on the shelf margin overlies this
unconformity. High-angle oblique, sigmoid, and complex sigmoid-oblique internal
reflectors are evidence that this package of sediments were deposited by a shelf-margin Kindinger identified a prominent shelf-wide unconformity (Horizon D) at the bas
Figure 14. Mosaic of maps showing the location of the Kindinger (1989b) study area, seismic trackline positions, and the extent of the Lagniappe delta on the Mississip Alabama shelf margin.
delta. The complex sigmoid-oblique reflectors suggest a fluvially dominated delta that
may have undergone delta switching resulting in multiple depositional lobes. Thic
of the deltaic package was controlled by diapirs located on the shelf margin that
prevented farther basinward deltaic progradation; resulting in deposition shoreward
delta front.
A thin transgressive package is located updip of the shelf-margin deltaic pack
and is stratigraphically younger than those sediments, although it does not directly overlie
pi-kness
of the
age
er
e
m
iver (Kindinger et al., 1994; Fillon et al., 2004; Roberts et al., 2004).
tervals on the Louisiana shelf. Their data set consisted of 471 offshore geotechnical
the depositional record of the shelf during a 240,000-yr period. Normal
deltaic
5,000 yrs BP). An erosional unconformity (Horizon D) overlies and obscures the western
extent of these deltaic sediments. This unconformity resulted from sediment reworking
accompanying the progradation of the St. Bernard lobe of the modern Mississippi Riv
delta complex (7,000 yrs BP to present). A hiatal surface overlies the St. Bernard lob
depositional package.
A large channel complex is associated with these deltaic sediments (Kindinger
1989b). Kindinger (1989b) did not identify a direct fluvial source but suggested the Pearl
and/or Mobil Rivers as possible progenitors. Later studies performed by Roberts et al.
(1991) and Sydow et al. (1992) showed the Lagniappe delta linked to a larger delta
complex that covers a broad portion of the Alabama shelf. This
Mississippi-Alabama delta complex has since been linked to the Mobil River incised-valley syste
that includes the Mobile and Tombigbee rivers, and may also include the Pascagoula
R
Louisiana Shelf
Coleman and Roberts (1988a, 1988b) documented the cyclic sedimentary
in
foundation borings and several hundred thousand kilometers of high-resolution seismic
data provided by the hydrocarbon industry (Fig. 15). Cores depths exceed 90 m (295 ft)
depth and were semicontinuously sampled.
Summarizing their results, they recognized three complete sea level cycles
recorded in
depositional cyclicity combined with sea-level cyclicity during this interval to
Figure 15. Basemap taken from Coleman and Roberts (1988a) showing location of offshore geotechnical boreholes.
Deltaic sedimentary patterns correlate to specific eustatic conditions (lowstand
through highstand). Highstand conditions produce sedimentary packages characterized
roperties: 1) they are thin, slowly accumulated deposits defined as
and
hic markers that are laterally continuous over
as
; 3)
y produce a wide
variety of acoustic response. Expanded sections are deposited during lowstand by the following p
condensed sections; 2) they are calcareous-rich deposits that include hemipelagics
shell hashes; 3) they possess wide lateral continuity; and 4) they produce a
high-amplitude acoustic response. Condensed sections are deposited during periods of rising
to highstand sea level. They are easily recognized by specific sedimentological features
as well as provide excellent chronostratigrap
large areas. Lowstand conditions produce sedimentary sequences that exhibit the
following properties: 1) they are variably thick, rapidly accumulated deposits defined
expanded sections; 2) they are coarse-grained clastics, rich in sand and gravel deposits
conditions. They are thick deposits but, in contrast to condensed sections, are limited in
areal extent and are not good chronostratigraphic markers.
Coleman and Roberts (1988a) found that sedimentation rates during lowstand
conditions were 3 to 15 times higher than sedimentation rates during rising to highstand
conditions. The exception to this trend is the fluvially dominated modern Mississippi
River delta complex.
Seismic data indicate well-defined, high-amplitude, laterally continuous reflectors
correlate well with sedimentary units that were deposited during sea-level highstand.
These reflectors immediately overlie erosional unconformity surfaces. Erosional
are
ell defined in seismic records. Variable amplitude, discontinuous reflectors seismically
charact
ular
ll
ds
ctively unconformity surfaces are interpreted as sequence boundaries (Vail et al., 1977) and
w
erize lowstand depositional packages. Moreover, these packages often display
scour bases and are thicker than highstand deposits.
Coleman and Roberts (1988a) generally found poor correlation between partic
lithofacies identified in cores and a specific acoustic response. Two lithofacies, thin she
beds and laminated sands, did correlate well to an acoustic response; thin shell be
(condensed sections) correlate well with continuous parallel, doublet reflectors. Three
reflector types characterize laminated sands: 1) parallel continuous reflectors; 2)
discontinuous low-amplitude reflectors; and 3) discontinuous high-amplitude reflectors.
All other lithofacies produced acoustic responses that were too variable to use effe
Summary
In summary, a generalized late Quaternary shelf-margin deltaic framework model
tion of both; regionally extensive erosional unconformity surface
ormed
e of for the northern Gulf of Mexico includes: steeply angled clinoform sets of oblique,
sigmoid, and/or complex sigmoid-oblique internal reflectors; channels incised into the
underlying shelf sediments; structural control on style of deposition by faulting, salt
diapirism, or a combina
f during a fall of relative sea level; thick deltaic packages located on the shelf edge;
landward shift of onlapping seismic reflector packages that indicate backstepping of
deltaic deposition; transgressive facies overlying deltaic packages; and a thin drap
hemipelagics overlying the transgressive facies. These fundamental features characterize
METHODS
of
s
ludes
lithofacies type, chronologic data (oxygen isotope and radiocarbon age data), water
depth, sample identification, and gamma-ray logs for a limited number of cores.
Boreholes were semicontinuously sampled but nonetheless provide critically important
information for lithologic and chronostratigraphic control. The upper 20 m of each
borehole was continuous sampled using a Shelby push core. Boreholes were
noncontinuously sampled at intervals of two to five meters from 20 m below the seafloor
to the bottom of the borehole.
Sediment samples are categorized into one of five lithofacies types based on gross
lithology. Lithofacies types are: gravel, sand, silt, clay, and carbonate. Lithofacies are
determined on percent abundance of sediment and are not homogeneous. A high degree
of compositional variability exists in each lithofacies across the sampled area. Sand
lithofacies contain mostly sand with zones of interbedded silts and clays. Silt lithofacies The purpose of this section is to define and describe data sets and methodology
used in this study. This study incorporates multiple data sets derived from a variety
sources. They are as follows: published, geotechnical foundation borehole data taken
from Coleman and Roberts (1988a); two-dimensional, high-resolution seismic profile
from research cruises Acadiana 86 and Acadiana 89; and a Conoco, Inc. lease block
engineering survey report from West Delta 96 (Cole, 1983).
Data Sets
Geotechnical foundation borehole data
Offshore geotechnical foundation borehole data from Coleman and Roberts
le MC 268 (reproduced from Coleman and Roberts, 1988a).
include alternating thin sand, silt, and clay beds. Clay lithofacies possess highly
ins. Shell
n and Roberts,
chronostratigraphic control. Oxygen isotope analysis measures the ratio of 16O to 18Oin
lanktonic foraminifera preserved within sediment samples, which can then be correlated
glacio-eustatic cycles. This allows for organization of the sedimentary record into odd
Boundary Duration
Stage (yrs BP) (yrs)
1 12,500
1/2 12,500
2 11,500
2/3 24,000
3 35,000
3/4 59,000
4 12,000
4/5 71,000
5 57,000
5/6 128,000
6 58,000
6/7 186,000
7 59,000
7/8 245,000
bioturbated clays, thin silt, fine sand laminations, and scattered shell rema
hashes, microfauna-rich hemipelagic clays, and diagenetic carbonate-rich clays are found
in the carbonate lithofacies.
Table 1. Chart showing oxygen isotope stages, stage boundaries, and duration. Stage column lists oxygen isotope stages in descending order from youngest (stage 1) to oldest (stage 7). Stage boundaries are represented as number combinations that list the younger stage first followed by the older stage (e.g., 1/2) (modified from Colema
1988a).
Oxygen isotope analysis and radiocarbon dating of five boreholes located on the
outer shelf and upper continental slope of Louisiana were used to establish
p
to
condensed sections and times of sea-level rise or highstand. Even numbered stag
represent deposition during falling or low sea level. Radiocarbon dating techniques
supplant oxygen isotope analysis to provide chronostratigraphic control on most recent
sedimentation (Late Wiscons
es
in and Holocene). Seismic and lithostratigraphic
ited sample set
(Colem
(250 mi) of
two-dime two pre-existing data sets,
Acadiana 86 /V
Acadiana (LUMCON) and operated out of
the LUMCON f quisition took place as part
of a United States Geo rvey (LGS)
c data used herein are
E Geopulse boomer instrumentation (500-Hz to 5-kHz filters). Sweep times
f
cross the
n correlations allow for confidence in chronologies presented by a lim
an and Roberts, 1988a).
High-resolution seismic profile data
This study incorporates approximately 400 line-kilometers
nsional, high-resolution seismic profiles compiled from
and Acadiana 89 (Fig 17). Data were acquired on the research vessel R
, owned by the Louisiana Marine Consortium
acility located in Cocodrie, Louisiana. Data ac
logical Survey (USGS)/Louisiana Geological Su
cooperative research effort during the 1980’s. Portions of seismi
previously unexamined.
Acadiana 86 seismic profiles are high-resolution, single-channel records gathered
sing OR u
vary from one-eighth to one-quarter second; fire times range from one-quarter to one-hal
second in length. This study focuses on Lines 31-33, which were recorded a
axis of the Mississippi Canyon and Louisiana shelf margin.
Acadiana 89 seismic data are high-resolution, two-channel profiles recorded using
ORE 3.5-kHz Subbottom profiler and ORE Geopulse boomer instrumentation.
# # # # # # # # # # # # # # # # # # # # # # # # # # # # # # # # # # # # # # # # # # # # # GI63 GI90 GI48 GI40 GI52 GI47 GI42 GI45 GI32 W D69WD70 WD40 WD71 W D31
W D44W D45 W D29 W D22 W D60 W D23 WD58 WD85 SP78SP77 SP57 SP76 SP39 SP56 SP75 SP55 SP27 SP83 SP54 SP45 SP23 SP37 SP46 SP52 SP47 MC268 MC357 W D109 MC280 MC148 EB305?
10 0 10 20 Kilo m eters
28°30' ' ' 29°00 N E W S 29°00' 28°30' 90°00' 89°30' 89°30 90°00' N E W S 10 0 20 Kilometers 29°00' 28°30'
length. Boomer data are recorded using 300 to 5000-Hz filters with a one-quarter second
eep time and variable fire time (one-quarter to one-half second).
A two-way travel time of 1500 meters per second (m/sec) is used in time-depth
conversions for both seismic data sets. This value is commonly used for shallow seismic
stratigraphic analysis (Suter and Berryhill, 1985; Coleman and Roberts, 1988a, 1988b;
Kindinger, 1988; Goodwin and Prior, 1989; Kindinger, 1989b; and others).
West Delta 96 lease block survey report
A multi-sensor engineering survey of the West Delta 96 lease block was used in
this study for lithologic and seismic control (Cole, 1983). This report is the product of an
engineering survey contracted to Racal-Decca Survey, Inc. by Conoco, Inc in February
1983. A variety of remote sensing equipment were used to gather data for this report,
including a 3.5-kHz subbottom profiler, a 4.2-kilojoule Sparker system, a towed-array
side scan sonar, a precision echosounder, and a marine proton magnetometer. Data
gathering took place from the M/V Pacific Seal. Approximately 84 line-kilometers of
survey data were obtained in the West Delta 96 lease block area (Fig 18). Shotpoint
intervals were set at 500 feet. A two-way travel time of 1524 m/sec was used in
time-depth conversions for this data set. Lithologic data integrated into this report are from a
borehole located 1220 m east of the eastern-most boundary line of the West Delta 96
lease block.
Line 4 of the subbottom profiler records will be used in this study. Raw and
interpreted portions of the Line 4 profile are included in the lease block survey report
Figure 18. Bas locations of sh
emap from Conoco, Inc. West Delta 96 lease block survey report showing otpoints used to collect seismic profile and side-scan sonar data (modified rom C
f ole, 1983).
Grand Isle Area West Delta Area
Scale (ft) 0
1000 5000
N
Wipe-out Zone - Gassy Sediments
Firm Clay
Seafloor
Sandy Clays Silty Clays
Soft Clay With Shell
Two-way Travel Time (in msec)
25
50
25
50 Depth below
sea level (m)
Depth below sea level (m)
37.5
75 37.5
75
Fig. 19. Raw and interpreted seismic profile from Conoco, Inc. lease block survey of West Delta 96, Line 4. Seismic interpretations and sedimentological correlations made by Thomas Neurauter , Racal-Decca Survey, Inc. (modified from Cole, 1983).
Neurauter of Racal-Decca Survey, Inc. This study will focus on the interpreted portion of
Line 4 and lithologic correlations shown.
Seismic Sequence Stratigraphy
This study uses the Exxon seismic sequence stratigraphic methodology (‘Vail
methodology’) pioneered by P. R. Vail and associates at the Exxon Production Research
Company in the 1970’s (Mitchum et al., 1977a; Mitchum et al., 1977b; Vail and
Mitchum, 1977; Vail et al., 1977a; Vail et al., 1977b). Drawing upon the principles of
sequence stratigraphy presented in the seminal work of L.L. Sloss (1963), seismic
stratigraphy is a ‘geologic approach to the stratigraphic interpretation of seismic data’
(Vail and Mitchum, 1977). This methodology uses reflection patterns in seismic data to
interpret stratal surfaces and unconformities in the rock record. Seismic data is
considered to be a “record of the chronostratigraphic (time-stratigraphic) depositional and
structural patterns”, making chronostratigraphic correlations and postdepositional
structural deformation analysis possible (Vail and Mitchum, 1977). One limiting factor
to this methodology is that no direct determination of lithofacies can be made from
seismic profile data alone (Vail and Mitchum, 1977). Because seismic reflectors are
considered expressions of stratal surfaces, the terms stratum and reflector will be used
interchangeably in the following discussions.
Seismic stratigraphy allows for several types of stratigraphic interpretations on the
basis of seismic reflection geometry and correlation patterns. These interpretations are as
follows: relative geologic time correlations, identification and mapping of depositional
units, thickness and depositional environment of depositional units, paleobathymetry,
history when combined with other types of geologic data such as information provided by
cores.
Seismic sequence stra ocedure. The three steps
ive
defined
y
s
identified on the basis of lateral reflection
rmina
tigraphy involves a three-step pr
are as follows: seismic sequence analysis, seismic facies analysis, and analysis of relat
changes in sea level.
Seismic sequence analysis
Seismic sequence analysis involves identifying depositional sequences on a
seismic profile (Mitchum et al., 1977a). A depositional sequence is defined as
“stratigraphic units composed of a relatively conformable succession of genetically
related strata” (Vail and Mitchum, 1977). Depositional sequences are bounded by
unconformities or their correlative conformities (Fig. 20). A seismic sequence is
as a “relatively conformable succession of reflections on a seismic section...bounded at
its top and base by surfaces of discontinuity marked by reflection terminations”
(Mitchum et al., 1977b). In seismic sequences, the conformable succession of geneticall
related reflectors is generally interpreted as genetically related strata; likewise, the
reflection terminations that mark bounding discontinuity surfaces in seismic sequence
are interpreted as the unconformity surfaces bounding depositional sequences (Mitchum
et al., 1977b) (Fig. 21). Seismic sequences are
te tions, which are categorized using the following terminology: baselap, which is
subdivided into onlap and downlap; toplap; and truncation (Vail and Mitchum, 1977)
(Fig. 22).
Baselap is defined as lapout at the lower boundary of a depositional sequence.
et al., 1977a). Onlap is a form of baselap in which initially horizontal reflectors terminate
on an initially inclined surface, or initially inclined reflectors terminate updip on a surface
atuses (Mitchum et al., 1977a).
rough episodes
al of greater initial inclination (Mitchum et al., 1977a) (Fig. 22). Downlap is the downdip
equivalent of onlap (Fig. 22). Onlap and downlap indicate nondepositional hiatuses
rather than erosional hi
Figure 20. Diagram showing a generalized depositional sequence (numbers 11 th 19) bounded by unconformities and correlative conformities. Numbers indicate
of deposition and are labeled in order of oldest to youngest (from Mitchum et al., 1977a).
Toplap is the termination of reflectors at the upper boundary of a deposition
sequence (Mitchum et al., 1977a) (Fig. 22). In the updip direction, the spacing between
lateral terminations may narrow and approach the upper boundary asymptotically.
Toplap is an indicator of nondepositional hiatus, usually with the implication that
depositional base level was too low to allow for updip deposition and may indicate that
Figure 21. Diagrammatical illustration of an idealized seismic sequence shows
faulting, gravity sliding, diapirism, or igneous intrusion. It is most easily recognized
when the structure cross-cuts strata.
Seismic facies analysis
lves
describing the internal reflection properties of a seismic sequence, such as geometry,
continuity, amplitude, frequency, and interval velocity, as well as external form and
overall organization of seismic facies units within a depositional sequence framework
(Mitchum et al., 1977b). A seismic facies unit is a three-dimensional, mappable group of
rs that differ in seismic character from those adjacent to it (Mitchum et al.,
1977b). Determination of these characteristics allows for interpretation of depositional relationships of internal seismic reflectors with upper and lower bounding surfaces (from Mitchum et al., 1977b).
There are two types of truncation: erosional truncation and structural truncation.
Erosional truncation is the lateral termination of reflectors by erosion (Mitchum et al.,
1977a) (Fig. 22). Erosional truncation occurs at the upper boundary of a depositional
sequence. This type of truncation varies in extent; it may cover large areas, such as a
subaerially exposed surface, or be confined to small features, such as channels (Mitchum
et al., 1977a). Structural truncation is defined as the lateral termination of a stratum by
“structural disruption” (Mitchum et al., 1977a). This type of truncation may be a result of
Following identification of seismic sequences, seismic facies analysis invo
Figure 22. Seismic reflector patterns used to identify and describe seismic sequences. Part A. Types of top-discordant and base-discordant seismic reflector terminations. Par B. Simple varieties of internal seismic facies reflection patterns. Part C. Complex varieties of internal seismic facies reflection patterns, called prograding reflection configurations (from Mitchum et al., 1977a, b).
t
Shingled Oblique
Hummocky Clinoforms Complex Sigmoid-Oblique Sigmoid
Tangential
Parallel
A. Upper Boundary
Lower Boundary
Erosional Truncation Toplap Concordant
Concordant Downlap
Onlap
C. B.
Parallel Subparallel
Divergent
Even
processes, hence environmental settings, that were active at time of deposition. This
inform
Mitchum
Interna
Seism ic
le to complex.
Simp
More comp
sigm Other patterns of
et al., 1977b).
rates of
(Fig. 22). D
accomp ic facies unit
(Mitchum ility in depositional
rate or tiltin
x reflection
patterns, and lex sigmoid-oblique,
shingled, and humm
ation can then be used to predict the lithology of the seismic facies (Vail and
, 1977).
l seismic facies reflection patterns
ic facies analysis interpretations are developed on the basis of seism
reflection patterns. These patterns vary in complexity ranging from simp
le varieties include even and wavy parallel reflectors, subparallel, and divergent.
lex patterns are referred to as prograded reflection patterns, and include
oid, oblique, complex sigmoid-oblique, shingled, and hummocky.
interest include chaotic and reflection-free configurations (Mitchum
Parallel and subparallel reflector configurations suggest uniform
deposition in a stable basin or across a uniformly subsiding shelf (Mitchum et al., 1977b)
ivergent reflectors are wedge-shaped and exhibit lateral thickening
anied by thickening of individual reflection couplets within the seism
et al., 1977b) (Fig. 22). This pattern suggests lateral variab
g of the depositional surface.
Prograded reflection configurations often exhibit more comple
include the following varieties: sigmoid, oblique, comp
ocky (Fig. 22). These are interpreted as strata deposited during
periods of progradation or lateral outbuilding (Mitchum et al., 1977b). The term
clinoform, borrowed from Rich (1951), describes a gently sloping surface formed
clinoform patterns characterize the prograded reflection configurations of seismic faci
units.
es
sets. Oblique progradational reflection
configurations suggest high-energy sedimentary regimes on the basis of topset truncation along a
A sigmoid progradational configuration is a prograded clinoform pattern typified
by stacked, offset, lens-shaped segments of sigmoid (s-shaped) reflectors (Mitchum et al,
reflectors are horizontal. Reflectors in the middle of segments dip at shallow angles,
downlap or appear to downlap at very low angles onto the basal bounding surface Figure 23. Illustration of oblique and sigmoid progradational reflection configurations. Sigmoid progradational reflection configurations imply low-energy sedimentary regimes due to preservation and aggradation in top
relatively flat-lying surface (from Sangree and Widmier, 1977).
1977b) (Figs. 22, 23). Segments thin in the updip direction, becoming concordant, and
(Mitchum et al., 1977b). The updip reflection pattern suggests aggradation occurs
concomitant with progradation. Preservation of the updip reflector configuration implies
low sedime d/or rapid sea-level rise took place within
a relatively low-energy sedim et al., 1977b) (Fig. 23).
ed of a prograded clinoform pattern of
relatively steep-dipping reflectors term at or nearly flat
surface, and terminate do ismic facies unit
boundary (Mitchum patterns indicate
lateral outbuilding ssively younger strata from a
constant upper surface ch ination (Mitchum et al.,
1977b). Steep depositional dips (approxim ly 10 degrees) are associated with this
progradational pattern. T tangential oblique
and parallel oblique. Tangentia erns are characterized by a
decrease in dip of the lower portion of the foreset strata, concave-upward stratal
ic
rogradational
patterns are characterized by steeply dipping parallel foresets that downlap onto the lower
facies unit boundary at high angles (Mitchum et al., 1977b) (Fig. 22). The oblique
progradational pattern suggests high sediment supply conditions in a relatively stable or
slowly subsiding basin during sea-level stillstand; this is interpreted as a high-energy
depositional regime (Mitchum et al., 1977b). nt supply, rapid basin subsidence, an
entary regime (Mitchum
Oblique progradational patterns are compos
inating updip by toplap at a fl
wndip by downlap against the basal se
et al., 1977b) (Figs. 22, 23). Clinoform stacking
in the downdip direction by succe
aracterized by abrupt toplap term
ate
wo subtypes of oblique progradation exist:
l oblique progradational patt
orientations in the middle of the clinoform sets, and gently dipping bottomset strata,
which terminate in tangential downlap or apparent downlap against the lower seism
Variable, alternating sigmoid and oblique progradational configurations with
the same seismic facies unit characterize the prograded clinoform pattern of a complex
sigmoid-oblique progradational pattern (Mitchum et al., 1977b) (Fig. 22). An alternating
pattern of horizontal sigmoid reflections in combination with topset termination
in
s found in
et al.,
et
) (Fig.
f
ns
on pattern is interpreted to form as small,
interfingering clinoform lobes prograde into shallow water (Mitchum et al., 1977b). oblique progradational topset typifies the topset segment of this progradational pattern.
This suggests a depositional history marked by alternating aggradation and sediment
bypass in the topset segment within a high-energy sedimentary regime (Mitchum
1977b). This configuration shows reflector termination by toplap internally, rather than
at the upper seismic facies unit boundary, suggesting the presence of depositional
sequences on a scale smaller than seismic resolution. These smaller depositional
sequences are interpreted as discrete lobes of a prograded depositional unit (Mitchum
al., 1977b).
Shingled progradational reflection configurations are typically thin prograded
seismic patterns with parallel upper and lower boundaries (Mitchum et al., 1977b
22). Gently dipping parallel oblique reflectors characterize the internal organization o
these configurations. Reflectors terminate by toplap and downlap. These configuratio
are interpreted as forming in shallow water, prograded depositional settings (Mitchum et
al., 1977b).
Hummocky clinoform reflection configuration is an apparently random;
hummocky pattern recognized by irregular, discontinuous subparallel reflectors and
characterized by reflection terminations and splits that are nonsystematic in nature
Chaotic reflection patterns are made of discontinuous and discordant reflectors,
suggesting a variable, high-energy depositional environment or heavily deformed strata
(Mitchum et al., 1977b). These are commonly associated with cut-and-fill channel
complexes, penecontemporaneous slump structures, and zones of folding and/or faulting.
Reflection-free intervals are geologic units that do not express seismic reflection
patterns. Large igneous masses, salt bodies, or thick seismically homogeneous shales
sandstones produce these reflection-free areas (Mitchum et al., 1977b).
External seismic facies forms
Three-dimensional external forms characterize seismic facies units as well
internal reflection patterns. These external forms include sheets, wedges, banks, le
mounds, and fills. Sheet, wedges, and banks are most commonly associated with
shelf-edge seismic f
or
as their
nses,
acies units (Mitchum et al., 1977b) (Fig. 24). Sheet drapes exhibit parallel
urrounding area are known as mounds. These features are generally
hat fill in
trata
ternal reflection patterns generally interpreted as strata deposited uniformly over underlying
topography in a low-energy depositional environment (deep marine) (Mitchum et al.,
1977b) (Fig. 24). Lenses are associated with a variety of seismic facies but are most
commonly interpreted as the external form of prograded clinoform seismic facies units
(Mitchum et al., 1977b) (Fig. 24). Reflection configurations that appear to rise above the
level of the s
restricted in areal extent, and identified by onlap or downlap of overlying strata t
around the mounds (Mitchum et al., 1977b) (Fig. 24). Fill reflection patterns define s
that in-fill negative-relief features, such as channels or basins. External form and in
reflection patterns can be used in the identification of fill patterns (Mitchum et al., 1977b)
Figure 24. Diagrammatical representation of types of external forms used to describe seismic facies units (from Mitchum et al., 1977b).
Analysis of relative change of sea level
Once the reflection patterns have been identified seismic sequence analysis
of relative change in sea level on a regional scale for purposes of comparison with global
relative sea-level data (Vail and Mitchum, 1977). Depositional limits of onlap and to
of seismic reflectors are the basis for determining cyclicity of relative change in sea level
(Vail et al., 1977a). Relative change is sea level is defined as “an apparent rise or fall of
sea level with respect to the land surface” as a result of eustatic (global) fluctuation, th
land surface changing elevation (e.g., tectonism), or a combination of these factors (Vail
et al., 1977a). Relative sea-level rise is defined as “an apparent sea-level rise with respect
to the underlying initial depositional surface and is indicated by coastal onlap”, where
coastal onlap defines the “progressive landward onlap of littoral and/or nonmarine coastal
deposits” (Vail et al., 1977a). Conversely, relative sea-level fall is defined as an
“apparent fall of sea level with respect to the underlying initial depositional surface,
indicated by a downward shift of coastal onlap” (Vail et al., 1977a). Relative stillstand of
sea level is “an apparently constant position of sea level with respect to the underlying
initial surface of deposition”, indicated in this case by coastal toplap. This results from
sea level and the underlying surface of initial deposition remaining at a constant
elevation, or if sea level and the initial depositional surface rise or fall at the same rate
(Vail et al., 1977a).
Changes in relative sea level influence the architecture of coastal deposits.
plap
e
ig. 25). Coastal onlap is observed
e position, if the rate of sea-level rise Relative sea-level rise may result in transgression, regression, or a stationary shoreline
depending upon the magnitude of sediment supply (F
during transgression, a landward shift in shorelin
exceeds sediment supply (Vail et al., 1977a) (Fig. 25). Regression, or the basinward shift
Figure 25. Diagram illustrating styles of deposition possible during relative rise of sea
rise; this marks a period of progradational outbuilding of sedimentary facies (Vail et al.,
ent
l (Vail
a
igh
ents
deposition occurring directly on the continental slope in the form of a submarine fan
se in sea
vel near the depositional source. Another type of onlap, marine onlap, may be 1977a) (Fig. 25). A stationary shoreline setting is achieved when the rate of supply of
sediment matches the rate of sea-level rise, resulting in aggradation of depositional
sequences (Vail et al., 1977a) (Fig. 25).
Relative sea-level stillstand produces prograding depositional sequences
characterized by toplap of the seismic reflector topsets. Toplap is a product of sedim
bypass as sediment is transported laterally to the position of depositional base leve
et al., 1977a) (Fig. 26).
A relative sea-level fall produces a basinward shift in coastal onlap. During
rapid fall of relative sea level sediment bypass takes place on the shelf and coastal onlap
becomes restricted to the apex of a lowstand fan on the basin margin (Vail et al., 1977a)
(Fig. 26).
Vail et al. (1977a) present idealized depositional models based on depositional
sequence patterns formed in response to sea-level highstand and lowstand (Fig. 27a, b).
In the highstand model deposition takes place in the form of clinoform lobes prograding
across a shallow shelf; progradation proceeds into deeper water if sediment supply is h
(Vail et al., 1977a) (Fig. 27a). This model indicates transport of fine-grained sedim
to the toes of clinoforms and deposition of coarse clastic sediments on the shelf. The
lowstand model, based on the assumption that sea level falls below the shelf edge,
indicates subaerial exposure and sediment bypass taking place on the shelf, and
(Vail et al., 1977a) (Fig. 27b). Coastal onlap takes place during the ensuing ri
Figure 26. Upper two diagrams are diagrammatical representations of deposition during
lowstand in sea level results in either basinward outbuilding of progradational
sediment input). Lower diagram is an illustration of clinoform geometries formed d
deposition during this time (modified from Vail et al., 1977a).
relative fall to lowstand of sea level. Sediment input in combination with relative fall or
depositional sequences (high sediment input) or erosional truncation of topsets (low uring a stillstand in relative sea level. Coastal toplap and sediment bypass characterize
Relative Fall In Sea Level