O R I G I N A L A R T I C L E
Open Access
Labour mobility and labour market
adjustment in the EU
Alfonso Arpaia
1*, Aron Kiss
1, Balazs Palvolgyi
1and Alessandro Turrini
2* Correspondence:
1Directorate General for
Employment, Social Affairs and Inclusion, European Commission, Brussels, Belgium
Full list of author information is available at the end of the article
Abstract
This paper assesses the role of labour mobility in the adjustment to asymmetric economic shocks in the EU. After presenting a series of stylised facts of mobility in the EU, it assesses mobility as a channel of economic adjustment by means of a vector autoregression (VAR) analysis in the vein of Blanchard and Katz (BPEA 1:1–75, 1992). Results indicate that, over the period 1970–2013, mobility absorbed about a quarter of an asymmetric shock within 1 year. Movements in response to shocks have almost doubled since the introduction of the euro. In contrast to previous papers on the labour market adjustment in the EU, the response of wages is integrated to the analysis. It is found that real wages have also become more responsive to asymmetric shocks.
JEL Classification:J61, J64
Keywords:Labour mobility, Geographic mobility, Migration, Adjustment, Asymmetric shocks, Optimal currency areas, European Union
1 Introduction
Labour mobility1received attention in the early debate on the Economic and Monetary Union (EMU). It was stressed that the reduced room for absorbing asymmetric shocks via macroeconomic policy tools in a monetary union required a sufficient degree of labour mobility as an alternative adjustment channel. Empirical analysis revealed that, as compared with other monetary unions, notably the USA, EU countries participating in the EMU did not exhibit a comparable degree of mobility and mobility played a minor role in the process of adjustment (Blanchard and Katz 1992; Decressin and Fatás 1995). Several years have passed since the outburst of the financial crisis, and there is growing attention to the potential contribution of labour mobility to counteract the divergence in growth and unemployment among EU countries and particularly within the euro area.
The financial crisis and the ensuing current account and debt crises in the euro area acted as persistent macroeconomic shocks with asymmetric effects, radically changing the economic landscape of the euro area. The convergence in income per capita observed during the first decade of EMU was to a large extent reversed. Countries in the euro area periphery witnessed capital flight, a protracted contraction in domestic demand amid deleveraging and a marked deterioration in their public finances. The rebalancing process involving adjustment in relative costs and prices between net debtor and net creditor members of the euro area is necessary for a durable reduction of external macroeconomic imbalances and the narrowing of unemployment
divergences. Such a process, however, can be long-lasting and marked by considerable distress in the countries enduring competitive internal devaluation and high and protracted unemployment. Against this background, labour mobility would help ease adjustment: it would permit a more moderate reaction of activity rates, and part of the divergence in unemployment rates would be absorbed by mobility rather than real wages.
The paper starts out by assessing main stylised facts and trends of mobility in the EU. Cross-country mobility flows in the EU appear to remain considerably lower as compared with those recorded in other highly integrated areas, most notably the USA, and well below mobility within countries. Moreover, the majority of the population of migrants in most EU Member States is from outside the EU rather than from other EU countries. Nevertheless, cross-EU mobility is on an upward trend and not only due to the enlargement of the EU to Eastern European countries with high outward migra-tion rates.
The main part of the analysis focuses on identifying the dynamic response of labour mobility to labour demand shocks that affect some countries only (asymmetric shocks). To that purpose, a vector autoregression (VAR) model in the spirit of Blanchard and Katz (1992) is estimated for a panel of EU countries. The aim is to assess simultaneously the co-movement of unemployment, labour market participation and labour mobility in response to shocks to labour demand.
As compared with recent analyses (e.g. Dao et al. 2014; Beyer and Smets 2015), the focus is on mobility across countries rather than across regions. This is for two reasons. First, it keeps the analysis close to the type of adjustment that matters in response to country-specific shocks. Second, it permits to explore the behaviour of real wages in re-sponse to asymmetric shocks, as this is a key variable to allow the adjustment of rela-tive unemployment rates. Compared with previous studies taking a cross-country perspective (e.g. L’Angevin 2007a, b), the availability of longer time series makes it pos-sible to examine if the contribution of labour mobility to labour market adjustment for the typical country has changed over time, most notably after the 2008–2009 crisis.
Results indicate that labour mobility absorbs about 25 % of asymmetric shocks after 1 year and about 50 % at peak, after about 5 years. It is also shown that the response of mobility, as well as that of real wages, has increased after monetary unification. At peak, the response of mobility for the post-unification period is about twice as large as that for the pre-EMU period.
Second, the paper focuses on labour mobility within the EU. However, due to data availability, it is in some cases hard to disentangle whether mobility takes place fully within the EU or also involving third countries. In particular, the VAR analysis cannot distinguish between flows within the EU and with third countries. Such a distinction, although relevant from the perspective of the smooth working of the monetary union, is seldom pursued in similar analyses, partly because of the lack of sufficient data, but also because what is relevant from the viewpoint of the adjustment for the single country is the response of labour mobility to shocks, irrespective whether mobility flows take place with another member of the monetary union.
The paper is organised as follows. Section 2 reviews the case for labour mobility as an economic adjustment channel in a monetary union. Section 3 presents a number of stylised facts of mobility in the EU to serve as context for the main analysis, in Section 4, which assesses the dynamic response of labour mobility to country-specific economic shocks. Section 5 concludes.
2 Labour mobility as an adjustment channel in a monetary union
In a monetary union, asymmetric economic shocks (i.e. shocks affecting some members but not others) are expected to initially cause differences in unemployment and activity rates, which are absorbed over time via the adjustment of real wages and via geo-graphical mobility. In a country hit by a positive labour demand shock, workers are initially drawn from the unemployment pool and more inactive workers start entering the labour force. Over time, real wages rise and, if the shock persists, the labour force starts growing also thanks to the inflow of workers from other geographical locations. Similar dynamics play out in the opposite direction in case of a negative shock.
Since the onset of the monetary union, labour mobility within the EU attracted atten-tion in the academic and policy debate. In the early debate on EMU, it was stressed that the relatively low degree of labour mobility among EU countries would be a weakness of the forthcoming monetary union. The loss of exchange rate flexibility and an inde-pendent monetary policy would require alternative channels of adjustment in the presence of asymmetric shocks. In the absence of an independent monetary policy, countries hit by persistent negative shocks would face high unemployment for pro-tracted periods, with high economic and social costs, unless there is a sufficient degree of flexibility in real wages or a sufficiently mobile labour force. These were seen among the conditions for the EMU countries to be part of an “optimal currency area”.2
The low degree of labour mobility across EU countries as compared with US states can be linked to language and cultural differences, largely heterogeneous policy con-texts, notably concerning the labour market and fiscal and social welfare policies. Some reasons underlying reduced labour mobility within Europe were considered to be linked to persisting legal and administrative barriers to the single market ensuing notably from limited portability of welfare rights, recognition of qualifications and access to regulated professions. Despite being a relevant adjustment channel, there are limits to what labour mobility can achieve in terms of shock absorption and there are costs that need not be neglected.
unemployment differences due to the rigidity of real wages. In such a context, labour mobility is likely to result in lower overall unemployment and relatively limited impact on the rest of the population in both the source and the destination country. On the other hand, it is well known that, under fully flexible wages, migration is likely to bring aggregate gains but with redistribution in the short term in favour of source country workers and against destination country workers, which see their earnings reduced in light of an increased supply of labour (e.g. Borjas 1999). Moreover, migration may not be necessary in case of short-lived, temporary shocks, as national automatic stabilisers could be sufficient to deal with temporary unemployment.
It should also be added that the effects of labour mobility go beyond those con-sidered in standard, simplified, static models of international economics. In particu-lar, from the viewpoint of the source country, the migration of skilled labour and
the consequent phenomenon of brain drain may lower TFP and income growth
rates (Commander et al. 2004). Moreover, in the presence of large differences in tax and welfare policies across countries, migration could entail additional redistri-bution effects via the public budget, and the implications of government debt for future generations could be exacerbated by large-scale outward migration.
Finally, there is ample evidence showing that individual perceptions and attitudes towards migration tend to be more negative than justified on the basis of economic outcomes only, which constitutes an additional limit to what labour mobility can achieve by itself as a channel of adjustment to asymmetric shocks (e.g. Mayda 2006).
3 Labour mobility in the EU: stylised facts
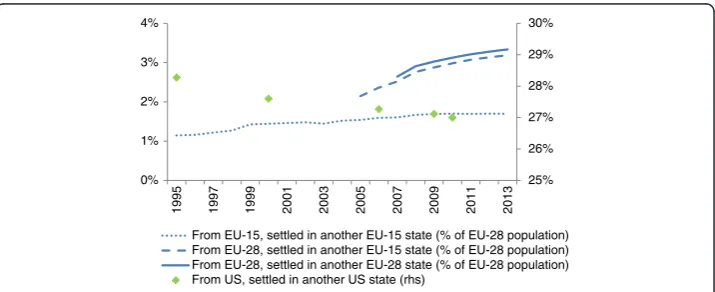
The statistical analysis in Section 4 is motivated by four stylised facts. First, as noted by many observers, mobility across EU Member States remains lower as compared to other world regions, most notably the USA (OECD 2012). In 2013, less than 5 % of working-age EU citizens lived in a different EU country than where they were born (Fig. 1). In the USA, as a comparison, about 30 % of the working-age population lives in a state different from their state of birth.3
Second, mobility across the EU has been increasing over the past two decades, as measured by the share of EU population born in a different EU country (also documented
25% 26% 27% 28% 29% 30%
0% 1% 2% 3% 4%
1995 1997 1999 2001 2003 2005 2007 2009 2011 2013
From EU-15, settled in another EU-15 state (% of EU-28 population) From EU-28, settled in another EU-15 state (% of EU-28 population) From EU-28, settled in another EU-28 state (% of EU-28 population) From US, settled in another US state (rhs)
in Fig. 1). The increase is particularly evident when looking at data for the post-enlargement EU. Mobility rates are higher across the enlarged EU and have been on an upward trend since the mid-2000s. This is mostly the result of large and growing flows from countries of new accession, notably Eastern European countries. However, growing mobility is not only from East to West. Mobility among countries that were members of the EU before the 2004 enlargement also exhibits a positive, albeit moderate, trend over the past two decades.4Conversely, over the same period, mobility within the USA appears to be on a downward trend, although from a higher level (Molloy et al. 2011; 2014).
Third, while migration from outside the EU was more significant than intra-EU mo-bility in the past, the two are of comparable weight in recent years. This has two conse-quences for the present analysis. First, it provides another indication to the effect that the significance of intra-EU mobility has increased in recent years. Second, it is a re-minder that adjustment through labour mobility may happen via the movement of third-country nationals (or via the slowing of immigration from third countries).
The share of intra-EU migrants in the working-age population is about half of the share of migrants born outside the EU (Fig. 2).5Within-EU labour mobility appears somewhat higher if cross-border workers are taken into account: there are about 1.1 million EU citi-zens who work in another EU country (0.3 % of the working-age population) but do not reside there. In addition, there are about 1.2 million posted workers (0.4 %), who were working for their home companies in another Member State for a limited period of time.
Recent developments in the share of foreign-born population show great differences across countries (Fig. 3).6In general, the weight of intra-EU mobility is higher in recent migration flows than in the stock of migrants, which suggests that the relative weight of intra-EU migration is increasing among all migration flows (compare Figs. 2 and 3).
Fourth, and finally, a first glance at net migration flows suggests that these are closely related to economic developments.7Inward migration flows were generally stronger in “old”Member States both before and after the crisis, but some changes took place with the crisis. The countries where the stock of migrants grew most before the crisis in-cluded countries on the euro area periphery like Ireland and Spain. In light of the crisis, in these same countries, inflows adjusted downward to a large extent, while the stock of foreign-born population fell substantially in the Baltic countries.
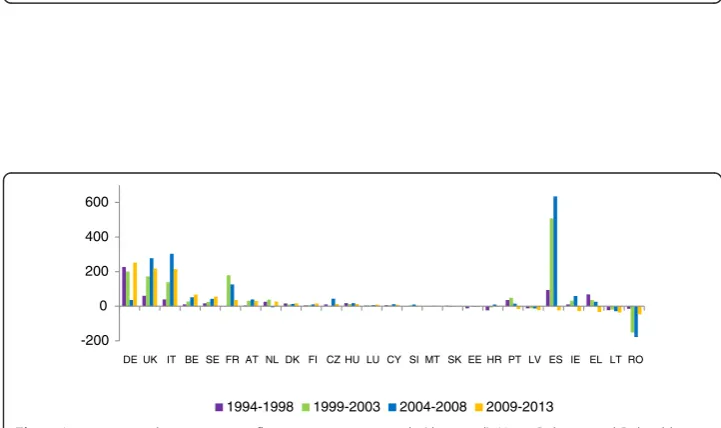
Net migration flows in absolute terms (i.e. number of people rather than expressed as a share of population) are shown in Fig. 4. Not surprisingly, the biggest flows in absolute
0% 5% 10% 15% 20% 25%
CY IE SE AT BE DE ES UK NL IT FR DK EE LV HR SI EL PT MT FI LT CZ HU SK BG PL RO EU
Born in another EU-28 country Born outside the EU-28
a: 2005-2008
b: 2008-2013 -2% -1% 0% 1% 2% 3% 4% 5% 6%
LU SE CY IT BE UK DK FI IE MT AT SI PT FR CZ DE HU GR BG RO PL ES SK NL HR LT EE LV
Ch
an
g
e
, 2005-2008
Born outside the EU-28
Born in another EU-28 country
-3% -2% -1% 0% 1% 2% 3% 4% 5% 6% 7%
LU SE CY IT BE UK DK FI IE MT AT SI PT FR CZ DE HU GR BG RO PL ES SK NL HR LT EE LV
Ch
an
g
e, 2008-2013
Born outside the EU-28
Born in another EU-28 country
Fig. 3Change in the share of working-age population born abroad, pre-crisis (panela) and during the crisis period (panelb): contribution of migrants from the EU and from third countries. Note: For Bulgaria, Germany and Ireland, 2006 instead of 2005. For Germany, the value is for all foreigners, and no breakdown is available. Countries are ranked according to changes in 2008–2013. Source: own calculations, based on a Eurostat special extraction from LFS
-200 0 200 400 600
DE UK IT BE SE FR AT NL DK FI CZ HU LU CY SI MT SK EE HR PT LV ES IE EL LT RO
1994-1998 1999-2003 2004-2008 2009-2013
terms are observed in most populous Member States. The graph also confirms that net migration flows varied greatly through time in a number of Member States. In a number of EU countries such as the UK, Italy and Spain, net inward flows grew since the 1990s, peaked at the mid-2000s and fell after the crisis. Net migration flows turned from positive to nega-tive after the financial crisis in countries severely hit by current account and debt crises, such as Spain, Greece, Ireland and Portugal. In a number of Eastern EU countries, notably Romania and the Baltics, net migration flows were generally negative since the mid-1990s.
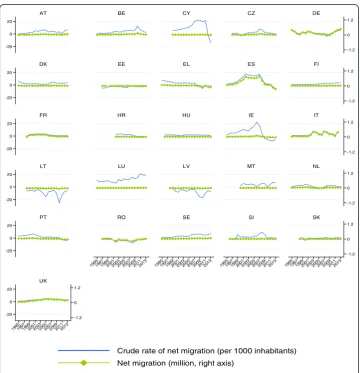
Figure 5 provides a detailed time profile of absolute and relative annual net migration by destination country. The graph confirms that countries that were greatly affected by current account reversals and debt crises (e.g. Spain, Cyprus, Ireland) saw a rapid reduction in net migration. It is also visible that this did not happen in a parallel fashion in all affected coun-tries: the decrease occurred more rapidly in Ireland than in Spain, and it occurred in Cyprus only after 2011, reflecting broader economic developments. Net migration was negative be-fore the crisis in Latvia and Lithuania; it fell further and considerably in the first years of the crisis and rebounded in the latest years.
-1.2 0 1.2
-1.2 0 1.2
-1.2 0 1.2
-1.2 0 1.2
-1.2 0 1.2
-1.2 0 1.2 -20
0 20
-20 0 20
-20 0 20
-20 0 20
-20 0 20
-20 0 20
1995199719992001200320052007200920112013 1995199719992001200320052007200920112013 199 5 19971999200
1
200320052007200920112013 19951997199920012003200520072009201 1 2013
1995199719992001200320052007200920112013
AT BE CY CZ DE
DK EE EL ES FI
FR HR HU IE IT
LT LU LV MT NL
PT RO SE SI SK
UK
Crude rate of net migration (per 1000 inhabitants)
Net migration (million, right axis)
This paper analyses the relationship between migration flows and labour market developments. While a caveat is in order in the sense that not all migration is related to labour market reasons, indirect evidence suggests that the link is close: most of migrants tend to be in prime working age, and their level of labour market integration is comparable to the population born in the country.8
4 Cross-country labour mobility and adjustment: a general framework
4.1 Point of departure and previous findings
With limited data on labour mobility, the standard approach in the literature is to follow the methodology by Blanchard and Katz (1992). Blanchard and Katz (1992) depart from the observation that changes in relative employment levels across US states persist over time, while relative unemployment and activity rates are stationary variables (i.e. shocks to these variables fade away after some time). The main idea is that if asymmetric shocks have permanent effect on employment but not on unemployment and activity rates, the change in employment levels must be absorbed by changes in the working-age population. Assuming that labour demand shocks do not influence demographic trends, the response of relative population must reflect the response of labour mobility.
Blanchard and Katz (1992) find that, in a typical US state, a 1 % transitory negative labour demand shock raises the unemployment rate by 0.32 percentage points above the national average in the first year and lowers the activity rate by 0.17 percentage points. The effects on the unemployment and activity rates disappear after 5 to 7 years; those on relative employment gradually build up, peaking at −2 % after 4 years. This pattern implies a substantial role of inter-state mobility in the first years following the shock.
Subsequent analysis applied the same framework to other geographical areas. Table 1 summarises empirical findings of these studies. In each line of the table, it is reported how
Table 1Decomposition of the response of labour market variables after 1 year to an asymmetric
labour demand shock
Unemployment Participation Mobility
Euro area (12 Member States 1973–2005) (1) 33 44 23
EU (51 regions 1975–1987) (2) 21 74 4
EU (47 regions 1977–2011) (3) 30 40 31
EU (NUTS1 regions 1998–2009) (4) 16 60 24
USA (51 States 1978–1990) (5) 32 17 51
USA (51 States 1958–1990) (2) 18 29 52
USA (51 States 1976–1995) (6) 24 43 33
USA (51 States 1976–2005) (1) 22 34 44
USA (51 States 1977–2011) (3) 14 43 43
USA (51 States 1977–2009) (4) 22 24 54
Spain (1976–1994) (7) 36 23 41
Italy (1969–1995) (6) 23 56 22
Germany (1970–1993) (6) 28 61 11
UK (1969–1994) (6) 11 85 4
Canada (1976–1996) (6) 46 43 11
much of the initial labour demand shock is absorbed after 1 year by changes of the unemployment rate, the activity rate and labour mobility, as estimated by the various studies.
Decressin and Fatás (1995) apply the Blanchard-Katz framework to investigate re-gional labour mobility in the EU and compare the results to those obtained for the US states. Their sample covers the period 1975–1987 and comprises regions for France, Germany, Italy, the UK and Spain; Belgium, Denmark, Ireland, Greece, the Netherlands and Portugal are taken as single regions. They find that the labour market adjustment in the EU is characterised by a muted response of labour mobility as compared with the USA, while the response of activity rates appear stronger. In Europe, it takes about 4 years for the effect on the activity rate and unemployment rate to disappear. In the USA, net inter-state mobility accounts within the first year for 52 % of the change in the relative employment and after 3 years for 70 %. In Europe, it is only after the third year that mobility accounts for a proportion similar to that reached in the USA after only 1 year.
Bentolila and Jimeno (1998) analyse the response of the typical Spanish region to a labour demand shock and find that for the period 1976–1994, unemployment bears a significant fraction of the adjustment, accounting for about one third of the change in employment after 3 years.
Dao et al. (2014) reassess the adjustment of the US states extending the Blanchard and Katz sample to 20 additional years. Compared to Blanchard and Katz, they find that the role of participation and unemployment has increased, while the contribution of inter-state mobility has decreased. Applying the methodology to European regions, they find that the short-term response of labour mobility has increased over time.
Beyer and Smets (2015) reconsider the comparison between the US and European labour market adjustments made by Decressin and Fatás. In particular, they assess separately the adjustment to region-specific shocks, to common shocks with asym-metric effects and to national shocks. They find that a significant difference between the EU and the USA can be found only in the response of mobility to common shocks with asymmetric effects. In contrast, the mobility response to region-specific shocks plays a relatively minor role both for the EU and the USA and appears to fall over time. Finally, inter-country mobility in response to country-specific shocks is less important than the inter-regional mobility in response to region-specific shocks.
Most studies on the EU focus on regional labour market adjustment. Only few have looked at the role of labour mobility for national labour market dynamics. In a study on the euro area covering the period 1970–2005, L’Angevin (2007b) finds that inter-state mobility plays a minor role in euro area countries and that, compared to the USA, it takes more time for unemployment and participation to return to a long-run equilib-rium after the shock.9Yet, restricting the sample to the period 1990–2005, the euro area labour market responds similarly to that of the USA, with a larger contribution of labour mobility in the medium term.
4.2 Specification of the VAR framework
be thought of producing a given bundle of products. This makes asymmetric economic shocks possible, that is, shifts in external demand that affect some countries but not others. The labour demand relation in countryiand yeartcan be expressed as
wi;t¼−dni;tþzi;t; ð1Þ
wherewi,trepresents the wage rate,ni,temployment andzi,tlabour demand. Coefficient dis positive reflecting a negatively sloping demand for a country’s products.
All variables are in logarithms to allow a simple linear formulation. More importantly, all variables are expressed as relative to the (weighted) average of the countries in the sample. This removes trends that are common to all countries and allows the focus on asymmetric (rather than common) shocks.
Relative labour demand depends on relative wages and country-specific characteristics xdthat affect firms’locational decisions and do not change over time (i.e. are a source of permanent differences in employment levels):
zi;tþ1−zi;t ¼−awi;tþxdiþεdi;tþ1; ð2Þ
where εd
i;t is a country-specific labour demand shock. Changes in the labour supply are driven by the relative wage differential, local labour market conditions (the unemploy-ment rateu) and other country-specific characteristicsxsthat affect workers’locational preferences:
nsi;tþ1−nsi;t ¼bwi;t−gui;tþxsiþεis;tþ1; ð3Þ
where εsi;t is a country-specific labour supply shock. The relationship between wages and unemployment is
wi;t¼−cui;t: ð4Þ
The model is closed with the unemployment defined as the difference between labour supply and labour demand:
ui;t¼nsi;t−ni;t: ð5Þ
In the long run, relative employment growth and relative unemployment are deter-mined by the following equations:
Δni¼
caxsiþðcbþgÞxdi
caþd cbð þgÞ ð6Þ
ui¼− wi
c ¼
dxsi−xdi
caþd cbð þgÞ ð7Þ
Employment growth is determined by country-specific factorsxdiand xsi. In countries more attractive to companies, the inflow of firms leads to higher wages and lower un-employment, which stimulates the arrival of workers that allow for employment growth to be permanently higher. In countries more attractive to individuals, the inflow of workers pushes wages down and unemployment up. Labour and firm mobility ensures that the effect of labour demand shocks on relative wages, unemployment and partici-pation rates are transitory.
relative unemployment.10If one country is hit by a negative asymmetric demand shock, wages and employment decrease. Lower wages and higher unemployment leads to net out-migration of workers, which mitigates the unemployment and wage effects; lower wages also attract firms, sustaining job creation and wages. The overall effect depends on the elasticity of relative labour demand and relative labour supply.
A VAR model can be estimated to investigate the response of employment, un-employment and participation rate to an asymmetric labour demand shock, i.e. all variables are expressed as deviations from the respective EU averages. The fact that asymmetric shocks have a permanent effect on employment levels but not on un-employment and participation rates has two consequences. First, the change in employ-ment levels must occur through labour mobility. Second, the VAR should be estimated with the relative employment in first differences and the employment rate (defined in this methodology as 1−unemployment rate) and the activity rate in levels.
The following VAR can thus be estimated:
vit¼AþA1ð ÞLvit−1þfiþεt; ð8Þ
wherevitis the vector (Δnit,leit,lpit);Δnitis the first difference of the logarithm of em-ployment in country iminus the logarithm of aggregate employment in the EU; leitis the logarithm of the employment rate (1−unemployment rate) in country iminus the logarithm of the employment rate (1−unemployment rate) in the EU; and lpit is the logarithm of the participation rate in countryiminus the logarithm of the participation rate in the EU. A key identifying hypothesis of the Blanchard and Katz (1992) frame-work is that innovations to the employment growth equation are exogenous labour demand shocks. This is a reasonable hypothesis when the correlation between un-employment rates and un-employment growth is negative, while this correlation is positive if growth derives mostly from labour supply. A panel regression of unemployment rate on employment growth gives a significant slope of (–0.56), implying that the hypothesis that innovations to employment growth mostly represent demand shocks is valid also for the EU sample.
The hypothesis that innovations to the employment growth represent labour de-mand shocks is implemented through orthogonalised (i.e. uncorrelated) shocks. Since the variance-covariance matrix of the estimated errors εt is unlikely to be diagonal (i.e. errors in the equation are likely to be correlated), the residuals of the equations have to be decomposed in such a way that they become orthogonal. The Cholesky de-composition represents the standard way to do this. In practice, it consists in ordering the variables in the VAR so that shocks to the variables that come earlier affect the following variables contemporaneously, while those that came after affect the previous variables only with a lag. In particular, it is assumed that labour demand shocks affect the unemployment rate and the participation rate contemporaneously, with a delayed feedback on employment growth. This implies that changes in the relative employment growth within the year reflect country-specific labour demand shocks. Supply-side shock effects are assumed to operate through uncorrelated shocks to the employment rate or the participation rate.
effects are eliminated expressing variables as deviation from their country-specific means. Thus, a panel VAR of order 2 (i.e. two lags for each variable) is estimated with OLS pooling the EU countries after having demeaned the variables to remove country fixed effects.
The availability of data on wages at the national level allows to explore how much of a labour demand shock is absorbed by changes in relative real wages. The inclusion of wages in some specifications allows for a better identification of the labour demand shock, where their response should be positive, from labour supply shock, where their response should be negative. In the identification of the shocks, real wages are assumed to respond contemporaneously to labour demand shocks and to affect contemporaneously the labour supply through changes in the employment or in the activity rate.11
Finally, note that, as is standard practice in the literature (e.g. Blanchard and Katz 1992; Obstfeld and Peri 1998; Dao et al. 2014), net migration flows are determined through the arithmetic linking of (changes in) population with (changes in) em-ployment, unemployment and active population. If P is the working-age population, L is the labour force and N is employment, then this arithmetic can be expressed as P=N+ (L−N) + (P−L) =N+ (1−e)L+ (1−p)P, where e is the employment rate (defined here as 1−unemployment rate) and p is the participation rate. From this, it follows that the relationship between the growth rates (percentage changes) of these variables (approximately equal to the change of a variable in logs) is linear: dlogP= dlogN−dloge−dlogp.
It is a plausible assumption that the responses of the working-age population to labour demand shocks are driven by geographical mobility, but additional empirical arguments can be found. Indeed, the correlation between employment growth and the series “crude rate of net migration and statistical adjustment” is 0.42 in the EU-15 for the 1980–2014 period and 0.54 for the period after 1998. Correlation remains high and significant even when the series are detrended.
4.3 Labour market adjustment: descriptive analysis
Before exploring the contribution of labour mobility to labour market adjustment, it is useful to review some stylised facts on the dynamics of employment, unemployment and labour market participation across EU countries.
The analysis is conducted on an annual panel database that includes the 15 members of the EU before enlargement for the period 1970–2013. Data are taken from the Annual Macro-economic (AMECO) database of the European Commission’s DG ECFIN. Employ-ment and compensation per employee are from national accounts, unemployEmploy-ment and the activity rate from the Labour Force Survey; compensation per employee is deflated with the GDP deflator.12
growth along the vertical axis. The visual inspection of the data reveals diversity across countries, but few stylised facts stand out.
Supporting the methodological validity of the Blanchard-Katz approach, relative em-ployment growth and relative changes in the activity and unemem-ployment rates tend to oscillate around constant averages.
For some countries (e.g. Austria, Germany and Ireland until the crisis), national de-velopments diverge only temporarily from the EU average, which is suggestive of the importance of common shocks.
The recessions that followed the two oil shocks of the early 1970s had only a temporary effect on employment growth in several countries. This contrasts markedly with the per-sistent effects of the financial crises that hit Sweden and Finland in the early 1990s or with the effects of the 2008 financial crisis in Greece, Portugal and Spain. For these countries, shocks to employment growth had more persistent effects on unemployment, consistent with the evidence presented by Calvo et al. (2012) that labour market adjustment is sluggish particularly in recessions induced by disruptions of the credit channel.13
Fluctuations in employment growth relative to the EU average are matched by changes in either the activity or the unemployment rate or both. For example, fluctua-tions in employment growth were accompanied by changes in relative unemployment in Germany, Ireland, Italy and Finland, while in the Netherlands, France and Sweden, relative employment growth moves together with the relative activity rate.
As shown above, the difference between employment growth and the sum of the percentage change of activity and employment rates must equal the percentage change in the working-age population which in turn reflects labour mobility flows. A tendency
Austria Belgium Germany Denmark
Greece Spain Finland France
Ireland Italy Luxembourg Netherlands
Portugal Sweden
Employment Participation 1-Unemployment rate
United Kingdom
towards greater inward mobility is visible in Spain, Ireland, Luxemburg and the Netherlands; outward mobility is observed in Finland, Portugal and Sweden. A sus-tained inflow of workers characterised the increase in the Spanish and Irish employ-ment before the 2008 crisis. The crisis reversed only partly this trend, with the negative labour demand shock leading to huge job destruction and a limited decline in the growth of the working-age population. This pattern contrasts with that of Finland following the recession of the early 1990s, when a strong increase in unemployment was accompanied by a persistent and sizeable decline in the activity rate.
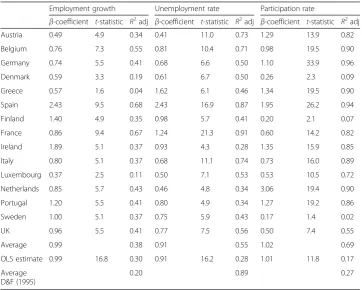
As a next step, it is analysed to what extent employment growth, unemployment and activity rates are driven by common or asymmetric shocks in various Member States. This analysis is summarised in Table 2. Following standard practice in the literature, country-level variations in the variables are regressed on developments for the EU-15 aggregate. The β-coefficients indicate how much of the change in the EU aggregate is transferred on national variables within the same year, while the R2 measures the strength of the relationship between national and aggregate variables. A few facts are worth mentioning.
On average, 40 % of the fluctuations in national employment growth are explained by EU-15 developments, which is consistent with findings by L’Angevin (2007a, b) over the 1973–2005 period. This suggests that common shocks in the EU are more relevant at the country than at the regional level but less relevant than in the case of US states.14
Table 2Common labour market disturbances: 1970–2013
Employment growth Unemployment rate Participation rate
β-coefficient t-statistic R2adj β-coefficient t-statistic R2adj β-coefficient t-statistic R2adj
Austria 0.49 4.9 0.34 0.41 11.0 0.73 1.29 13.9 0.82
Belgium 0.76 7.3 0.55 0.81 10.4 0.71 0.98 19.5 0.90
Germany 0.74 5.5 0.41 0.68 6.6 0.50 1.10 33.9 0.96
Denmark 0.59 3.3 0.19 0.61 6.7 0.50 0.26 2.3 0.09
Greece 0.57 1.6 0.04 1.62 6.1 0.46 1.34 19.5 0.90
Spain 2.43 9.5 0.68 2.43 16.9 0.87 1.95 26.2 0.94
Finland 1.40 4.9 0.35 0.98 5.7 0.41 0.20 2.1 0.07
France 0.86 9.4 0.67 1.24 21.3 0.91 0.60 14.2 0.82
Ireland 1.89 5.1 0.37 0.93 4.3 0.28 1.35 15.9 0.85
Italy 0.80 5.1 0.37 0.68 11.1 0.74 0.73 16.0 0.89
Luxembourg 0.37 2.5 0.11 0.50 7.1 0.53 0.53 10.5 0.72
Netherlands 0.85 5.7 0.43 0.46 4.8 0.34 3.06 19.4 0.90
Portugal 1.20 5.5 0.41 0.80 4.9 0.34 1.27 19.2 0.86
Sweden 1.00 5.1 0.37 0.75 5.9 0.43 0.17 1.4 0.02
UK 0.96 5.5 0.41 0.77 7.5 0.56 0.50 7.4 0.55
Average 0.99 0.38 0.91 0.55 1.02 0.69
OLS estimate 0.99 16.8 0.30 0.91 16.2 0.28 1.01 11.8 0.17
Average D&F (1995)
0.20 0.89 0.27
Note: The coefficients are from regressions of each variable on the relative EU-15 aggregate; they represent the response of a country-specific variable to the EU aggregate. Estimation over the sample period 1970–2013. D&F stands for Decressin and Fatás (1995)
Employment growth is highly correlated with EU-level developments for the majority of countries; asymmetric shocks seem to prevail in Austria, Denmark, Greece and Luxembourg.
Country-level unemployment rates are in general generally more strongly correlated with the EU aggregate than in the case of employment growth. The same is true for activity rates, with the notable exceptions of Denmark, Finland and Sweden.
4.4 Adjustment to asymmetric labour demand shocks: evidence
Results from the VAR model estimations are summarised by the corresponding impulse-response functions, showing the impulse-response of variables to a one-standard-deviation positive labour demand shock. The regression output from the estimation of two model variants (excluding and including wages) is presented in Additional file 2.
Figure 7 shows the responses of employment, the unemployment rate, the activity rate and migration to a positive labour demand shock for the whole sample (top panel) and for the pre-crisis period (bottom panel). Results are shown separately in the parsi-monious VAR specification with no real wages (left panels) and for the specification in-cluding a wage equation (right panels). While the graphs show the effects of a positive labour demand shock, the response to a negative shock is symmetric. For presenta-tional purposes, confidence intervals are not shown. The responses of the employment
-.012 -.008 -.004 .000 .004 .008 .012 .016 .020 .024
1 2 3 4 5 6 7 8 9 10 11 12 13 14 15 Employment Unemployment rate Activity rate Labour Mobility
Standard specification -.012 -.008 -.004 .000 .004 .008 .012 .016 .020 .024
1 2 3 4 5 6 7 8 9 10 11 12 13 14 15 Employment Real wages Unemployment rate Activity rate Labour mobility
Specification augmented with wage response
-.012 -.008 -.004 .000 .004 .008 .012 .016 .020 .024
1 2 3 4 5 6 7 8 9 10 11 12 13 14 15
Employment Unemployment rate Activity rate Labour Mobility
Standard specification -.012 -.008 -.004 .000 .004 .008 .012 .016 .020 .024
1 2 3 4 5 6 7 8 9 10 11 12 13 14 15
Employment Real wages Unemployment rate Activity rate Labour mobility
Specification augmented with wage response
Pre-crisis period (1970-2007) Whole sample (1970-2013)
rate and the activity rate are significant at the 5 % for about 10 years while the response of the employment is always significant.15
The results suggest that, as expected, labour demand shocks result mostly in a vari-ation of unemployment and activity rates on impact. These effects dissipate very slowly over time. In contrast, the effect on mobility and real wages is smaller on impact and builds up gradually.
Over the period 1970–2013, the average size of the labour demand shocks identified is about 1.1 %. The effect on employment is persistent and reaches a maximum after about 4 years, before falling to a value permanently higher than the initial level. Within 1 year, the unemployment rate falls and the activity rate rises respectively by about 0.5 and 0.3 percentage points above the EU average. The effect of the shock on the un-employment and activity rates is very persistent and lasts beyond 5 years.
Labour mobility increases by 0.3 % the first year and peaks after about 10 years. Thus, in the first year, the unemployment rate, the activity rate and labour mobility absorb re-spectively 43, 32 and 25 % of the initial labour demand shock. The proportion of the initial demand shock absorbed by changes in the population rises over time.
All in all, in analogy with previous studies, results indicate that, over the medium term, the large majority of asymmetric demand shocks are absorbed via an adjustment in relative activity rates and mobility, the former being more responsive in the first years after the shock, while the latter becoming predominant after some years.
Over the pre-crisis sample (1970–2007), the average shock is estimated to be about equally sized but more persistent. In response to the shock, within the first year, the unemployment rate declines by 0.3 percentage points and the activity rate increases by 0.4 percentage points. Within the first year, the unemployment rate and the activity rate absorb about 34 and 38 %, respectively, of the labour demand shock.16 Compared to the whole sample, the response of unemployment is weaker and more persistent; in contrast, the response of the activity rate is larger and more persistent. A key difference across the two periods is found in the response of labour mobility, which appears less responsive to the shock in the pre-crisis period. In the whole sample, the response is about 0.5 % after 5 years, while it is below 0.4 % in the pre-crisis sample.
In the long term, the increase of the labour supply through higher activity rate and greater labour mobility accounts for respectively 40 and 60 % of the overall increase in employment. The figures for the pre-crisis period are 40 and 50 %. It also emerges that, while for the whole sample in less than 8 years mobility becomes the prominent form of adjustment, for the pre-crisis period, it takes more than 11 years for mobility to overtake activity rates as the most relevant adjustment channel.
The evidence suggests that since the start of the 2008 crisis, mobility has played a more important role in the adjustment of labour markets than in the past; in contrast, the adjustment of unemployment and activity rates was comparatively short-lived. This is consistent with the observation that activity rates were resilient in the EU since 2008, while discouragement effects appear to have been weaker than in previous downturns.17
greatly for the adjustment of the relative unemployment rate, consistent with the findings of Blanchard and Katz (1992) for the US states and Bayoumi et al. (2006) for Canadian provinces.18
When restricting the sample to the pre-crisis period, the response of real wages appears considerably more muted. Thus, since 2008, relative wages have become more reactive to country-specific cyclical conditions.
Is economic adjustment different under the EMU than before? The responses to an asymmetric labour demand shock have also been computed for a sample split that allows to answer this question: a pre-EMU and EMU period. Figure 8 shows that the labour market adjustment has changed during the EMU period in a number of respects.
First, despite the fact that the estimated average labour demand shock is about equally sized over the two periods (1.1 % in the first period and 1.0 % in the second), the response of unemployment is quicker and less persistent in the EMU period.19 Second, the activity rate exhibits a more muted and short-lived reaction to the shock. Third, labour mobility appears to respond more quickly during the EMU period, absorbing a bigger fraction of the shock than the activity rate at any lag.20 A possible explanation for this finding could be linked to the fact that activity rates in EU coun-tries have been driven to larger extent by structural factors, including linked to reforms and policies facilitating labour market participation by females and the elderly, and less by cyclical factors. Moreover, the more rapid response of the working-age population
-.012 -.008 -.004 .000 .004 .008 .012 .016 .020 .024
1 2 3 4 5 6 7 8 9 10 11 12 13 14 15
Employment Unemployment rate Activity rate Labour Mobility
Standard specification -.012 -.008 -.004 .000 .004 .008 .012 .016 .020 .024
1 2 3 4 5 6 7 8 9 10 11 12 13 14 15
Employment Real wages Unemployment rate Activity rate Labour mobility
Specification augmented with wage response
-.012 -.008 -.004 .000 .004 .008 .012 .016 .020 .024
1 2 3 4 5 6 7 8 9 10 11 12 13 14 15
Employment Unemployment rate Activity rate Labour Mobility
Standard specification
After EMU (1999-2013)
-.012 -.008 -.004 .000 .004 .008 .012 .016 .020 .024
1 2 3 4 5 6 7 8 9 10 11 12 13 14 15
Employment Real wages Unemployment rate Activity rate Labour mobility
Specification augmented with wage response
Before EMU (1970-1998)
may reflect more the effect of enlargement than a migration of national citizens. Finally, real wages in the EMU period seem to be more reactive to country-specific labour de-mand shocks. Before the EMU, the response of real wages to the shock is initially muted and becomes statistically significant after 5 years. In the post-EMU period, wages are significantly different from the pre-shock level after the second year.21
Table 3 provides a measurement of the contribution of an asymmetric labour demand shock to the cyclical fluctuations of each variable. For example, 37 % of the fluctuations in the activity rate are attributed at the 5-year horizon to a labour demand shock. The decomposition of unemployment is not reported because, trivially, labour demand shocks explain at all horizons the largest proportion of unemployment fluctuations.
Before EMU, labour demand shocks account for a sizeable proportion of the variance of the activity rate, while these shocks are less relevant for wages or labour mobility. After monetary unification, there is a considerable change in the relative importance of labour demand shocks. Within 1 year, they still remain more important for the activity rate than for labour mobility or real wage growth; however, over the medium to the long run, labour demand shocks become relatively more important for the variance of labour mobility. These results underscore the increased role of wages and mobility as adjustment mechanism to asymmetric labour demand shocks.
5 Conclusions
Cross-country mobility flows in the EU are still much lower than those recorded in other highly integrated economic areas, notably the USA, and well below mobility within countries. The population of migrants from within the EU is also generally much lower than the population of migrants from outside the EU. Nevertheless, an upward trend in mobility is visible in the EU, not only as a result of the enlargement.
The analysis of the dynamic response of mobility flows to asymmetric shocks in the vein of Blanchard and Katz (1992) confirms previous findings that in Europe, un-employment and labour market participation absorb the largest fraction of asymmetric labour demand shocks in the short to medium term. Over the period 1970–2013, about one quarter of asymmetric labour demand shocks are absorbed by labour mobility within 1 year, while about 50 % of the shock is absorbed after 5 years, an estimate which is in line with that obtained in previous studies. The paper shows, in line with L’Angevin (2007a, b) and Dao et al (2014), that the importance of mobility as an adjust-ment mechanism has increased in the EU. In contrast to previous studies, this paper
Table 3Variance decomposition: percentage of the variance of each variable explained by a
country-specific labour demand shock
Before EMU After EMU
Years after the shock
Growth of relative real wages
Activity rate Labour
mobility
Growth of relative real wages
Activity rate Labour
mobility
1 0.3 12.6 6.0 1.1 8.4 7.6
3 0.5 27.7 6.0 5.2 15.2 18.9
5 0.9 36.9 6.0 5.7 18.3 21.1
10 1.2 44.0 6.1 5.8 19.8 21.6
15 1.3 45.2 6.2 5.8 19.8 21.6
integrates wage developments into the analysis. It finds that the response of real wages to demand shocks has also strengthened after the inception of the euro.
Beyer and Smets (2015) found that the role of labour mobility as adjustment mechanism for the EU regions has fallen over the period 1994–2011; their analysis is however not in contradiction with that of this paper, which focuses on mobility across countries and not regions. The difference suggests that mobility adjustment within the EU is triggered more by country than by region-specific shocks.
Overall, the findings of this paper suggest that, although the magnitude of mobility flows in the EU remains below what could be expected in a fully integrated monetary union, the responsiveness of labour mobility to asymmetric demand shocks has increased over time.
Further analysis is needed to investigate the reasons underlying such increased res-ponsiveness of mobility flows, notably the relative roles of enlargement (see, e.g. Jauer et al. 2014) and the loss of the exchange rate and an independent monetary policy as shock absorbers. The analysis also suggests that, in the coming years, the persistence of the large unemployment differentials observed after the crisis could entail cross-country labour mo-bility flows of a considerable magnitude, which could require in some cases supportive policy frameworks to ensure the effective integration of mobile workers.
Endnotes 1
In this paper, the terms “mobility” and “migration” will be used interchangeably, although in the EU policy context, mobility refers to movements within the EU and migration to movements between EU and non-EU countries.
2
The theory of optimal currency areas was pioneered by Mundell (1961), McKinnon (1963) and Kenen (1969). A recent survey is provided by Mongelli (2008). For a text-book treatment, see De Grauwe (2016).
3
Own calculations based on the 2010 data of the U.S. Census Bureau (2011). Comparable recent figures and historical data for the USA have been published by Molloy et al. (2011).
4
Recent surveys of EU mobility trends include European Commission (2014a, pp. 282–286; 2014b) and Barslund and Busse (2014).
5
In the USA, the population share of working-age people born outside the USA is 16 % or about half the share of people who moved from one state to another (own calculations based on the Pew Research Center (2012) tabulation of the 2010 US Census).
6
Data, based on the EU Labour Force Survey, which allows a differentiation between EU and non-EU migrants, go back to 2005 (see Additional file 1 on the data sources).
7
Section 4 of the previous working paper version of this paper includes a separate analysis of the determinants of bilateral gross migration flows. The analysis confirms that labour market conditions (i.e. the unemployment rate) are a significant determinant of these flows both globally and among EU countries.
8
For more detail on this point, see the working paper version of this article.
9
The effect of an asymmetric shock fades away after 7–8 years in the USA and only after 15–20 years in the euro area. However, after 1990, the persistence of national unemployment rates has diminished in the euro area.
10
11
The identification strategy orders the variables in a way that real wages come after employment growth but before the other variables. The log of relative real wages is included in the VAR as first differences (i.e. they are assumed to be non-stationary). Panel unit root tests confirm their non-stationarity.
12
A previous working paper version of this article includes analysis on a selected number of individual countries (Germany, Spain, France, Ireland, Italy and the UK). In the country-specific analysis, quarterly data were used.
13
Calvo et al. (2012) showed that recoveries that follow deep recessions are jobless or wageless depending on the pattern of inflation during the recession episodes.
14
The 0.4 regression coefficient is lower than the one found for the USA (0.6) by Blanchard and Katz (1992) but higher than what was found by Decressin and Fatás (1995) for regional data (0.2).
15
While it is easy to derive confidence intervals for the response of employment growth and the unemployment and activity rates, this is not the case for migration which is obtained as a residual from the estimated response of these variables. Confidence intervals for the migration response could potentially be obtained by bootstrapping methods, but this has not been done either by Blanchard and Katz (1992) or by recent contributions like Beyer and Smets (2015).
16
The response of the unemployment rate up to 4 years after the shock stays within the standard errors computed over the whole period; after the fourth year, the dynamics of the unemployment rate does not differ over the two samples. In contrast, the response of the activity rate is always within the standard errors computed for the whole period.
17
These findings are consistent with those by Jauer et al. (2014).
18
These findings are robust to a specification where wages are an exogenous variable. The results are also robust to a different identification scheme where wages respond contemporaneously to labour demand and labour supply shocks but affect the un-employment and the activity rates only with a lag. Finally, the results do not change significantly for a specification where relative wages are stationary.
19
This may reflect the persistency of the labour demand shock itself which is lower in the post-EMU period.
20
This is consistent with the results obtained by L’Angevin (2007a, b) comparing the 1990–2005 period with that over the 1970–2005 period. Results are robust to the exclusion from the sample of Denmark, Sweden and the UK.
21
This finding is influenced substantially by change of relative wages over 2012–2013; in fact, the dynamic adjustment of real wages is closer when the response computed for the 1999–2011 period is closer to that of the pre- than to that of the post-EMU period.
Additional files
Additional file 1:Data sources on migration (OECD 2013). (DOCX 15 kb) Additional file 2:Estimation output of VAR models. (DOCX 26 kb)
Competing interests
The IZA Journal of Migration is committed to the IZA Guiding Principles of Research Integrity. The authors declare that they have observed these principles.
Acknowledgements
This paper is based on Chapter II.1 of the Report“Labour Market and Wage Developments in Europe 2015”of DG EMPL, European Commission (European Commission 2015; not including Section 4 of that chapter). It appeared as a working paper (Economic Paper 539) in the European Economy series of the European Commission and as IZA Policy Paper No. 106. An abridged, nontechnical summary appeared in the Quarterly Report on the Euro Area of the European Commission (first quarter of 2015). Opinions expressed in this paper are those of the authors and may not reflect the views of the European Commission. The authors would like to thank Laurent Aujean, Robert Anderton, Anne Bucher, Lewis Dijkstra, Georg Fischer, Valerie Jarvis, Robert Strauss and Sebastian Weber for the helpful comments as well as Prakash Loungani and Davide Furceri for the useful discussions. This research has been conducted while all the authors were at DG ECFIN. Responsible editor: Denis Fougère
Author details
1
Directorate General for Employment, Social Affairs and Inclusion, European Commission, Brussels, Belgium.
2Directorate General for Economic and Financial Affairs, European Commission, Brussels, Belgium.
Received: 19 December 2015 Accepted: 12 July 2016
References
Barslund M, Busse M. Making the most of EU labour mobility, Report of a CEPS Task Force in cooperation with the Bertelsmann Stiftung. 2014. October 2014.
Bayoumi T, Sutton B, Swiston A. Shocking aspects of Canadian labor markets, CEPR Discussion Paper 5847. 2006. Bentolila S, Jimeno F. Regional unemployment persistence: Spain, 1976-1994. Labour Econ. 1998;5(1):25–42. Beyer RCM, Smets F. Labour market adjustments and migration in Europe and the United States: how different? Econ
Policy. 2015;30(84):643–82.
Blanchard O, Katz LF. Regional evolutions. Brook Pap Econ Act. 1992;1:1–75.
Borjas GJ. The economic analysis of immigration. In: Ashenfelter OC, Card D, editors. Handbook of labor economics, vol. 3A, ch. 28. North-Holland: Amsterdam; 1999.
Calvo G, Coricelli F, Ottonello P. The labor market consequences of financial crises with or without inflation: jobless and wageless recoveries, NBER Working Paper No. 18480. 2012.
Commander S, Kangasniemi M, Winters LA. The brain drain: curse or boon? A survey of the literature. In: Baldwin R, Winters LA, editors. Challenges to globalization. Chicago: University of Chicago Press; 2004. p. 235–72.
Dao M, Furceri D, Loungani P. Regional labor market adjustments in the United States and Europe, IMF Working Paper 2014/26. 2014.
De Grauwe P. Economics of monetary union. Eleventh edition. Oxford: Oxford University Press; 2016. Decressin J, Fatás A. Regional labour market dynamics in Europe. Eur Econ Rev. 1995;39:1627–55.
European Commission. Employment and social developments in Europe, 2013, Directorate-General for Employment, Social Affairs and Inclusion (DG EMPL). 2014a.
European Commission. Recent trends in the geographical mobility of workers in the EU, Supplement to EU Employment and Social Situation Quarterly Review, Directorate-General for Employment, Social Affairs and Inclusion (DG EMPL), June 2014. 2014b.
European Commission. Labour market and wage developments in Europe 2015, Directorate-General for Employment, Social Affairs and Inclusion. 2015.
Jauer J, Liebig T, Martin JP, Puhani PA. Migration as an adjustment mechanism in the crisis? A comparison of Europe and the United States, IZA, Discussion Paper 7921. 2014.
Kenen P. The optimum currency area: an eclectic view. In: Mundell, Swoboda, editors. Monetary problems of the international economy. Chicago: University of Chicago Press; 1969.
L’Angevin C. Dynamiques d’ajustement et mobilité du travail au sein de la zone euro, Trésor-éco Lettre No. 14. 2007a. L’Angevin C. Labour market adjustment dynamics and labour mobility within the euro area, Documents de Travail de
la DGTPE No. 06. 2007b.
Mayda AM. Who is against immigration? A cross-country investigation of individual attitudes toward immigrants. Rev Econ Stat. 2006;88:510–30.
McKinnon RI. Optimal currency areas. Am Econ Rev. 1963;53(4):717–25.
Molloy R, Smith CL, Wozniak A. Internal migration in the United States. J Econ Perspect. 2011;25(3):173–96.
Molloy R, Smith CL, Wozniak A. Declining migration within the U.S.: the role of the labour market, NBER Working Paper No. 20065. 2014.
Mongelli FP. European economic and monetary integration, and the optimum currency area theory, European Economy, Economic Papers 302, European Commission. 2008.
Mundell RA. A theory of optimal currency areas. Am Econ Rev. 1961;51(4):557–665. Obstfeld M, Peri G. Regional non-adjustment and fiscal policy. Econ Policy. 1998;13:206–59. OECD. OECD Economic Surveys: European Union 2012. Paris: OECD Publishing; 2012. OECD. International migration outlook. Paris: OECD Publishing; 2013.
Pew Research Center. Statistical portrait of the foreign-born population in the United States, 2010. 2012. http://www. pewhispanic.org/2012/02/21/statistical-portrait-of-the-foreign-born-population-in-the-united-states-2010/, Accessed 17 Sept 2014.