R E S E A R C H
Open Access
Measuring differential item and test functioning
across academic disciplines
Judith Runnels
Correspondence:
Hiroshima Bunkyo Women’s University, Bunkyo, Japan
Abstract
Differential item functioning (DIF) is when a test item favors or hinders a
characteristic exhibited by group members of a test-taking population. DIF analyses are statistical procedures used to determine to what extent the content of an item affects the item endorsement of sub-groups of test-takers. If DIF is found for many items on the test, the final test scores do not represent the same measurement across groups in the population of test-takers. This is known as differential test functioning (DTF). DTF is of particular concern in tertiary level language tests, where test-takers often differ in academic discipline. This study examined the DIF and DTF of an in-house developed assessment designed to measure how well first year students of five academic disciplines achieved material over the course of a year of English language study. The DIF and DTF tests were performed using Rasch analysis, which controls for ability across groups, ensuring that items are only flagged if groups of test-takers of the same ability levels exhibit a significantly different probability of endorsing the item. The current analysis outlines the process for checking for DIF and DTF and finds that even though DTF is unlikely, there were several items that favored and hindered some majors. Recommendations for modification of items are made and the importance of establishing a process to check for DTF and DIF, especially when the test-takers are from different disciplines of study, is discussed.
Keywords:Rasch Analysis, Differential item functioning, Differential test functioning, Academic discipline
Background
While increasing numbers of Japanese universities are using commercially produced placement examinations for streaming classes by ability, the validity and relevance of the content of some of these tests has been questioned (Chapman, 2005). Weaver (2007) notes that while these assessments may be successful at providing an overall in-dication of test-takers’English knowledge, since they are written for the mass market, they do not provide specific enough conclusions by which to place students for that particular institution. Furthermore, they are irrelevant if the goal of the test is to deter-mine the acquisition of material presented throughout the duration of tuition, rather than to determine the overall proficiency as an English language learner. As such, many universities are maintaining the usage of in-house designed assessments which can be tailored to the specific needs of their student population, language program or institutional demands.
A major concern with the results of these in-house designed exams however, is that the interpretations and ultimate uses of test scores are valid and reasonable (Messick, 1989; Bachman, 1990) although the process of checking for validity for in-house designed tests is often overlooked (Weir, 2005). Furthermore, and particularly when it comes to institutional level testing, it is of the utmost importance that neither the test as a whole nor any individual item on the test favors any characteristic of a test-taker (Lumley & O’ Sullivan 2005). Differential item functioning (DIF) occurs when exam-inees with the same level of ability from two different groups have different probabil-ities of endorsing an item (Cole, 1993; Clauser & Mazor, 1998). This can subsequently result in higher or lower scores for test-takers within that group (Swaminathan & Rogers, 1990; Chang & Mazzeo, 1994; Donoghue et al. 1993). Differential test function-ing (DTF) is when the total score functions differently across groups such that the final scores do not represent the same measurement across the population of test-takers (Raju et al. 1995). The particular statistical approaches for examining these possibilities, known as DIF and DTF analysis respectively, detect the existence of some inherent characteristic in the test that is causing groups of test takers to respond differently after controls for ability are employed (Geranpayeh & Kunnan, 2007; Karami, 2011). For DIF and DTF analyses, the Rasch model has been shown to provide a suitable method for equating abilities across groups (Karami, 2011; Wolfe, 2004).
The Rasch model uses probability to determine the relationship between a raw score and a person’s ability, taking both item difficulty and person ability into account on an item-by-item basis (Bond & Fox, 2001; Rasch, 1980). A participant’s raw test score is converted into a ratio of success to failure and then into the logarithmic odds that the per-son will respond correctly to an item (a logit) (Smith, 2000). The logits are then plotted on a single scale and used as an estimate of ability for a test-taker and difficulty of an item. Rasch-based methods have the capability of identifying people or items that exhibit unex-pected response patterns (Wright & Stone, 1979). For DIF in particular, the Rasch model identifies items for which being a member of a certain sub-group of test-takers affects the probability of endorsement of that item when compared to other groups.
Rasch analysis has most commonly been used to measure differences in gender, ethnicity and native language on pedagogical performance tests (Meade & Fetzer, 2009). In terms of language, Chen and Henning (1985) were one of the first researchers in language to employ a Rasch analysis for DIF. They examined bias in a university placement test for Chinese and Spanish test takers. Elder (1996) also used Rasch to analyze whether language background led to DIF on a test of English. Takala and Kaftandjieva (2000) modified the Rasch model to investigate DIF on the vocabulary section of Finnish Foreign Language Certificate Examination. All of the aforementioned scholars note that any time there are differences in test-takers, addressing the potential issue of DIF is important.
Proficiency Test for humanities and, science and engineering groups and found items that both favored and hindered certain majors. Weaver (2007) also found that a DIF analysis pinpointed differences between reading passages which benefited science or humanities majors, depending on the content of the passage.
The test-takers of the current analysis are of five different majors, and it is therefore important to consider the possibility of DIF to verify that the test is not favoring one major over another. The test was designed to determine how well students had ac-quired material that they had studied throughout their first year of English study. While students of all five majors participated in the same English classes, some of the curricu-lum may have favored some disciplines over others, potentially affecting test perform-ance. It is therefore imperative to ensure that the test and each individual item are taking equivalent measurements across groups (Camilli, 2006). Three hypotheses will be tested: the first hypothesis is that the item has the same difficulty across two groups, the second is that the item has the same difficulty as the average difficulty for all groups, and the third hypothesis is that the item has no overall DIF across all groups (Linacre, 2004). If any of these hypotheses are rejected, then this would indicate that some of the items are exhibiting DIF and checks for DTF will be performed by compar-ing mean DIF scores across majors. Since this test was designed to measure how well students achieved material from a year of English study, and all students participated in the same mixed-major English classes, no DIF is expected. In the event that some de-gree of DIF is found, and that it is large enough to impact students’final grades, subse-quent measures such as score adjustment, may be required to compensate for the inherent favoring in the test. Additionally, item modification may also be required prior to future administrations of the assessment.
Method Participants
The test-takers were 325 female first year students from Hiroshima Bunkyo Women’s University (aged 18 and 19 years), a private university in Hiroshima City, Japan. They were in one of eleven different mixed-major classes and had completed two 90 minute lessons a week throughout two semesters of the academic year. Japanese (L1) and Eng-lish (L2) are respectively the first and second languages of all test-takers.
Instrument
The test (administered in 2012) consisted of 61 multiple choice questions in 3 sections (reading, listening and grammar). The assessment tool was designed to determine how well students had acquired material from curriculum they studied in two periods of 90 minutes every week for the previous year and was previously analysed for misfit to the Rasch model by Runnels (2012) who found no misfitting infit and very little misfitting outfit. The test made up 15% of the students’final grade for the semester and lasted a total of 76 minutes.
Procedure
results of the test to produce both the item strata and the differential item functioning analysis outputs. The two types of fit statistics (infit and outfit) were also measured.Infit statistics consist of mean-square (MNSQ) values, and outfit statistics are composed of z-standardized scores (ZSTD). The MNSQs represents the size of the misfit to the Rasch model and the ZSTDs the significance of the misfit. Essentially, infit is used to judge unexpected response patterns where the test is targeting ability, while outfit statistics re-flect guessing or mistakes (Linacre, 2007). Acceptable values for MNSQs are between 0.7-1.3 and from−2.0 to 2.0 for ZSTDs on a low stakes test (Bond & Fox, 2007).
Item separation strata are used to identify statistically distinct difficulty levels according to the responses to all items (Wright & Masters, 2002). They demonstrate the range of item-difficulties that have been included. Item strata are calculated using the following formula (Beglar, 2010):
Item strata¼ð4Gitemþ1=3Þ
whereGitem is the Rasch item separation value (derived by dividing the item standard deviations by the average measurement error). Smith (2001) requires a minimum two level difficulty level in order to deem the measurement tool representative of the assessed content.
Each item on the test was examined for DIF. To test the three hypotheses, WINSTEPSWcompares the group mean scores on each item, the item difficulty to the mean difficulty for all groups on that item, and that the item DIF across all groups. For the current analysis, these tests are performed in the reverse order, starting with the third hypothesis, to determine which items are exhibiting DIF across majors. If there are no items with any evident DIF, the second hypothesis will be checked to determine if any items have a statistically significant differing difficulty to the average difficulty across majors. Finally, if necessary, items which have different difficulties across two majors will also be measured (the first hypothesis) to determine where these differences specifically lie. Altogether, testing these three hypotheses will also reveal if DTF is a concern for this assessment.
These hypotheses use a t-test (Wright & Stone, 1979) to determine the amount of DIF (Smith, 2004). WINSTEPSW(Linacre, 2010) employs the following formula:
t¼di2–di1 √ s2l2s211
where di2is the difficulty of item Iin calibration based on two groups, di1 is the
diffi-culty of itemiin calibrationl, s211is the standard error of the estimate for di1 and s2l2is
the standard error of the estimate for di2(Alavi & Karami, 2010). Rather than
calculat-ing fit statistics for each individual item, for DIF tests, Rasch produces the between-class mean squares as the Between-Group fit statistics (see Smith & Plackner, 2009). The between-group fit indices also test the hypothesis that the dispersion of the group measures fits with the expectations of the Rasch model.
sample sizes are small. In the present study, the sample size can reasonably be consid-ered as large and therefore, using the significance tests directly from the software out-put, may not be justified. Linacre (2007) notes that for the first hypothesis, which compares across two majors, that the results of a Rasch analysis test for DIF are ques-tionable. Despite statistically significant differences, the impact of one item may have too small an influence on the meaning of the test results. As a result, in the current study, both statistical significance and a logit difference of at least 0.5 are required be-fore any action to address item bias will be taken (Linacre, 2007). The former will be addressed by employing a Bonferroni correction test, as described by Alavi & Karami (2010). This entails distributing the alpha level (in this case, 0.05) across all of the com-parisons such that 0.05 is the sum of the alpha levels (see Thompson, 2006). Then, the alpha level is divided by the number of items, producing a new level at which to judge significance.
Results
Summary statistics
The mean score of the test was 55.7% (SD= 12.6%). Three items (46, 49, 71) fell out-side the acceptable range for outfit, all with statistically significant ZSTDs (Runnels, 2012).
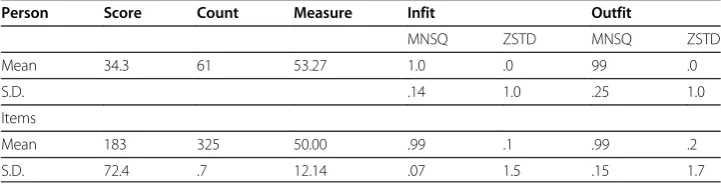
Summary statistics for the test are shown in Table 1. The mean MNSQ for both infit and outfit falls within the acceptable range for a low-stakes test (Bond & Fox, 2007). Cronbach’s alpha for items is 0.99 and the separation strata for non-extreme items (items for which there was not a 0% or a 100% success rate) was 8.54: this many dis-tinct difficulty levels demonstrates that the scale discriminated effectively between test-takers (Smith, 2001).
Differential item analyses
The results of the hypothesis test that items have no overall DIF across all groups are shown in Table 2. Only items that are statistically significant at the p<0.05 value are displayed. It can be seen that there is only a single item which exhibits has statistically significant DIF (Item 5) and that it is exhibiting DIF across all majors. The Bonferroni correction test puts the new significance level at 0.0008, at which even this item is no longer significant.
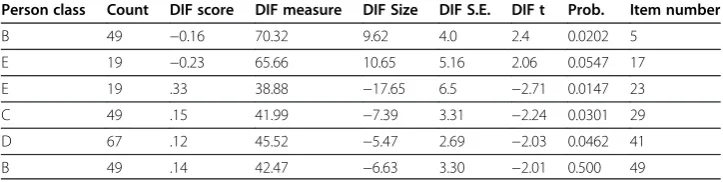
For the hypothesis that the item has the same difficulty as its average difficulty for all groups, statistically significant differences at an alpha level of 0.05 are shown below in Table 3 (a total of 6 items as follows: 5, 17, 23, 29, 41, 49). There are 6 items across the
Table 1 Summary statistics for person and item measures*
Person Score Count Measure Infit Outfit
MNSQ ZSTD MNSQ ZSTD
Mean 34.3 61 53.27 1.0 .0 99 .0
S.D. .14 1.0 .25 1.0
Items
Mean 183 325 50.00 .99 .1 .99 .2
S.D. 72.4 .7 12.14 .07 1.5 .15 1.7
5 majors that have statistically significant different difficulties. Applying the Bonferroni correction test to this analysis reduces the alpha level to 0.0008. At this level of signifi-cance, there are no items that are significantly different across groups.
Given these results, the mean significance DIF and p-value for each major was calcu-lated and is shown in Figure 1. It can be seen that neither major had any DIF scores over 0.5 logits, eliminating the possibility of DTF.
The final hypothesis is tested to determine specifically which items exhibit differences between majors. Table 4 displays the output for the hypothesis that the item has the same difficulty across two groups (statistically significant differences only). In total, there are 14 items exhibiting significant differences (2, 5, 17, 20, 23, 29, 30, 32, 34, 35, 41, 48, 49). Following a Bonferroni test, of these 14 items, at an alpha level of p<0.0008, none of these items are significant.
Summarizing all of the tests herein, there are a total of 14 items displaying DIF of some kind. Out of the 14 items, 7 of them were highlighted by only one of the hypoth-esis tests (items 2, 20, 30, 32, 34, 35, 48), six items by two of the tests (17, 23, 29, 41, 49) and one item by all three of the hypothesis tests (item 5). However, regarding the results of the third hypothesis (shown in Table 4), items 35 and 48 had significantly dif-ferent scores for more than just two majors. Given all of this, these analyses have pro-vided a list of 8 items that require revisiting prior to future administrations (5, 17, 23, 29, 35, 41, 48 & 49). Item 5 is likely the only item that requires definite modification.
Discussion
The results of the current study indicate that there are a potential 14 items with signifi-cant DIF on the test, although the evidence is strong enough to conclude that there is
Table 2 Items with DIFAcross all groups*
Person class Summary DIF
Chi-square D.F. Prob. Between-ClassMean-Square Item T=ZSTD Item number
5 10.2878 4 0.0357 0.5532 −0.5242 5
*The first column, Person Class is the count of groups (in this case, major) with estimable DIF for the item. The Summary DIF Chi-Square column is the sum of the squared normalized t-statistic value for each item. D.F. represents the degrees of freedom or the count of majors minus 1 contributing to the chi-square. The Prob. is the probability of the chi-square (any value under 0.05 is statistically significant) followed by the Between-Class Mean-Square. The sixth column, the Item T=ZSTD represents the significance of the Mean-Square standardized as a unit-normal deviate (t-statistic with infinite degrees of freedom). The final column, the item number, accords with the question number on the test.
Table 3 Item difficulty by major compared to average difficulty for all groups*
Person class Count DIF score DIF measure DIF Size DIF S.E. DIF t Prob. Item number
B 49 −0.16 70.32 9.62 4.0 2.4 0.0202 5
E 19 −0.23 65.66 10.65 5.16 2.06 0.0547 17
E 19 .33 38.88 −17.65 6.5 −2.71 0.0147 23
C 49 .15 41.99 −7.39 3.31 −2.24 0.0301 29
D 67 .12 45.52 −5.47 2.69 −2.03 0.0462 41
B 49 .14 42.47 −6.63 3.30 −2.01 0.500 49
only a single item (5) that is causing enough DIF for serious concern in that it may have impacted the overall scores on the test. However, since it was only a single item out of a total of 61, this represents 1.6% of the total test. Since the scores of this test contributed to 15% of students final grades, this item was worth 0.24% of student’s overall grades. If any Welfare or Nutrition majors were on a grade change cusp and 0.24% would boost them up to the next grade level, or prevent them from failing, then perhaps action might be taken to adjust their scores, but at such a small percentage,
0
0
-0.05 0 0.05 0.1 0.15 0.2
M
ean D
IF
for
all
item
s
(in logits)
Major
Mean p-value
B C D E
Figure 1The mean DIF levels for all majors in logits where B is Welfare, C is Psychology, D is Nutrition and E is Global Communication.
Table 4 Item score significant differences across major*
Item Majors DIF Contrast Joint S.E. Welch t d.f Prob
2 AD −7.25 3.16 −2.3 154 0.0229
5 AB −12.08 4.4 −2.75 32 0.0072
BD 12.23 4.77 2.56 99 0.0118
17 AE −11.62 5.46 −2.13 32 0.0411
BE −12.71 5.97 −2.13 39 0.0395
20 CE −14.13 6.21 −2.28 39 0.0285
23 AE 19.03 6.75 2.82 29 0.0086
BE 16.78 7.17 2.34 35 0.0251
CE 19.17 7.20 2.66 36 0.0115
DE 18.54 6.99 2.65 33 0.0122
29 AC 9.17 3.76 2.44 103 0.165
DC 9.61 4.17 2.3 105 0.0232
30 AE −12.04 5.21 −2.31 34 0.0269
32 AD 10.99 5.23 2.1 129 0.0377
34 AC 8.28 3.59 2.31 106 0.0229
35 AD −7.54 3.61 −2.09 106 0.0393
CA 7.54 3.62 2.09 106 0.0393
41 CD 8.81 4.04 2.18 108 0.0315
DA −6.80 3.24 −2.1 151 0.0372
48 AD −6.69 3.18 −2.1 152 0.0371
AE −12.9 5.46 −2.36 32 0.0244
49 AB 8.69 3.75 2.31 103 0.0226
this possibility is unlikely and adjustment of the scores is not likely necessary. In terms of future action however, even though overall the mean DIF for each major was negli-gible enough that DTF was not found, future administrations of this test could certainly benefit from some modification of items; particularly item 5 and possibly the additional 7 items that were highlighted by two of the tests employed in the analysis. The DIF analyses however, make no suggestion as to how modifications can be made, and in-corporating changes is sometimes a trial-and-error process (Alavi & Karami, 2011) since the reason as to why the DIF exists for this test is only speculative.
For the most questionable item, the relevant portion of the reading passage that this item is based on is as follows:
We met on the first day of our third year of Junior High School when we were 14 and now we are both first year university students. The exact item is as follows:
5. How long have Yuriko and Mari been friends? a. More than 3 years
b. More than 4 years c. More than 5 years d. More than 6 years
This item requires some pre-existing knowledge about how old students are when they enter university. Furthermore, more than 6 years is not mutually exclusive of the other options of more than 3, 4, and 5 years which suggests a potential wording issue with the distractors. Despite this, Early Childhood Education majors and Nutrition majors of the same ability found this item easier than Welfare majors. This could be a matter of simple arithmetic or better awareness of how many years between junior high school and university. Either way, this item’s distractors need to perhaps be made more specific or more information is required in the passage.
Item 23 was another that exhibited DIF to some extent (see Table 4). This item was a fill in the blank from a postcard as follows:
It is __23___ city.
The options were: a. really interesting b. really interested c. a really interesting d. a really interested
where the Global Communication majors had some sort of internal advantage) is now raised. Further explorations could perhaps determine which students were affecting the overall DIF.
In the listening section of the test, item 48 required students to, after listening to a self-introduction of an imaginary classmate, respond to the following question:
48. How old is Julie’s sister? a. 2
b. 16 c. 18 d. 20
The relevant portion of the listening passage was as follows:“I am 18 years old and I have 1 sister. She is two years younger than I am.”
In this item, Early Childhood Education majors of the same ability are more likely to correctly endorse this item than both Global Communication and Nutrition majors. As with item 5, this could perhaps be due to the arithmetic involved, note-taking ability or it could be related to short-term memory, since this information was presented to test-takers at the start of a one minute speech. It did not necessarily call on English com-prehension knowledge of any kind, and was likely more related to either short-term memory or an ability to note what may be important information later on (all students could make notes throughout the listening passages if they chose to). In either case, the listening passage could be adjusted by breaking it down into chunks so that the answer to the question is not presented an entire minute prior to being able to respond.
Conclusions
Overall, this assessment did in fact seem to hold up reasonably well under DIF scrutiny, so that major concern does not need to be given to differences between sub-groups of test-takers. Nonetheless, the process for interpreting DIF results has not been well-established. Alavi & Karami (2011) examined experts’interpretations of DIF results to de-termine the real cause of the DIF. They found inconsistencies among the opinions, deeming DIF interpretations ad hoc. They suggest that a systematic mechanism to inter-pret DIF results is required and that despite the lack of specificity for the interinter-pretation of items exhibiting DIF, the process of checking for its existence should not be ignored.
whether or not the reason for the DIF is easily determinable. Ultimately, this evaluation produced useable results that may be able to provide direction for future improvement of the instrument. DIF analyses, especially when there are several different sub-groups of test-takers, with potentially different characteristics, should not be overlooked.
Competing interests
The author declares that she has no competing interests.
Authors’information
Judith Runnels is currently lecturer in the Global Communication Department at Hiroshima Bunkyo Women’s University where she is Head of Assessment. Her research interests include testing and evaluation.
Received: 21 March 2013 Accepted: 21 March 2013 Published: 12 April 2013
References
Alavi, SM, & Karami, H. (2010). Differential item functioning and ad hoc interpretations.TELL, 4(1), 1–18.
Alavi, SM, Rezaee, AA, & Amirian, SMR. (2011). Academic discipline DIF in an English language proficiency test.Journal of English Language Teaching and Learning, 5(7), 39–65.
Alderson, JC, & Urquhart, A. (1985). The effect of students’academic discipline on their performance on ESP reading tests.Language Testing, 2, 192–204.
Bachman, LF. (1990).Fundamental considerations in language testing. Oxford: Oxford University Press. Beglar, D. (2010). A Rasch-based validation of the vocabulary size test.Language Testing, 27, 101–118.
Bond, TG, & Fox, CM. (2001).Applying the Rasch model: Fundamental measurement in the human sciences. Mahwah, NJ: LEA. Bond, TG, & Fox, CM. (2007).Applying the Rasch model: Fundamentalmeasurement in the human sciences(2nd ed.). New
Jersey: Lawrence Erlbaum.
Camilli, G. (2006). Test fairness. In R Brennan (Ed.),Educational measurement(4th ed., pp. 221–256). New York: American Council on Education & Praeger series on higher education.
Chang, HH, & Mazzeo, J. (1994). The unique correspondence of the item response function and item category response functions in polytomously scored item response models.Psychometrika, 59, 391–404.
Chapman, M. (2005). A case study of the need for change in the language testing policies of a Japanese corporation. JLTA Journal, 8, 51–67.
Chen, Z, & Henning, G. (1985). Linguistic and cultural bias in language proficiency tests.Language Testing, 2(2), 155–163. Clauser, EB, & Mazor, MK. (1998). Using statistical procedures to identify differentially functioning test items.Educational
Measurement: Issues and Practice, 17, 31–44.
Cole, NS. (1993).History and development of DIF. Hillsdale, NJ, England: Lawrence Erlbaum Associates, Inc.
Donoghue, JR, Holland, PW, & Thayer, DT. (1993). A Monte Carlo study of factors that affect the mantel-haenszel and standardization measures of differential item functioning. In PW Holland & H Wainer (Eds.),Differential item functioning(pp. 137–166). Hillsdale, NJ: Lawrence Erlbaum Associates.
Elder, C. (1996). The effect of language background on“foreign”language test performance: The case of Chinese, Italian, andModern Greek.Language Learning, 46, 233–282.
Geranpayeh, A, & Kunnan, AJ. (2007). Differential item functioning in terms of age in the certificate in advanced English examination.Language Assessment Quarterly, 4, 190–222.
Karami, H. (2011). Detecting gender bias in a language proficiency test.International Journal of Language Studies, 5(2), 27–38. Linacre, JM. (2004). Test validity and Rasch measurement: Construct, content, etc.Rasch Measurement Transactions,
18(1), 970–971.
Linacre, JM. (2007).A user's guide to WINSTEPS-MINISTEP: Rasch-model computer programs. Chicago, IL. winsteps.com. Linacre, JM. (2008).A user's guide to winsteps/ ministeps: Rasch model computer programs. Chicago, IL. winsteps.com. Linacre, JM. (2010).Winsteps® (Version 3.70.0) [Computer Software]. Beaverton, Oregon: Winsteps.com.
Lumley, T, & O’Sullivan, B. (2005). The effect of test-taker gender, audience and topic on task performance in tape-mediated assessment of speaking.Language Testing, 22(4), 415–437.
Meade, AW, & Fetzer, M. (2009). Test bias, differential prediction, and a revised approach for determining the suitability of a predictor in a selection context.Organizational Research Methods, 12(4), 738–761.
Messick, S. (1989). Validity. In RL Linn (Ed.),Educational measurement(pp. 13–103). New York: Macmillan. Pae, T. (2004). DIF for learners with different academic backgrounds.Language Testing, 21, 53–73.
Raju, NS, van der Linden, WJ, & Fleer, PF. (1995). IRT-based internal measures of differential functioning of items and tests.Applied Psychological Measurement, 19, 353–368.
Rasch, G. (1980).Probabilistic models for some intelligence and attainment tests. Chicago: University of Chicago Press (Expand ed).
Runnels, J. (2012). Using the Rasch model to validate a multiple choice English achievement test.International Journal of Language Studies, 6(4), 141–155.
Smith, EV. (2000). Metric development and score reporting in Rasch measurement.Journal of Applied Measurement, 1, 303–326.
Smith, EV. (2001). Evidence for the reliability of measures and validity of measure interpretation: A Rasch measurement perspective.Journal of Applied Measurement, 2, 281–311.
Smith, R. (2004). Detecting item bias with the Rasch model.Journal of Applied Measurement, 5(4), 430–449. Smith, RM, & Plackner, C. (2009). The family approach to assessing fit in Rasch measurement.Journal of Applied
Measurement, 10(4), 424–437.
Takala, S, & Kaftandjieva, F. (2000). Test fairness: A DIF analysis of an L2 vocabulary test.Language Testing, 17, 323–340. Thompson, B. (2006).Foundations of behavioral statistics: An insight-based approach. London: The Guilford Press. Weir, CJ. (2005).Language testing and validation: An evidence-based approach. Hampshire, UK: Palgave-Macmillan. Weaver, C. (2007).A Rasch-based evaluation of the presence of item bias in a placement examination designed for
an EFL reading program.In T. Newfields, I. Gledall, P. Wanner, & M. Kawate-Mierzejewska (Eds.).Second Language Acquisition - Theory and Pedagogy: Proceedings of the 6th Annual JALT Pan-SIG Conference.Retrieved September 21, 2012 from http://jalt.org/pansig/2007/HTML/Weaver.htm.
Wolfe, EW. (2004). Equating and item banking with the Rasch model. In E Smith & R Smith (Eds.),Introduction to Rasch measurement(pp. 360–390). Maple Grove, MN: JAM Press.
Wright, BD, & Masters, GN. (2002). Number of person or item strata.Rasch MeasurementTransactions, 16, 888. Wright, BD, & Stone, MH. (1979).Best test design. Chicago: MESA Press.
doi:10.1186/2229-0443-3-9
Cite this article as:Runnels:Measuring differential item and test functioning across academic disciplines. Language Testing in Asia20133:9.
Submit your manuscript to a
journal and benefi t from:
7Convenient online submission
7Rigorous peer review
7Immediate publication on acceptance
7Open access: articles freely available online
7High visibility within the fi eld
7Retaining the copyright to your article