DEVELOP AND IMPLEMENTATION OF FOREST TO IMPROVE RAINFALL
USING K–MEANS ALGORITHM IN DATA MINING
*1Miss.Vijayalakshmi G., MCA, M.Phil, *2 Mr. Sivabalan M., MCA, M.Phil
*1 Guest Lecturer, PG and Research Department of Computer Science, Government Thirumagal Mills
College, Gudiyattam, Tamilnadu, India.
*2 Guest Lecturer, PG and Research Department of Computer Science, Government Thirumagal Mills
College, Gudiyattam, Tamilnadu, India
---***---Abstract: Forest is nature of world. The forest
nowadays destroyed in people. The tree is life of nature. We all have an inherent understanding that our lives are better because of forests. Forests are called the “lungs of the earth”, and work against climate change. There is a purifying and moderating role for trees and forests related to water that is more important now than ever. The model describes tree interception processes gross precipitation, leaf drip, stem flow, and evaporation. Its goal is to inspire the restoration of urban forest ecosystems which will, in turn, restore and conserve our planet for future generations. Forests are part of nature’s water filter. Forests soak up more water than other land uses, catching rainfall in the canopy and developing more porous soils over time. The forest canopy uses water during the growing season, making more room to store water in the soil during storms. The purpose research collecting data of forest it developing forest in Gudiyattam. To analyzed the forest using k-means algorithm and hierarchical methods in data mining. In this dissertation going to implement the forest with rain fall improve while using the k means algorithm. The process of analyzing data from different perspectives and summarizing it into useful information in forests. Keywords: K-Means, Improve Rainfall ,Bagging, Navie Bayes ,Random Forest.
INTRODUCTION
Information from a large dataset. Data Mining uses many techniques for evaluating different patterns from a large amount of data. Data Mining is considered to be a step in the larger process of Knowledge Discovery from Data (KDD). KDD is the process of discovering useful knowledge from data while data
mining refers to a particular step in this process. In data Mining large datasets relating to any subject/field are first collected and then all preprocessing is applied. Preprocessing is a process of transforming or making data appropriate for applying data mining techniques to it. Preprocessing may include: cleaning of data, summarization, transformation etc. Data is transformed into the format required for the analysis. Data Warehouses are the largest storage units of data. Historical data relating to any field can be found in the data warehouse. For example; a bank ABC has many branches but has one center or headquarter. Similarly, operational data is stored in each branch’s storage unit but historical data from each branch is collected and stored in one centralized unit called a data warehouse. So that in future any kind of data analysis can be applied to the data.
BACKGROUND
Forests form a vital resource for practically all economies of the world. Apart from timber and wood products, it offers a variety of valuable goods and services including implications for global climate regulations. Different types of forests, forest based goods and services as well as biodiversity are main components of these ecosystems.
The sustainable forest is an aggregation of trees that people preserve in a dynamic social and natural environment for the ecological qualities, services, and yields they want. Active effort is required to prevent unwanted changes that human activities and natural phenomena would usually produce. Preservation requires investment to control forest uses and the social forces that determine them; to conserve and replace
necessary ecological capacities; and to develop the organizations, policies, and technologies that forest replacement, maintenance, and enhancement are likely to need.
Fig: Forest Cycle
1.1 IMPORTANT OF CLIMATE CHANGES IN AGRICULTURE
Climate is one of the most important determinants of vegetation patterns globally and it has significant influence on the distribution, structure and ecology of forests. Rapid urbanization, industrialization and increasing needs of transportation have resulted in depletion of non-renewable natural resources like coal, diesel and petrol by human beings in all over the world. This has resulted in the incessant annual rise in the levels of greenhouse gases like carbon-di-oxide, methane, nitrous oxide and carbon monoxide among others.
Trees play an important part in the water cycle, grounding the water in their roots and releasing it into the atmosphere. In the more than half the water in the ecosystem is held within the plants. Without the plants, the climate may become dryer.
Solid earth material that has been altered by physical, chemical and organic processes so that it can support rooted plant life.Soil thickness reflects the balance between rates of soil production and rates of downslope soil movement.
PROBLEM DESCRIPTION:
Deforestation is typically done to make more land available for housing and urbanization, timber,
large scale cash crops such as soy and palm oil, and cattle ranching. deforestation is done illegally (about half of it used for firewood).This destructive practice entails cutting down a patch of trees, burning them, and growing crops on the land until the soil becomes too degraded from overgrazing and sun exposure for new growth. Then, the farmers move on to a new patch of land.Deforestation in tropical regions is now widely acknowledged as a global problem, as is the decline in mature or “old growth” forests in all countries.
Community devastation as their forest is cut down, millions of indigenous people suffer human rights abuse, and increased poverty and disease. Their food and medicine sources are destroyed. Their drinking water is polluted by soil erosion. With less than 5% of the logs’ value given back to the communities, the business of logging is moving landholders from subsistence affluence to a desperate type of poverty.
LITERATURE SURVEY
the trends, which can be regarded as elements for creating the models. Statistical warning signs except coefficients of skewness and kurtosis are observed appropriate to extract the hidden patterns existing in weather data. The neural community signal processing strategy for weather forecasting is successful of yielding excellent outcomes and can be considered as an choice to usual meteorological approaches. Accurate climate forecasting performs a integral role for planning day to day activities. Neural community has been use in numerous meteorological purposes together with climate forecasting
IMPROVE RAINFALL USING DATA MINING APPROACHES
There are two main types of data mining approaches; supervised learning and unsupervised learning. In this work we have carried out research on supervised learning. Classification is a supervised learning approach which is based on training sample set. WEKA [31] machine learning tool is used to build predictive models. We have implemented eight classifiers which represent five categories of classifiers (i.e., trees, functions, Bayesian classifiers, lazy classifiers, and rules). These Classification algorithms are bagging, bayesNet, IBk, J48, Logistic Regression, NaiveBayes, PART and RandomForest which are experimentally implemented and compared against each other.
A. Bagging
Bagging (bag) stands for bootstrap aggregating is a machine learning algorithm that relies on an ensemble of different models. Bagging predicts an outcome multiple times from different training sets that are combined together either by uniform averaging or with voting [17]. The training data is re-sampled from the original data set. According to Witten and Frank [18], bagging typically performs better than single method models and almost never significantly worse. Bagging is a “bootstrap” ensemble method that creates individuals for its ensemble by training each classifier on a random redistribution of the training set. The bagging algorithm creates an ensemble of models (classifiers or predictors) for a learning scheme where each model gives an equally weighted prediction.
The principal food crops include paddy, millets and pulses. Commercial crops include sugarcane, cotton, sunflower, coconut, cashew, chillies, gingelly and groundnut. Plantation crops are tea, coffee, cardamom and rubber. Major forest produces are timber, sandalwood, pulp wood and fuel wood. Tamilnadu occupies a premier position in the production and extensive application of bio-fertilizers. Efforts are on to improve farming technologies so as to increase yields in the low rainfall areas of the State. Annual food grains production in the year 2010-11.
B. Decision Tree (J48 Algorithm)J48 is Weka’s
implementation of the C4.5 decision tree learning. C4.5 constructs a classifier in the form of decision tree. A set of data representing things e.g software fault data that are already classified is fed to the C4.5 algorithms to produce a decision tree. A classifier is a tool in data mining that takes a group of data representing things we want to classify and attempts to predict which class the new data belongs to. Research on C4.5 algorithm was funded by the Australian Research Council for many years. Decision trees have internal nodes, branches, and terminal nodes. Internal nodes represent the attributes, terminal nodes show the classification result, and branches represent the possible values that the attributes can have. C4.5 is a well-known machine learning algorithm.
C. Naive Bayes
The Naive Bayesian classifier was first described in [19] in 1973 and then in [20] in 1992.Bayesian classifiers are statistical classifiers. Naïve Bayes algorithm is one of the most robust machine learning algorithms for Improve Rainfall [11]. The Naïve Bayes classifier [21] is based on Bayes rule of conditional probability. It analysis each attribute individually and assumes that all of them are independent and important. Naive Bayes classifiers have been used extensively in fault-proneness prediction, for example in [22]. An advantage of the naive Bayes classifier is that it requires a small amount of training data to estimate the parameters necessary for classification.
Random Forest [23] is also another approach under ensemble classifier. Random Forest is a classifier based on decision trees which exhibits great performance in computer engineering studies by Guoet al., [24]. Random forest has one important advantage that it is fast and is able to handle large number of input attributes. It includes tens or hundreds of trees. In the construction of decision tree a random choice of attributes is involved. The trees are created using the following strategy [25]: 1.Each tree’s root node has a sample bootstrap data which is equal to the actual data. There is a different bootstrap sample for each tree.2.Using best split method subset of variables is randomly selected from input variables.3.Each tree is then grown to the maximum extent possible without pruning.4.When all trees are built in the forest, new instances are attached to all the trees then voting process takes place to select the classification with maximum votes as the new instance(s) prediction.
E. Logistic Regression (LR)
Logistic regression is a classification scheme which uses mathematical logistic regression functions. The most popular models are generalized linear models. Logistic regression measures the relationship between the categorical dependent variable and one or more independent variables by estimating probabilities using a logistic function, which is the cumulative logistic distribution [30]. Thus, it treats the same set of problems as probit regression using similar techniques, with the latter using a cumulative normal distribution curve instead. Equivalently, in the latent variable interpretations of these two methods, the first assumes a standard logistic distribution of errors and the second a standard normal distribution of errors [26]. The regression coefficients are usually estimated using maximum likelihood estimation. Researchers have applied statistical methods such as uni-variate or multivariate binary logistic regression to predict rainfall [10].
Fig: Relationship between Climate Change, Ecosystem Services and Human System
Generally the temperature and rain fall in the district are moderate. Especially, Arakkonam Taluk enjoy moderate climate throughout the year. On the other hand Vellore, Walaja and Gudiyattam Taluks, which are surrounded by hills, are subjected to extreme climate conditions either being very hot during summer of very cold during the winter season. In Thirupathur taluk the climate is cold during winter but moderate during the other seasons. The district receives rainfall during the south west and north east monsoon period. The region get maximum rainfall during the south west monsoon period only. The actual rainfall received during this year is presented in the table appended.
PROPOSED METHODOLOGY:
south west monsoon period only. The actual rainfall received during this year is presented in the table appended.
Agriculture Production:
The principal food crops include paddy, millets and pulses. Commercial crops include sugarcane, cotton, sunflower, coconut, cashew, chilies, gingelly and groundnut. Plantation crops are tea, coffee, cardamom and rubber. Major forest produces are timber, sandalwood, pulp wood and fuel wood. Tamilnadu occupies a premier position in the production and extensive application of bio-fertilizers. Efforts are on to improve farming technologies so as to increase yields in the low rainfall areas of the State. Annual food grains production in the year 2010-11.
An Improved K-means Clustering Algorithm.
The traditional K-means algorithm is a widely used clustering algorithm, with a wide range of applications. This paper introduces the idea of the K-means clustering algorithm analysis the advantages and disadvantages of the traditional K-means clustering algorithm elaborates the method of improving the K-means clustering algorithm based on improve the initial focal point and determine the K value. Simulation experiments prove that the improved clustering algorithm is not only more stable in clustering process, at the same time, improved clustering algorithm to reduce or even avoid the impact of the noise data in the dataset object to ensure that the final clustering result is more accurate and effective.
K = # of clusters (given); one “mean” per cluster • Interval data
• Initialize means (e.g. by picking k samples at random) • Iterate:
(1) Assign each point to nearest mean (2) Move “mean” to center of its cluster.
With the development and improvement of data mining technology, data clustering algorithm are gradually applied to some fields. The definition of clustering in the academic community can be generalized as follows: First, the similarity of data objects. Data objects within the same cluster have great similarity, but data objects within the different cluster have great non-similarities. Second, the distance of data objects. Take entire data set as a test data object of the gathering, the distance between any pair of data objects within the same cluster size should not be greater than the distance between the different clusters of arbitrary data object.
Third, the density of data objects. Take entire data set as a multi-dimensional space aggregation of the data object, a cluster is the spaces which contain the number of data object relatively high dimension cut off by the space which contains the number of data object relatively low dimension. Thus form a relatively separated set of dimensional space.
2.1 Procedure of K-means Algorithm
• Distribute all objects to K number of different cluster at random;
• Calculate the mean value of each cluster, and use this mean value to represent the cluster;
• Re-distribute the objects to the closest cluster according to its distance to the cluster center;
• Update the mean value of the cluster. That is to say, calculate the mean value of the objects
in each cluster;
• Calculate the criterion function E, until the criterion function converges.
Usually, the K-means algorithm criterion function adopts square error criterion, be defined as:
k n 2
E =ΣΣ||xi – mj||
j=1 i=1
xiϵcj
In which, E is total square error of all the objects in the data cluster, xi bellows to data objectset, mi is mean value of cluster Ci(x and m are both multi-dimensional). The function of this criterion is to make the generated cluster be as compacted and independent as possible.
Analysis of the Performance of K-means Algorithm (a) Advantages:
1. K-mean value algorithm is a classic algorithm to resolve cluster problems; this algorithm is relatively simple and fast.
2. For large data collection, this algorithm is relatively flexible and high efficient, because the Complexity is O (ntk). Among which, n is the times of iteration, k is the number of cluster is the times of iteration. Usually, k”n and t”n. The algorithm usually ends with local optimum. 3. It provides relatively good result for convex cluster. 4. Because the limitation of the Euclidean distance. It can only process the numerical value, with good geometrical and statistic meaning.
The Research Point of K-means Clustering Algorithm
The research on K-means clustering algorithm is mainly from the following two aspects:
First, about the determination of K value. Through the above analysis, the K value of the initial cluster centers
to determine the far-reaching impact throughout the clustering process and the final clustering results, while the K value in practical applications is very difficult to direct or one-time determination. Especially, if the amount of data tends to infinity which is pending, the K value of the K-means algorithm to determine will be very difficult. At present, there are two clustering algorithms to determine the K value is relatively effective which is the cost function based on distance and propagation clustering algorithm based on nearest neighbors. The former find the minimum through using the cost function. Thus obtain the corresponding K value. The latter using nearest neighbor clustering algorithm to calculate the appropriate number of cluster center, the number of cluster center provides for the maximum K value of the K-means clustering Algorithm to get the optimal value of K.
Second, about the choice of initial cluster centers. K-means clustering algorithm using the iterative method to solve the problem, except the first step, the clustering results of each step are improved to some extent; otherwise terminate the process of iteration. Traditional K-means clustering algorithm takes the cluster squares error and the criterion function value change or not as the iterative termination conditions. But the clustering results obtained from this criterion function easily fall into local minimum solution, the result is the clustering results of search are Moving toward the direction of diminishing the criterion function value.
PERFORMANCE ANALYSIS
K-NN is used to predict the class of the crop production i.e whether it is High, Low or Medium. Instead of having the numerical values under the attribute “Yield”, now our dataset has the categorical values which are “High”, “Low” and “Medium”. Data was normalized before feeding to the k-NN algorithm. Normalization means that all the attributes were sorted to be in the same range of 01 excluding the attribute “Texture”. A Confusion matrix is made for showing the accuracy of the predictions.
K-NN divides the dataset into two parts one is taken as Test set and other as Training set. A model is trained or developed based on the training set and then test set is fed to the model to check how well the trained model did. Since we have 150 instances/records, dataset is divided into two parts where training set has 100 instances and test set has 50. Confusion matrix shows the predictions done by model on the test set i.e on the 50 predictions. The Diagonal values shown in the table are the ones correctly predicted by the model and others are errors. Here 35 observations out of 50 are correctly classified giving the model an accuracy of 70%.
K-means clustering was used for predicting the classes based on the clusters. The number of clusters could be initialized basically by Fogy and random partition methods. However in our case we already knew the number of clusters/categories to which we want our instances to fall in, hence k=3. Three categories corresponding to three clusters are Low, Medium and high. K-means deals with only numerical attributes i.e only feature space is analyzed for any relationship or pattern among different attributes in order to make an instance fall into a certain cluster. There for all the factor attributes has to either be excluded for k-means implementation or they can be converted to numeric. Attributes used for k-means are: OC, P, conducted (EC), K2O and pH. K-means is in the R-Library by default therefore we do not have to install any particular package. The target attribute which contain factor values is kept NULL.
CONFUSION MATRIX FOR K-NN
Table : Confusion matrix for K-nn
It is observed from the confusion matrix that only 19 observations out of 150 are incorrectly predicted i.e predicted to be in the wrong cluster. Here High category corresponds to 3rd cluster. “Low” production category corresponds to 1st cluster and “Medium” to 2nd cluster. Hence 131 out of 150 instances are perfectly predicted. Unlike K-NN, k-
Fig: Data Set Plots
Fig: K-Means Clustering
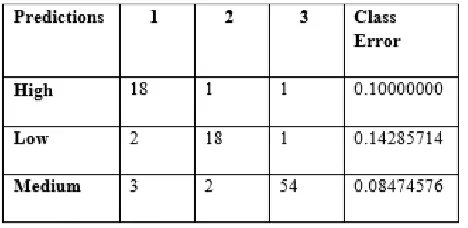
By default the number of trees made by this algorithm is 500 but these can be increased or decreased as per requirements of the implementer. Every tree takes each of the instance/observation as input and then gives the output as leaf by going through the different rules made by the tree based on pre training. The dataset is divided into two parts which are training set and test set. Number of trees specified is 500. Model is trained based on the training set with 100 instances. OOB estimated is 10% which represents the model to be 90% accurate in case of classifying the instances.
Table: Geographical Area in Pernampattu Block
Confusion matrix shows 10 instances to be incorrectly classified whereas 90 out 100 are perfectly classified into their respected categories. In High category there were 20 instances, random forest
predicted 18 out of these to be in the same class whereas it predicted 1 to be in “low” and one to be “medium”. This makes the prediction of only “High” class to be 90% accurate. On the other hand there are 21 records/instances which fall into the yield production category of “LOW” production. Out of these 21 instances random forest predicted 18 records which belong to the category “LOW” and 2 instances to falls in “high” and 1 in “Medium”. Hence the prediction rates for random forest in case of predicting a value to be in “LOW” production category are very good i.e nearly 86%. 59 instances out of 100 training dataset are in the “Medium” production category from which the random forest algorithm predicted 54 instances correctly. Whereas 2 observations are predicted to be in “high” production category and 3 observations are predicted to be in “LOW” production. This leaves the k –Means Clustering algorithm to be 91.5% accurate when it comes to predict an observation in “Medium” category.
Fig: Final output of k-mean algorithm
As shown in figure, the dataset has been divided into two separate regions. This graph plotted on a 2D plane, can be described easily as our technique has made it very easy to understand and predict after seeing the graph that the red dots that are below the line are indicting the cancerous and the green dots that above the line are non-rain fall data.
CONCLUSION
and used techniques are not ideal for all the soil dataset but gives a theory that random forest might works better than k-NN and k means. However, various problems in agriculture not only relating to crop growth, quality assurance but also the condition of a farmer can be dealt using appropriate data mining techniques. Proper actions should be taken by the Governments in order to collect the appropriate agricultural data for the sole reason of applying data mining techniques on it. Agriculture field promises a great deal of work to be done and new applications to be developed in order to enhance the knowledge about certain behaviors of the crops, animal etc.
FUTURE ENHANCEMENT
If humans don't stop clearing Tropical Rainforests they will eventually disappear for good. Scientists predict that in 40 years there will be no more Rainforests and the sloths and giant anteaters and many other animals will die with it. They have tall trees, few plants on the forest floor, buttress roots, high biodiversity, rich soil and frequent rain. It is hot and humid.
Rainforests also provide us with many valuable medicinal plants, and may be a source of a cure from some deadly diseases. Most of the products that we use in our country come from rainforests, such as rubber, coffee and rain forest lumber. Rainforests are cut down to harvest the timber and also to make room for farms to grow coffee and spices. Each of us needs to be thoughtful about the way we consume these products, and support companies and programs that make a commitment to safe environmental practices. Recycle and re-use whenever possible, and help keep the earth green and healthy.
BIBILIOGRAPHY:
[1] Mucherino A., Papajorgji P.J and Pardalos P.M(2009). Data Mining in Agriculture. Springer. [2] Kamber, J. H. (2000). Data Mining Concepts and Techniques. UrbanaChampaign: Morgan Kaufmann.
[3] N. Gandhi and L. J. Armstrong, "A review of the application of data mining techniques for decision making in agriculture," IEEE Conference Publications 2016- 2nd International Conference on
Contemporary Computing and Informatics (IC3I), Greater Noida, India, 2016, pp. 1 6.
[4] Ramar, V. R. (2011). Classification Agricultural Land Soils: A Data Mining Approach. Agricultural Journal , 8286.
[5] A. Mucherino, P. P. (2009). A survey of Data Mining Techniques applied to Agriculture. SpringerVerlag.
[6] Holmes, S. J. (1999). Developing Innovative Applications in Agriculture Using Data Mining. [7] D Ramesh, B. V. (2013). Data Mining Techniques and Applications to Agricultural Yield Data. International Journal of Advanced Research in Computer and Communication Engineering , 34773480.
[8] H. Jorquera, R. Perez, A. Cipriano, and G. Acuna, Short Cerdan, O., Govers, G., Bissonnais, Y.L., Oost, V., Posen, J., Saby, N., Gobin, A., Vacca, A.,
Quinton, J., Auerswald, K., Klik, A., Kwaad, F.J.P.M., Raclot, D., Ionita, I., Rejman, J.,
Rousseva, S., Muxart, T., Roxo, M.J., Dostal, T., 2010. Rates and spatial variations
of soil erosion in Europe: a study based on erosion plot data. Geomorphology
122, 167–177.
[9] Hamilton, E.L., and P.B. Rowe. 1949. Rainfall interceptionby chaparral in California. State of California, Dept. ofNatural Resources, Division of Forestry. 43 pp.
[10] Horton, R.E. 1919. Rainfall interception. Mon. Weather Rev.47:603-623.
[11]Hungerford, R.D., R.R. Nemani, S.W. Running, and J.C.Coughlan. 1989. MTCLIM: A mountain microclimatesimulation model, Research paper INT-414. USDA For.Ser. Intermoun. Res. Sta., Ogden, UT. [12]Jetten, V.G. 1996. Interception of tropical rain forestperformance of a canopy water balance model.