Research Journal
Volume 10, No. 31, Sept. 2016, pages 185–193
DOI: 10.12913/22998624/64013 Research Article
DIFFERENT MULTIDIMENSIONAL EXPLORATORY TECHNIQUES
IN CLASSIFYING VARIABLES INTO QUALITATIVE CRITERIA
OF SPARE PARTS SELECTION FOR PASSENGER CARS
Aleksander Lotko1, Małgorzata Lotko1, Rafał Longwic2
1 Kazimierz Pulaski University of Technology and Humanities, Malczewskiego 29 Str., 26-600 Radom, Poland,
e-mail: [email protected], [email protected]
2 Faculty of Mechanical Engineering, Lublin University of Technology, Nadbystrzycka 36 Str., 20-618 Lublin, Poland, email: [email protected]
ABSTRACT
The aim of the paper was (1) to compare cluster analysis and factor analysis applied
in the classification of variables into quality criteria of spare parts selection for pas -senger cars and (2) to create a metamodel taking into account the similarities and
differences between the results of the carried out analyses. To collect empirical data, a survey questionnaire was used. It was built on the basis of literature overview con
-cerning quality management. Data was processed with the use of multi-dimensional exploratory techniques: cluster analysis and factor analysis. A theoretical implication is a proposed metamodel, which joins the results of both cluster and factor analysis. A practical implication is a possibility of taking an advantage on the obtained results when planning, designing, manufacturing, distributing, selecting and selling spare parts for passenger cars. Paper contribution is the use of exploratory data analysis techniques in the research area and the proposal of the metamodel formalizing quality criteria of spare parts selection for passenger cars. The research showed, that classifi
-cations of variables obtained with the use of two multi-dimensional exploitation tech
-niques are different although there are distinct common elements. When using cluster analysis, the following clusters were identified: marketing, economy and utility one (arranged in accordance with the order of linking). While when using factor analysis, the following factors were discovered: utility, marketing, availability and cost factor (arranged in descending way in accordance with the explained variance).
Keywords: spare parts quality, passenger cars, qualitative criteria, multidimensional exploratory techniques.
INTRODUCTION
In recent years, the automobile industry has been struggling with the decrease in sale caused by the financial crisis and technological restric
-tions resulting from the necessity of environment protection. At the same time we observed the shortening of the development cycle and pres
-ence of the automotive industry products in the
market together with the simultaneous increase in
their complexity. The issue of the quality in the automotive industry is of particular importance
for five reasons [16]:
1) Complexity of the product (a car is composed
of more than ten thousand of parts).
2) Technological level of product advancement and the process of its production.
3) Quantity production and mass production. 4) Configurability and modularity of the product.
5) Necessity of close cooperation within the
framework of delivery chains (only a small part of components (usually approx. 20%) is manu
-factured individually by a car manufacturer and the rest comes from the sub-suppliers).
Exploitation of cars covers the necessity of performing a number of operation and repair activities which require appropriate spare parts
mounted in the pace of the worn out or faulty
parts. There is a problem consisting in the selec
-tion of the parts of desired quality. It is an im
-portant and complex issue joining both marketing and commodity science and it cannot be limited merely to evaluation criteria.
The purpose of this paper was to (1) compare the cluster analysis and factor analysis in the
clas-sification of variables into quality criteria of the
spare parts selection and to (2) create a
metamod-el taking into account the similarities and differ
-ences between the results of the carried out analy
-ses. Thus the following working hypotheses have been posed:
• H1: classifications of variables obtained with
the use of two multi-dimensional exploitation
techniques are different although there are dis
-tinct common elements.
• H2: cluster model suggests the acceptance of
less homogenous criteria and of larger
infor-mational capacity (number of variables). • H3: factor model suggests the acceptance of
criteria of more detailed and homogenous
character.
• H4: factor model classifies the smaller number of variables than the cluster model.
The above hypotheses were verified with the use of the cluster and factor analysis.
ANALYSIS OF THE STATE OF THE ISSUE
Carried out literature analysis demonstrates
the relevance and importance of the discussed
topic and at the same time the existence of a
re-search gap. Available elaborates are mainly fo -cused on the system recognition of the relations
between the parts manufacturer and cars manufac
-turer [28], management of the quality of suppliers [17], costs of the quality of suppliers [24], meth
-ods and devices used for the management of the quality in the automotive industry [22], systems,
standards conditioning of the implementation of
quality management in the automotive industry [6], effectiveness of the quality management sys
-tems [19], management of supplies chains [7] or applications of the quality management systems by suppliers [1]. As it comes to the precise issue concerning the quality of parts, in the analysed elaborates, it covered the control at the produc
-tion stage and directly after it [14], standardiza
-tion of the quality tests including the reliability for the parts manufacturers [4], quality challenges and the outline of directions of quality improve
-ment for parts manufacturers [20], quality of the parts in the context of the calling actions [8] or
the issues connected with logistics and packaging
of automotive parts [29].
No paper covering the results of the research on the classification of quality criteria of the se
-lection of spare parts, from the point of view of the client, has been found. Taking this research gap into account, in this paper the author made an attempt to compare the quality criteria of the selection of parts obtained with the use of two dif
-ferent multi-dimensional exploratory techniques.
QUALITY OF SPARE PARTS FOR
PASSENGER CARS
By confronting the model of J. Żuchowski [30] with the discussed issues, it was found that the quality of passenger cars spare parts and in particular their usability value is determined by the following factors:
• reliability – i.e. fulfilment of particular re
-quirements in every conditions and time. A
passenger car is a special good and it should
be efficient in order not to threaten the safety of both the driver, passengers and other users of the road.
• functionality – in case of the spare parts this
means the performance of a particular task at
the expected level (for example the attainment of a high value of delays by the brake blocks and brake shields, high tire grip, good rough
-ness dampening by the shock absorbers), • durability – concerns the time of exploita
-tion of the parts between the repairs for those parts which may be regenerated (for exam
-ple the clutch, steering gears, cylinder head, some injectors),
• efficiency – concerns the time of the work per
-formed by the parts in which it performs its
function in a desired way in respect of the entire
possible time of its work (for example the shock absorbers after achieving a particular wear and
tear dampen the roughness in a poor way and
may make the car body swing, xenon lights
with time change the colour of the emitted light
• vivacity – the majority of the parts is worn out with time, especially those located in the
suspension, break system but also the engine accessories,
• repairability – due to the economy and ecol
-ogy reasons some parts, instead of being uti
-lized may be subject to regeneration in order to be reused (for example the clutch, steering gears, suspension components (twist-beams), starters, alternators),
• modernity – fulfilment of users requirements within the scope of aesthetics, use of the new
-est materials (aluminium, fibres, ceramic ele
-ments) as well as modern design achievements (elements of the body, external lighting, inte
-rior equipment),
• safety – particularly important feature due to the significant risk in the road traffic. First of all it concerns the active safety i.e. particular parts prevent the occurrence of the said risk (for example the short breaking path thanks to the high quality of break blocks, shock ab
-sorbers and tires, appropriate lighting on the road in front of a vehicle thanks to the efficient headlights). Secondly it covers passive safety i.e. minimization of the negative effects of ac
-cidents (proper functioning of airbags, belt stretchers, protection provided by the areas of controlled body crumpling).
In addition to the mentioned features, the product usability value is also determined by the quality of its performance. One of the most renowned definitions is the one proposed by T. Kotarbiński [12] adroitness of product i.e. the sum of the quality of the type and performance. The first one is among others the degree of prod
-uct compliance with the norms, technical stan
-dards and legal provisions. In case of the spare parts, it should be taken into consideration that besides the compatibility with physical param
-eters (for example adjustment of body compo
-nents), the majority of them is subject to homolo
-gation i.e. it must have the permission to be used within the territory of the country, granted by an authorized institution. The adroitness of a product is also determined by the quality of performance constituted by the degree of representation of the type quality requirements.
Except for the efficiency and compatibility with technical specification, the quality of per
-formance may also cover the aesthetic values. In
case of the spare parts they may include the
sup-porting factors, however they should not be ne
-glected. Obviously the aesthetic criterion applies mainly to the visible components of the interior equipment (special compartments for flowers in Volkswagen New Beetle) and the car body ele
-ments (it is difficult to talk about the aesthetics of a clutch or shock absorber). We may also men
-tion the aesthetics when talking about the prod
-uct packaging, however its contents is more im
-portant. Protection and informational functions
of a packaging are of greatest importance in this
particular case.
When discussing the technical aspect of the quality we should mention the operational qual -ity which except for the technical parameters of
the use and wear and tear is also determined by the form of the sale and after-sale service (for ex -ample the repairs and current or warranty
check-ups). When elaborating the spare parts, a certain period of operational usability is assumed and the said period is most frequently measured by the trouble-free mileage. The economy of us
-ing is an indispensable element as it covers the
economy of operation within the scope of taking
advantage of the check-up services and econo
-my of operation connected with the everyday exploitation of a vehicle.
The ecological aspect of the use of the spare
parts is also very important. Nowadays the life cycles of a number of products are significantly shortened and the utilization of worn out products is becoming a global problem. In order to limit the production and storage of waste, a process of re -generation of used spare parts for passenger cars
has been commenced and propagated in the recent years. Apart from the environmental aspect this solution brings savings for the users of vehicles as the regenerated spare parts are much cheaper.
RESEARCH METHODOLOGY
At first the operationalization of the terms within the scope of the quality attributes of the spare parts was carried out. On the basis of the above presented analysis of the literature research within the scope of product quality issue [30; 12; 11; 18; 5; 21; 10; 23; 27] concerning the qual
-ity of products compared to the specific-ity of the passenger car parts, 21 observable variables have been selected. They were numbered in the follow
-ing way: 1 – reliability, 2 – functionality, 3 – du
-ability, 7 - modernity, innovativeness, 8 –safety, 9 – degree of compatibility with the pattern, 10 – aesthetics, trends, 11 – presentation (form of of
-fer, sale and pre-sale service, 12 – greenness, 13 – fulfilment of the norms and legal regulations, 14 – diligence of performance, 15 – terms of war
-ranty, 16 – price, 17 – economy of installation and use (exploitation), 18 – availability, 19 – speed of delivery, 20 – brand image and reputation of a supplier, 21 – packaging (aesthetics, included information).
Values of the variables were measured on the five-point scales of the Osgood semantic bal
-anced gear. The simplest version of these scales was applied with two opposite adjectives on the edges. The five-point scale from 1 – immaterial to 5 – critical was applied for the evaluation of the importance of attributes.
Research was carried out with the
applica-tion of the survey method. The selecapplica-tion of the research sample was of purposive nature. The re
-search was conducted on the clients of authorized automotive service stations and independent workshops. The number of 498 correctly filled in questionnaires was obtained and subjected to fur
-ther analysis. The research was carried out from 7 to 23 October 2015.
The analysis of clusters and factor analysis is
a two statistical and explorative technique used for data analysis. They are frequently applied in the na
-ture and behavioural science. The concept of cluster analysis was introduced by Tryon [26], and subse
-quently developed by Cattell [2]. Cluster analysis covers a number of various algorithms and methods of grouping objects of similar kind into appropriate categories. It enables explorative analysis of data by sorting various objects into such groups so that the degree of similarity between two objects is maximal when they belong to the same group and minimal when otherwise. The purpose of the analysis is put
-ting the objects of one clusters into groups in a way that the objects belonging to a given cluster have more in common with each other that with the ob
-jects belonging to other clusters. This technique is successfully applied in various areas [15].
Factor analysis was elaborated and developed in the Anglo-Saxon psychology. It was described for the first time by Spearman in 1904. However the theoretical basics and possibilities of practical solutions was elaborated by Thursone [25]. Law
-ley and Maxwell [13] formulated the factor anal
-ysis as a formal statistical model. It is composed
of a set of methods and statistical procedures
which allow for the reduction of a significant number of examined variables to a smaller num
-ber mutually independent (not correlated) factors. Distinguished factors in their assumption are con
-nected with the deeper level of examined reality (for example attitudes, values) and constitute the reasons laying at the bottom of observable vari
-ables. In this paper we applied the method of the
main components which is a typical method of
the classification of variables.
ANALYSIS OF THE RESEARCH RESULTS
AND THEIR COMPARISON
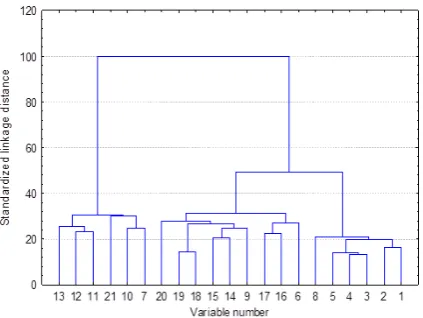
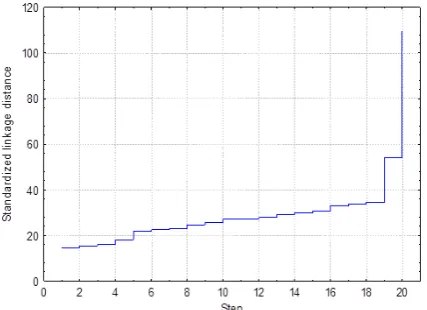
Classification of observable variables into homogenous sets which were called the quality criteria of the selection of spare parts, was taken into consideration. At first the analysis of clusters was applied. Observable variables were joined into clusters with the use of agglomeration (Ward method). Icicle chart presented in figure 1 demon
-strates clusters obtained in the next steps, whereas the chart in Figure 2 illustrates the increase the length of the connection in the next steps.
When analysing figure 1, it was discovered that the obtained classification is technically quite simple to interpret. It is clearly demonstrated that the cut off in the chart with the standardized dis
-tance for example 40 gives three obvious sub
-set (clusters) of variables. It is confirmed by the chart in figure 2 which suggests the place of the cut off in the icicle chart; it shows a considerable
increase in the distance in the last two steps of
the analysis, where the cut off of the chart should be performed. Then it may be assumed that the identified clusters indeed reflect distinct homog
-Fig. 1. Results of the cluster analysis for variables
enous groups in respect of variations of variables.
Therefore a solution with three clusters were
se-lected for further analysis.
Interpretation of the obtained clusters is as fol
-lows (the order of the connection of variables was maintained therefore they are not sorted) [16]: 1. Cluster 1 covers six variables: 13 – fulfil
-ment of the norms and legal regulations, 12 – greenness, 11 – form of presentation (offering of the sale and pre-sale service), 21 – aesthet -ics of packaging and information included in
it, 10 – aesthetics, trends and 7 – modernity and innovativeness of parts. This cluster is
called a marketing cluster and marked with the letter “M”.
2. Cluster 2 covers nine variables: 20 – brand image and reputation of supplier, 19 – speed of delivery, 18 – availability, 15 – terms of a warranty, 14 – diligence of performance, 9 – degree of compatibility with the pattern, 17 – economy of installation and exploitation, 16 – price and 6 – repairability of parts. This
dimension is the most capacious one in re-spect of information and it is concentrated on
the most semantically diverse variables. This
cluster is called the economic cluster and is marked with the letter „E”.
3. Cluster 3 covers six variables: 1 – reliability, 2 – functionality, 3 – durability, 4 – dexter
-ity, 5 – vivacity and 8 – safety of parts. This
cluster is called the utility cluster and marked with the letter „U”.
Reliability of obtained scales was examined with the use of α-Cronbach measure. For the mar
-keting and economic clusters the same value of 0,85 was obtained and for the utility cluster the
value of 0.92. All these values are significantly higher than the suggested border value 0.6.
It should be mentioned that the obtained struc
-ture of the model proved to be slightly equivocal in interpretation. Provided that from the technical view the adopted division into 3 clusters is very clear, the informational content i.e. semantic lay
-er of the first two clust-ers is rich and equivocal. Hypothesis H2 was verified in the same way.
Subsequently the factor analysis was applied, i.e. the analysis of the main components (Princi
-pal Component Analysis). Figure 3 presents the chart of factorial scree, according to the Cattell criterion [3].
Pursuant to the R. Cattell criterion such num
-ber of factors should be assumed, for which the „slope” of the scree begins to flatten. Figure 1 pres -ents that the discussed example there are four
fac-tors. The next selected factors are of a small Eigen
-value so they do not include too much information and should be rejected. On the other hand table 1 includes Eigenvalues of factors and the percentage of general variances explained by them.
The Eigenvalue informs about the fact which part of the entire variability is ‘translated’ by a given factor. Pursuant to the Kaiser criterion [9], factors of Eigenvalues higher than 1 should be maintained in the analysis. Bearing in mind two above mentioned criteria, the solution with four factors was chosen, while the values of the last factor is slightly higher than the value recom
-mended by Kaiser (1,02 towards 1), thus we may probably resign from it in the explanation of the structure of the examined construct.
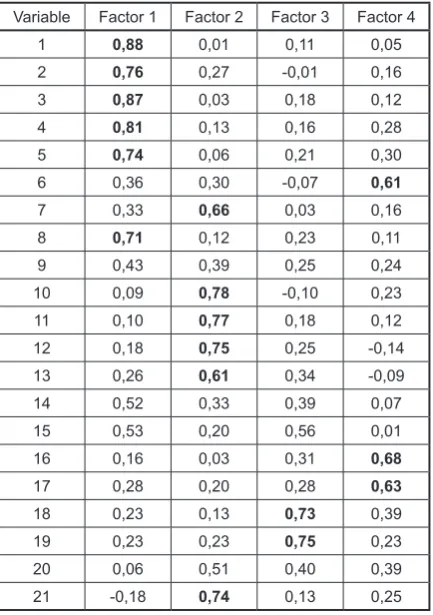
Table 2 presents factor charges for combina
-tion variable-factor. They are interpreted as cor
-relations between the factors and variables.
Fig. 2. Distance between the connections in the next steps of the cluster analysis for variables
Fig. 3. Factorial scree – Eigenvalues of separated
Values of the factor charges for all combina
-tions of factors are also presented in Figure 4. On the basis of table 2 the following four fac
-torial solution was adopted:
1. Factor 1 is loaded by six variables: 1 – reli
-ability, 2 – functionality, 3 – dur-ability, 4 – dexterity, 5 – vivacity and 8 – safety of spare parts. This factor is called the utility and marked with the letter “U”.
2. Factor 2 is indeed loaded by five variables: 10 – aesthetics, trends, 11 – form of the of
-fering, sale and pre-sale service, 12 – green
-ness and 21 – packaging (aesthetics, placed information). Due to the contents of the said variables, this factor is called the marketing
and is marked with the letter “M”.
Table 1. Eigenvalues of factors and the explained per
-centage of variances
Factor Eigenvalue % of the totality of variances
Factor 1 8.40 40.00 Factor 2 2.76 13.20 Factor 3 1.39 6.60 Factor 4 1.02 4.80
Table 2. Factor charges for combination factor-vari
-able (values > 0,6 were distinguished)
Variable Factor 1 Factor 2 Factor 3 Factor 4 1 0,88 0,01 0,11 0,05 2 0,76 0,27 -0,01 0,16 3 0,87 0,03 0,18 0,12 4 0,81 0,13 0,16 0,28 5 0,74 0,06 0,21 0,30 6 0,36 0,30 -0,07 0,61
7 0,33 0,66 0,03 0,16 8 0,71 0,12 0,23 0,11 9 0,43 0,39 0,25 0,24 10 0,09 0,78 -0,10 0,23 11 0,10 0,77 0,18 0,12 12 0,18 0,75 0,25 -0,14 13 0,26 0,61 0,34 -0,09 14 0,52 0,33 0,39 0,07 15 0,53 0,20 0,56 0,01 16 0,16 0,03 0,31 0,68
17 0,28 0,20 0,28 0,63
18 0,23 0,13 0,73 0,39 19 0,23 0,23 0,75 0,23 20 0,06 0,51 0,40 0,39
21 -0,18 0,74 0,13 0,25 Fig. 4.
Values of the factor charges in
3. Factor 3 includes significant factor charges for two variables: 18 – availability and 19 – speed of delivery. This factor is called the availability and marked with the letter „A”. 4. Factor 4 is significantly correlated with three
variables: 6 – repairability, 16 – price and 17 – economy of installation and use. This factor
is called the cost factor and is marked with the letter „C”.
Bearing in mind that the contents of
particu-lar factor, it is obvious that hypothesis H3 was verified.
Reliability of obtained measuring scales was re-examined with the use of α-Cronbach measure. Value of 0,92 was obtained for the utility factor, 0,82 for the marketing factor, the case of avail
-ability was not examined (at least three variables are required and this factor is loaded only by two), whereas the α-Cronbach values for the cost factor amounted to 0,68.
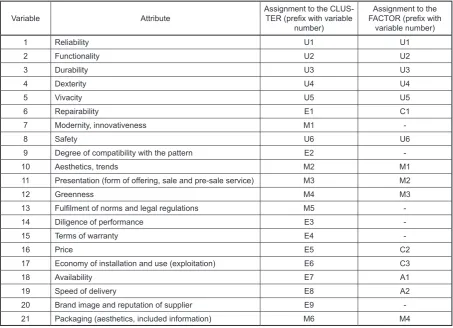
As a result of the application of both types of the analysis we obtained the association of the variables with the quality criteria of the se
-lection of parts, what is collectively presented in table 3. In this way, a metamodel taking into
account the similarities and differences between the results obtained with the use of two different multi-dimensional exploratory techniques, was elaborated.
The analysis of the metamodel included in
ta-ble 3 demonstrates that the utility criterion (U) is identical in both cases. Both in case of the results of the cluster analysis and factor analysis, it cov
-ers the same variables: 1 – reliability, 2 – func
-tionality, 3 – durability, 4 – dexterity, 5 – vivacity and 8 - safety. Three criteria obtained as a result of the cluster analysis have larger informational capacity. In other words – they are less unequivo
-cal. And so, the economy cluster (E) combines all three variables included in the cost factor (C) (6 – repairability, 16 – price, and 17 – economy of installation and use), both variables (18 – avail
-ability and 19 – speed of delivery) constituting the factorial criterion of availability (A) as well as four other variables. Thus the economy criterion (E) in the cluster analysis covers two additional criteria, cost and availability disclosed in factor analysis. As far as the marketing criterion (M) is concerned, in both cases four variables are com
-mon: 10 – aesthetics, trends, 11 – presentation, 12 – greenness and 21 – packaging (aesthetics
Table 3. Metamodel – comparison of the assignment of variables to the clusters and factors
Variable Attribute Assignment to the CLUS-TER (prefix with variable
number)
Assignment to the
FACTOR (prefix with
variable number)
1 Reliability U1 U1
2 Functionality U2 U2
3 Durability U3 U3
4 Dexterity U4 U4
5 Vivacity U5 U5
6 Repairability E1 C1
7 Modernity, innovativeness M1
-8 Safety U6 U6
9 Degree of compatibility with the pattern E2
-10 Aesthetics, trends M2 M1
11 Presentation (form of offering, sale and pre-sale service) M3 M2
12 Greenness M4 M3
13 Fulfilment of norms and legal regulations M5
-14 Diligence of performance E3
-15 Terms of warranty E4
-16 Price E5 C2
17 Economy of installation and use (exploitation) E6 C3
18 Availability E7 A1
19 Speed of delivery E8 A2
and included information). In case of the cluster analysis two variables are added: 7 – modernity, innovativeness and 13 – fulfilment of norms and legal regulations. In factor analysis, the variables with weak correlations with the factors, i.e. low factor charges were dismissed form the model. In this way we verified hypothesis H1.
Additionally it should be notices that in general due to the weak correlations with factors, six vari
-ables were rejected from the factor model. They concern the following variables: 7 – modernity, in
-novativeness, 9 – degree of compatibility with the pattern, 13 – fulfilment of norms and legal regula
-tions, 14 – diligence of performance, 15 – terms of warranty, 20 – brand image and reputation of sup
-plier. Thus the factor model classifies the smaller number of variables than the cluster model (15 to
-wards 21). Thus we verified hypothesis H4. In this way we completed the comparison of the classification of variables with the use of both exploratory techniques.
CONCLUSIONS
As a result of the carried out analysis the fol
-lowing conclusions were drawn:
1. In cluster analysis, the observation of the in
-crease in the length of the binding and the
semantic analysis included in the clusters suggested the adoption of the solution with
three clusters. The following clusters were identified: marketing, economy and utility
one (arranged in accordance with the order
of linking).
2. In factor analysis both the Cattell criterion and
Kaiser criterion suggested the adoption of the four factorial solution (although due to the low
Eigenvalue the fourth factor should be prob
-ably rejected). The following factors were discovered: utility, marketing, availability and
cost factor (arranged in descending way in
ac-cordance with the explained variance).
3. The elaborated metamodel shows that the classifications of variables into quality crite -ria of the selection of spare parts for two
mul-tidimensional exploratory techniques differ,
although there are some common elements
such as utility criterion (covering 6 variables) and a considerable part of the marketing cri
-terion (4 variables: in cluster analysis there are 2 additional variables).
4. In factor analysis we distinguished separate factors describing the availability and costs of the parts. Variables charging these factors
in the cluster analysis are the components of
the economy criterion.
5. Cluster model suggests the adoption of less homogenous criteria and of larger
informa-tional capacity (three clusters joining 6, 9 and 6 variables respectively).
6. Factor model suggests the adoption of criteria
of more detailed and homogenous character
(4 factors loaded by 6, 5, 2 and 3 variables respectively).
7. Factor model classifies the smaller number of variables than the cluster model (15 to
-wards 21).
8. All obtained criteria are reliable. This con
-cerns both the clusters and the factors. For the last factor (cost factor) the reliability is definitely the lowest.
In general, in this paper we demonstrated
the usefulness of multi-dimensional exploratory
methods in the discussed area.
REFERENCES
1. Bevilacqua M. et al., Overview on the application of ISO/TS 16949:2009 in a worldwide leader com
-pany in the production of stainless steel tubes for automotive exhaust systems. International Journal of Manufacturing Technology and Management; 7 (4), 2011, 410-439.
2. Cattell R., A note on correlation clusters and cluster search methods. Psychometrica; 9, 1944, 169-184. 3. Cattell R., The Scree Test for the Number of Factors.
Multivariate Behavioral Research; 1, 1966, 245-276. 4. Franceschini F., Maisano D., Standardisation of
quality and reliability tests in the auto-parts in
-dustry: a structured approach concerning thermal systems. Total Quality Management and Business Excellence; 12, 2015, 1269-1281.
5. Garvin D., Competing on the Eight Dimensions of Quality. Harvard Business Review; 6, 1987, 65. 6. Hoyle D., Automotive Quality Systems Handbook.
Elsevier, 2005.
7. Jang G.-S., Choi J.-S, Parts supply management system for automobile parts manufacturing compa
-nies. Asian Journal on Quality; 4, 2003, 213-221. 8. Jie M., Horie M., Auto Parts Suppliers Under
9. Kaiser H., The Varimax Criterion for Analytic Ro
-tation in Factor Analysis. Psychometrika; 23, 1958, 187-200.
10. Karpiel Ł., Skrzypek M., Towaroznawstwo ogólne. Wydawnictwo Akademii Ekonomicznej w Kra
-kowie, Kraków, 2000.
11. Kindlarski E., Jakość wyrobów. PWN, Warszawa, 1998.
12. Kotarbiński T., Traktat o dobrej robocie. Ossoline
-um, Łódź, 1955.
13. Lawley D., Maxwell A., Factor Analysis as a Sta
-tistical Method. Butterworth, London, 1963. 14. Lin C. et al., Research on Solder Joints Quality De
-tection of Auto Parts Based on Biological Vision Feature. Advanced Materials Research; 712-715, 2013, 2385-2388.
15. Lotko M., Lotko A., Cluster Analysis of Knowl
-edge Workers’ Assessment of Occupational Threats and Attitudes to Character of Work. Eksploatacja i Niezawodnosc - Maintenance and Reliability; 17 (1), 2015, 80-89.
16. Lotko M., Lotko A., Jakościowe kryteria doboru części do samochodów osobowych, ITeE-PIB, Ra
-dom, 2016.
17. Łuczak J., System zarządzania jakością dostaw
-ców w branży motoryzacyjnej – analiza istotności wymagań. Wyd. Akademii Ekonomicznej w Poz
-naniu, Poznań, 2008.
18. Łunarski J., Zarządzanie jakością. Standardy i zasady. Wydawnictwa Naukowo-Techniczne, Warszawa, 2008.
19. Mazurkiewicz J., Banaszak I., Wierzbicka M., Efektywność systemu zarządzania jakością ISO/TS 16949. Ekonomika i Organizacja Przedsiębiorstwa; 4, 2010, 72-79.
20. Mzalwane A., Susila M., Shamsuddin A., Automo
-tive Parts Manufacturing Industry: Unravelling the Efficacious Quality Framework. Interdisciplinary Journal of Contemporary Research in Business; 4 (3), 2012, 217-226.
21. Prussak W., Zarządzanie jakością. Wybrane el
-ementy. Wydawnictwo Politechniki Poznańskiej, Poznań, 2006.
22. Punnakitikashem P. et al., A study of quality man
-agement practices in TQM and non-TQM firms: Findings from the ASEAN automotive industry. International Journal of Quality & Reliability Man
-agement; 27 (9), 2010, 1021-1035.
23. Skrzypek E. (ed.), Dojrzałość jakościowa a wyniki przedsiębiorstw zorientowanych projakościowo, Difin, Warszawa, 2013.
24. Teli S. et al., Assessment of supplier quality cost in automobile industry. International Journal of Manufacturing Technology and Management; 4 (1), 2014, 1-20.
25. Thurstone L., Multiple Factor Analysis. University of Chicago Press, Chicago, 1947.
26. Tryon R., Cluster Analysis. McGraw-Hill, New York, 1939.
27. Urbaniak M., Zarządzanie jakością. Teoria i prak
-tyka. Difin, Warszawa, 2004.
28. Urbaniak M., Kierunki doskonalenia systemów zarządzania jakością, Wydawnictwo Uniwersytetu Łódzkiego, Łódź, 2010.
29. Zhang Q., Returnable packaging management in automotive parts logistics: Dedicated mode and shared mode. International Journal of Production Economics; 168, 2015, 234-244.