Abstract
Background: There are several well established scores for the assessment of the prognosis of major trauma patients that all have in common that they can be calcu-lated at the earliest during intensive care unit stay. we intended to develop a sequential trauma score (STS) that allows prognosis at several early stages based on the information that is available at a particular time. Study Design: In a retrospective, multicenter study us-ing data derived from the Trauma Registry of the Ger-man Trauma Society (2002-2006), we identified the most relevant prognostic factors from the patients ba-sic data (P), prehospital phase (a), early (B1), and late (B2) trauma room phase. Univariate and logistic re-gression models as well as score quality criteria and the explanatory power have been calculated.
Results: a total of 2,354 patients with complete data were identified. from the patients basic data (P), logis-tic regression showed that age was a significant predic-tor of survival (aUcmodel P, area under the curve = 0.63). logistic regression of the prehospital data (a) showed that blood pressure, pulse rate, Glasgow coma scale (GcS), and anisocoria were significant predictors (aUcmodel a = 0.76; aUcmodel P + a= 0.82). logistic regression of the early trauma room phase (B1) showed that peripheral oxygen saturation, GcS, anisocoria, base excess, and thromboplastin time to be significant predictors of survival (aUcmodel B1 = 0.78; aUcmodel P + a + B1= 0.85). Multivariate analysis of the late trauma room phase (B2) detected cardiac massage, abbreviated injury score (aIS) of the head ≥3, the maximum aIS, the need for transfusion or massive blood transfusion, to be the most important predictors (aUcmodel B2 = 0.84; aUcfinal model P + a + B1 + B2= 0.90). The explanatory power – a tool for the assessment of the relative impact of each segment to mortality – is 25% for P, 7% for a, 17% for B1 and 51% for B2. a spreadsheet for the easy calculation of the sequen-tial trauma score is available at:
www.sequential-trauma-score.com
Conclusions:This score is the first sequential, dynamic score to provide a prognosis for patients with blunt major trauma at several points in time. with every ad-ditional piece of information the precision increases. The medical team has a simple, useful tool to identify patients at high risk and to predict the prognosis of an individual patient with major trauma very early, quickly and precisely.
Key words:Major trauma; outcome; prognosis; scoring; score; severely injured patients; polytrauma; dynamic score; ISS; TRISS; RISc; STS
I
nTRoDUcTIonTrauma is one of today’s most relevant health issues. In 2005 for example, a total of 173,753 deaths in the US were classified as injury-related. with a rate of 196.8 deaths/100,000 population it was the leading cause of death up to the age of 54 in 2005 [1]. The in-cidence has constantly increased over past years [1].
characterization of the severity of injury is crucial for the scientific study of trauma, triage, classification of patients, quality management and the assessment of prognosis (prediction of mortality of an individual pa-tient) [2-4]. In the scoring of the severity of trauma, mortality is the outcome that is of the most interest. Scores try to summarize and integrate a patient’s con-dition into a one-dimensional value depending on many independent factors. More than 50 score sys-tems have been published for the classification of in-jured patients in emergency or intensive care medicine. This large number indicates that prediction of out-come is and never will be perfect because severity of injury is complex and difficult to quantify [3].
There are several well established scores for the as-sessment of the prognosis of patients with major trau-ma [2, 4]. In 1974 the injury severity score (ISS) was introduced,[5] based on an anatomic classification, the abbreviated injury scale (aIS) introduced in 1971 [6]. It can be stated that the ISS is one of the most com-monly used trauma score [2, 4].
The trauma score (TS) of 1981 and its further de-velopment, the revised trauma score (RTS, 1989) in-cluded physiologic variables such as the Glasgow coma
Eur J Med Res (2010) 15: 185-195 © I. Holzapfel Publishers 2010
T
HE
S
EqUEnTIal
T
RaUMa
S
coRE
– a n
Ew
I
nSTRUMEnT foR THE
S
EqUEnTIal
M
oRTalITy
P
REDIcTIon In
M
aJoR
T
RaUMa
*
S. Huber-wagner1, J. Stegmaier1, P. Mathonia1, T. Paffrath2, E. Euler1, w. Mutschler1, K.-G. Kanz1, R. lefering3, on behalf of the working Group on Polytrauma (nIS) of the German Trauma Society (DGU)**
1Munich University Department of Trauma Surgery – campus Innenstadt, ludwig-Maximilians-University, Munich, Germany 2Department of Trauma and orthopedic Surgery, University of witten/Herdecke, cologne-Merheim Medical center, cologne, Germany
3IfoM – Institute for Research in operative Medicine,
University of witten/Herdecke, cologne-Merheim Medical center, cologne, Germany
scale (GcS), blood pressure, and respiratory rate [7, 8]. Since it was recognized that both the anatomic and the physiologic variables contain important prognostic formation Boyd et al. [9] introduced the trauma and in-jury severity score (TRISS) in 1987 that combined both aspects. TRISS was widely adopted and as well as ISS, is one of the most commonly used trauma scores [2, 4]. In 1996 osler et al. [10] introduced the “interna-tional classification of disease-9 based injury severity score” (IcISS). Its assessment of the pattern of injury is not based on the aIS but on the International classi-fication of Diseases, 9th revision [11]. In 1997 the new injury severity score (nISS) was introduced, that inte-grates several injuries of one anatomic region, com-pared with the ISS [12]. In 1990 champion et al. [13] published a further attempt to improve the prediction of outcome of trauma; the “a severity characterization of trauma” score (aScoT) in which the assessment of the injury pattern was modified compared with the TRISS. In 2001 Rixen et al. [14] introduced a score based on the Trauma Registry of the German Trauma Society (DGU), which for the first time evaluated and integrated the prognostic power of the base excess and the thromboplastin time [15, 16].
To increase the applicability and the predictive ac-curacy, the Institute for Research in operative Medi-cine (IfoM) at the University of witten/Herdecke in cologne, Germany, recently developed a new score, the Revised Injury Severity classification score (RISc). This score is based on the data of the trauma registry of the DGU. The RISc comprises more variables than the TRISS. If there are missing values, other variables are substituted, for example, if partial thromboplastin time is missing thromboplastin time is substituted. RISc-adjusted outcome benchmarking has been rou-tinely reported in the annual report of the trauma reg-istry since 2003 [17-21]. quite recently osler at al. [22] published a new trauma mortality prediction model based on the anatomic injury scale. This precise score has been developed on 702,229 patients derived from the national trauma data bank of the american col-lege of Surgeons, committee on Trauma.
all these scores are static as they can be calculated at one (late) time. The TS and the RTS can be used be-fore the patient is admitted to hospital. The more complex scores (ISS, TRISS, IcISS, nISS, aScoT, Rixen score, RISc score, and the TMPM-score by osler) can be calculated usually during early intensive care unit (IcU) stay after all injuries have been identi-fied and classiidenti-fied. This is sufficient for many potential applications but a prognosis cannot be provided by the scores during the early period of resuscitation.
The primary aim of this study was to develop a se-quential, dynamic score that allows a prognosis at sev-eral early stages based on the information that is avail-able at a particular time. The precision of the progno-sis should increase step by step because of the increas-ing additional information. Based on easily available routine data the medical team should be aided by a simple and useful tool to identify patients at high risk and to predict the prognosis of an individual major trauma patient very early.
a secondary aim was to analyse the explanatory power and the impact of the different segments
inves-tigated (patients basic data, prehospital phase, and ear-ly and late trauma room phase) to be able to assess the relevance of the sectors.
we hypothesized that it is possible to develop, eval-uate, and validate such a score based on the analysis of the data of the Trauma Registry of the German Trau-ma Society.
M
ETHoDSDaTacollEcTIon
The Trauma Registry of the German Trauma Society (DGU) was initiated in 1993 by the society’s working Group on Polytrauma to collect data on patients with polytrauma within German-speaking countries (Ger-many, austria, and Switzerland). This trauma registry is a prospective, multicenter, standardized, and anonymized, documentation of severely injured pa-tients. Basic facts about the patient (P), prehospital (a), and treatment in the trauma room (B), and the subsequent course in the IcU (c), and scoring and outcome data (D) are entered continuously to a web-based data server. Every injured patient admitted to one of the participating trauma hospitals*** with an injury severity score (ISS) of 16 or more, or IcU treat-ment is docutreat-mented. Data are submitted to a central database at the Institute for Research in operative Medicine (IfoM) at the University of witten/ Herdecke in cologne. Irreversible anonymity of data is guaranteed both for the individual patient and the participating hospital, so the registry comprises epi-demiologic, physiologic, laboratory, diagnostic, opera-tive, interventional, and intensive care medical data as well as scoring and outcome data [23].
we analyzed the database for 2002-2006 that con-tained 17,935 patients. Exclusion criteria were ISS < 9 (minus 2,424 patients), and patients who were trans-ferred from other hospitals (minus 2,963 patients). af-ter the exclusion criaf-teria had been applied 12,548 pa-tients remained for analysis.
STaTISTIcalanalySIS
Retrospective statistical analysis was performed in sev-eral steps.
1. The data were screened to identify different, poten-tially appropriate variables with prognostic power to-wards the target variable mortality (descriptive and bi-variate analysis after dichotomization, c2test was used (without continuity correction), cut off p-value <0,05). Survival was defined as survival to discharge. according to the structure of the Trauma Registry the different segments for the score have been defined as basic patient data (P), prehospital phase (a), early trau-ma room phase (B1) and late trautrau-ma room phase (B2).
The patients basic data P (dichotomized)comprised age ≥ 60 vs. < 60 years, male vs. female sex, and presence vs. no presence of pre-existing diseases.
ob-tained by pulse oximetry (Spo2) ≥ 90 vs. < 90%, in-sertion vs. no inin-sertion of a chest tube, systolic blood pressure ≥ 90 vs. < 90 mmHg, pulse rate ≥ 120 vs. < 120/min, closed chest cardiac massage (cccM) vs. no cccM, amount of volume substitution ≥ 2000 vs. < 2000 ml, GcS > 8 vs. ≤ 8 and anisocoria vs. no anisocoria, all on-scene. anisocoria was defined as pupillary inequality or both pupils dilated and fixed to light (pupillary dysfunction).
The early trauma room phase parameter B1 (dichotomized) comprised oxygen saturation (Spo2) ≥ 90 vs. < 90%, horowitz coefficient (pao2/fio2) ≥ 300 vs. < 300, systolic blood pressure ≥ 90 vs. < 90 mmHg, pulse rate ≥ 120 vs. < 120/min, haemoglobin concentration > 8 vs. ≤ 8 g/dl, base excess > -8 vs. ≤ -8, thrombo-plastin time ≥ 50 vs. < 50%, GcS > 8 vs. ≤ 8, aniso-coria vs. no anisoaniso-coria and temperature ≥ 35 vs. < 35°c, all on admission to the trauma room.
The late trauma room phase parameter B2 (dichotomized) comprised ISS ≥ 16 vs. < 16, ISS ≥ 25 vs. < 25, maximum of the aIS (4 or 5) vs. aIS less than maxi-mum (1-3), aIShead≥ 3 vs. < 3, aISthorax≥ 3 vs. < 3, aISabdomen≥ 3 vs. < 3, aISextremities≥ 3 vs. < 3, cccM vs. no cccM, need vs. no need for blood transfusion, need vs. no need for massive blood transfusion (≥ 10 units of packed red blood cells) and need vs. no need for emergency operation (interruption of trauma room diagnostics), all during the treatment in the trauma room until transfer to the IcU or operating theatre (oR).
2. after the screening only those patients with com-plete data for all mentioned, significant variables were analysed (descriptive and bivariate analysis, same di-chotomization, target variable = mortality; c2 test). Variables with high rates of missings have been ex-cluded.
3. The data were randomized (ratio of 3:1) to obtain a development and a validation data set. The data sets were compared to detect potential differences using Student’s t-test or c2 test as appropriate (both two sided).
4. The obtained variables were included into logistic regression models with the target variable being mor-tality (stepwise forward) as follows: model P, a, P+a, B1, P+a+B1, B2, and final model P+a+B1+B2.
5. Score quality parameters were calculated as discrimi-nation parameters (prognosis of survivors and non-survivors, difference between survivors and non-sur-vivors, sensitivity, specificity, overall accuracy, nagelk-erkes R2 [24], area under the curve (aUc) of the re-ceiver operating characteristic (Roc)), precision para-meters (observed vs. predicted score mortality) and calibration parameters (Goodness of fit statistics ac-cording to Hosmer-lemeshow [25]). as a reference the quality parameters have also been calculated for the TRISS and the RISc score.
6. In a further step the explanatory power was calcu-lated, so that we were able to assess the proportion of
the predictive power of the different segments that can be explained by the model rather than by varia-tion. This is reflected by the nagelkerkes R2 of the named segments [24]. when the R2of the full logistic regression model (P+a+B1+B2) minus the variables of model P is calculated, the difference (D) of R2from the full model can be calculated. Done in a similar way for the other three segments this enables one to calcu-late the proportion of each in relation to the sum of all four Ds (= 100%). The explanatory power - a tool
for the assessment of the relative impact of every seg-ment to mortality – can be determined [26].
7. In a final step the score formula were integrated into an Excel spreadsheet. The score prognosis of a given patient can therefore be calculated automatically and quite easily on the internet. a spreadsheet for the easy calculation of the sequential trauma score is available at: www.sequential-trauma-score.com
95% confidence intervals (cI 95%) have been calcu-lated where appropriate. Statistical significance was as-sessed at p < 0.05. Statistical analysis was performed using SPSS Version 15.0 (SPSS Inc., chicago, Il, USa).
R
ESUlTSafter the exclusion criteria had been applied 12,548 patients remained for analysis. These patients had a mean age of 42.5 ± 20.7 (standard deviation, SD) years, 72.8% were male, 94.5% sustained blunt trauma, the mean ISS was 26.0 ± 13.9 and the overall mortality rate was 16.5%. Bivariate testing showed that all of the variables were significantly related to mortality (p<0.001 in each case, step 1) with the exception of trauma mechanism and aISthoraxwhich therefore have been excluded. The missing rates varied from 0% (age, sex, ISS, aIS) to 6,8% (GcS), to 12,6% (pupillary dys-function), to 20,2% (thromboplastin time) and up to 59,1% for the base excess. The variables temperature and Horowitz coefficient (missings of 75,3% and 81,6% respectively) have been taken out (step 2).
The remaining variables were then operated to the 12,548 patients giving a total of n = 2,354 patients with complete data of all variables included (= 18.8%; 2,354/12,548). The characteristics of these 2,354 pa-tients are listed in Table 1.
Bivariate testing showed that all variables were sig-nificantly related to mortality (p<0.001, cut off p-val-ue <0,05) with the exception of sex (p = 0,24), of in-sertion of a chest tube (p = 0,16), prehospital volume substitution (p = 0,64) and aISabdomen(p = 0,66) which therefore have been excluded from the logistic regres-sion.
Randomization of the 2,354 patients with a ratio of 3 : 1 led to a development data set with 1,760 patients and a validation data set of 594 patients. There were no significant differences between the two data sets when they were compared (p-values >0.05 in each case, step 3).
(prehospital phase) with 7 variables (intubation, oxy-gen saturation, blood pressure, pulse rate, cccM, GcS, and anisocoria), model B1 (early trauma room phase) with 8 variables (oxygen saturation, blood pres-sure, pulse rate, haemoglobin level, base excess, thromboplastin time, GcS, and anisocoria) and model B2 (late trauma room phase) with 8 variables (cccM, blood transfusion, massive transfusion, emergency op-eration, ISS ≥ 16, ISS ≥ 25, aIShead, and aISmax). The variable aISextremities has been taken out manually. It seems that a high aIS of the extremities is rather pro-tective than predictive of mortality because limb in-juries are in most cases not life-threatening. Table 2 shows the relevant variables that were included by the respective models for each segment. nine variables have been included in the final model in which one
variable is from segment P (age), two from the prehos-pital phase a (GcS and anisocoria), three from the early trauma room phase B1 (base excess, thrombo-plastin time and anisocoria) and three from the late trauma room phase B2 (cccM, massive transfusion and aISmax = 4 or 5). The score calculation formulas are shown in the appendix.
Tables 3 and 4 show the quality parameters of the different models (development and validation data set). The models are increasingly able to discriminate between survivors and non-survivors, the specificity is high, the aUc of the Roc of 0.90 (95% cI 0.88-0.92, final model P+a+B1+B2) is significantly higher than that of TRISS and comparable to that of RISc. The Rocs of the different models are shown in figure 1 and 2. The precision parameters indicate that observed Table 1.characteristics of the 2,354 major trauma patients with complete data of all included variables.
n...2,354
Characteristic ...Mean (± SD) or No (%) Basic patient data (P)
age (years) ... 41.6 ± 19.9 Male sex ... 1,741 (74.0) Pre-existing disease ... 805 (34.2)
Prehospital (A)
Blunt trauma ... 2,264 (96.2) Intubation rate... 1,359 (57.7) Peripheral oxygen saturation (Spo2, %)...93.0 ± 8.3 chest tube insertion rate... 148 (6.3) Systolic blood pressure (mmHg)...119.7 ± 30.1 Pulse rate (beats/min) ... 94.6 ± 21.1 cccM rate ...31 (1.3) amount of volume substitution (ml)...1452.9 ± 942.0 GcS on-scene (points) ...11.1 ± 4.5 Rate of anisocoria ...384 (16.3)
Trauma Room / In hospital (B)
oxygen saturation (Spo2, %)...97.1 ± 4.8 Systolic blood pressure (mmHg)...122.6 ± 28.3 Pulse rate (beats/min) ... 90.2 ± 19.6 Haemoglobin concentration (g/dl) ...11.6 ± 2.6 Base excess...-3.2 ± 4.2 Thromboplastin time (%) ... 77.8 ± 22.0 GcS on admission (points) ... 7.6 ± 5.4 Rate of anisocoria... 319 (13.6) cccM rate ... 70 (3.0) Transfusion rate... 800 (34.0) Rate of massive blood transfusion until IcU (≥ 10 PRBc)... 208 (8.8) Emergency operation rate (interruption of trauma room diagnostics) ... 136 (5.8) ISS (points)... 26.8 ± 13.0 nISS (points) ... 32.8 ± 15.4 aIS head ≥ 3... 1,166 (49.5) aIS thorax ≥ 3 ... 1,321 (56.1) aIS abdomen ≥ 3... 476 (20.2) aIS extremities ≥ 3 ... 985 (41.8) overall mortality rate... 305 (13.0)
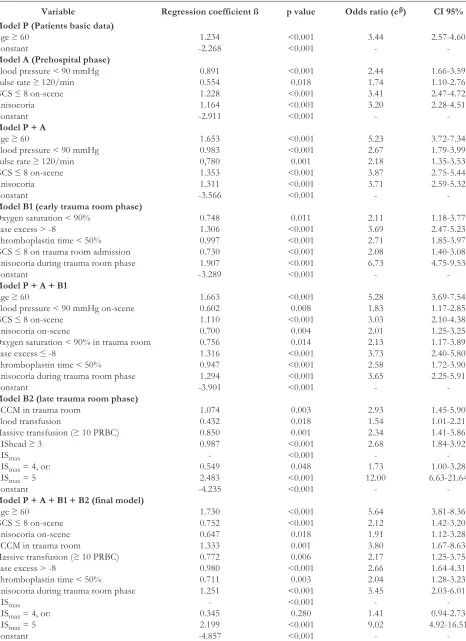
Table 2.logistic Regression models P, a, P+a, B1, P+a+B1, B2, and P+a+B1+B2.
Variable Regression coefficient ß p value Odds ratio (eb) CI 95%
Model P (Patients basic data)
age ≥ 60 1.234 <0.001 3.44 2.57-4.60
constant -2.268 <0.001 -
-Model A (Prehospital phase)
Blood pressure < 90 mmHg 0.891 <0.001 2.44 1.66-3.59
Pulse rate ≥ 120/min 0.554 0.018 1.74 1.10-2.76
GcS ≤ 8 on-scene 1.228 <0.001 3.41 2.47-4.72
anisocoria 1.164 <0.001 3.20 2.28-4.51
constant -2.911 <0.001 -
-Model P + A
age ≥ 60 1.653 <0.001 5.23 3.72-7.34
Blood pressure < 90 mmHg 0.983 <0.001 2.67 1.79-3.99
Pulse rate ≥ 120/min 0,780 0.001 2.18 1.35-3.53
GcS ≤ 8 on-scene 1.353 <0.001 3.87 2.75-5.44
anisocoria 1.311 <0.001 3.71 2.59-5.32
constant -3.566 <0.001 -
-Model B1 (early trauma room phase)
oxygen saturation < 90% 0.748 0.011 2.11 1.18-3.77
Base excess > -8 1.306 <0.001 3.69 2.47-5.23
Thromboplastin time < 50% 0.997 <0.001 2.71 1.85-3.97
GcS ≤ 8 on trauma room admission 0.730 <0.001 2.08 1.40-3.08
anisocoria during trauma room phase 1.907 <0.001 6.73 4.75-9.53
constant -3.289 <0.001 -
-Model P + A + B1
age ≥ 60 1.663 <0.001 5.28 3.69-7.54
Blood pressure < 90 mmHg on-scene 0.602 0.008 1.83 1.17-2.85
GcS ≤ 8 on-scene 1.110 <0.001 3.03 2.10-4.38
anisocoria on-scene 0.700 0.004 2.01 1.25-3.25
oxygen saturation < 90% in trauma room 0.756 0.014 2.13 1.17-3.89
Base excess ≤ -8 1.316 <0.001 3.73 2.40-5.80
Thromboplastin time < 50% 0.947 <0.001 2.58 1.72-3.90
anisocoria during trauma room phase 1.294 <0.001 3.65 2.25-5.91
constant -3.901 <0.001 -
-Model B2 (late trauma room phase)
cccM in trauma room 1.074 0.003 2.93 1.45-5.90
Blood transfusion 0.432 0.018 1.54 1.01-2.21
Massive transfusion (≥ 10 PRBc) 0.850 0.001 2.34 1.41-3.86
aIShead ≥ 3 0.987 <0.001 2.68 1.84-3.92
aISmax - <0.001 -
-aISmax= 4, or: 0.549 0.048 1.73 1.00-3.28
aISmax= 5 2.483 <0.001 12.00 6.63-21.64
constant -4.235 <0.001 -
-Model P + A + B1 + B2 (final model)
age ≥ 60 1.730 <0.001 5.64 3.81-8.36
GcS ≤ 8 on-scene 0.752 <0.001 2.12 1.42-3.20
anisocoria on-scene 0.647 0.018 1.91 1.12-3.28
cccM in trauma room 1.333 0.001 3.80 1.67-8.63
Massive transfusion (≥ 10 PRBc) 0.772 0.006 2.17 1.25-3.75
Base excess > -8 0.980 <0.001 2.66 1.64-4.31
Thromboplastin time < 50% 0.711 0.003 2.04 1.28-3.23
anisocoria during trauma room phase 1.251 <0.001 3.45 2.03-6.01
aISmax - <0.001 -
-aISmax= 4, or: 0.345 0.280 1.41 0.94-2.73
aISmax= 5 2.199 <0.001 9.02 4.92-16.51
constant -4.857 <0.001 -
and predicted prognoses are congruent. The
calibra-tion parameters show that the models are well calibrat- ed as low Hosmer-lemeshow-goodness of fit valuesand non-significant (!) p-values indicate good
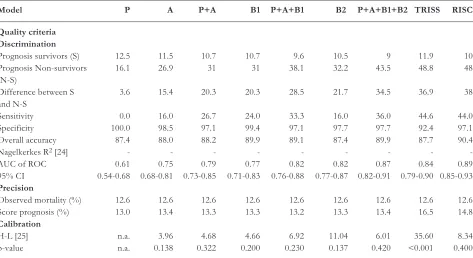
calibra-Table 3.quality parameter of the different models (n = 1,760, development data set).
Model P A P+A B1 P+A+B1 B2 P+A+B1+B2 TRISS RISC
Quality criteria Discrimination
Prognosis survivors (S) 12.5 11.1 10.3 10.3 9.2 9.6 8 13.4 10
Prognosis non-survivors 16.8 25.9 31.2 31.2 38.7 33.8 46.9 49 48.8
(n-S)
Difference between S 4.3 14.8 20.9 20.9 29.5 24.2 38.9 35.6 38.8
and n-S
Sensitivity 0 13.0 23.5 25.2 34.3 18.3 40.9 47.4 43.5
Specificity 100 98.4 97.8 98.9 98.1 98.3 98.2 91.6 96.2
overall accuracy 86.9 90.0 88.1 89.3 89.8 87.8 90.7 86.0 89.3
nagelkerkes R2[24] 0.07 0.21 0.29 0.27 0.38 0.34 0.49 n.a. n.a.
aUc of Roc 0.63 0.76 0.82 0.78 0.85 0.84 0.90 0.85 0.90
95% cI 0.59-0.67 0.72-0.79 0.79-0.85 0.75-0.82 0.82-0.88 0.81-0.87 0.88-0.92 0.82-0.88 0.89-0.92 Precision
observed mortality (%) 13.1 13.1 13.1 13.1 13.1 13.1 13.1 13.1 13.1
Score prognosis (%) 13.1 13.1 13.1 13.1 13.1 13.1 13.1 18.0 15.1
Calibration
H-l [25] n.a. 1.34 5.29 2.36 4.19 4.66 11.48 136.10 17.30
p-value n.a. 0.511 0.259 0.500 0.522 0.701 0.120 <0.001 0.027
P Patients basic data; a Prehospital phase; B1 early trauma room phase; B2 late trauma room phase; TRISS trauma and injury severity score, RISc revised injury severity classification score; S survivors; n-S non-survivors; aUc area under the curve. Roc receiver operating characteristic; cI confidence interval; H-l Goodness of fit statistics according to Hosmer and lemeshow [25]; n.a. not applicable
Table 4. quality parameter of the different models (n = 594, validation data set).
Model P A P+A B1 P+A+B1 B2 P+A+B1+B2 TRISS RISC
Quality criteria Discrimination
Prognosis survivors (S) 12.5 11.5 10.7 10.7 9.6 10.5 9 11.9 10
Prognosis non-survivors 16.1 26.9 31 31 38.1 32.2 43.5 48.8 48
(n-S)
Difference between S 3.6 15.4 20.3 20.3 28.5 21.7 34.5 36.9 38
and n-S
Sensitivity 0.0 16.0 26.7 24.0 33.3 16.0 36.0 44.6 44.0
Specificity 100.0 98.5 97.1 99.4 97.1 97.7 97.7 92.4 97.1
overall accuracy 87.4 88.0 88.2 89.9 89.1 87.4 89.9 87.7 90.4
nagelkerkes R2[24] - - - - - - - -
-aUc of Roc 0.61 0.75 0.79 0.77 0.82 0.82 0.87 0.84 0.89
95% cI 0.54-0.68 0.68-0.81 0.73-0.85 0.71-0.83 0.76-0.88 0.77-0.87 0.82-0.91 0.79-0.90 0.85-0.93 Precision
observed mortality (%) 12.6 12.6 12.6 12.6 12.6 12.6 12.6 12.6 12.6
Score prognosis (%) 13.0 13.4 13.3 13.3 13.2 13.3 13.4 16.5 14.8
Calibration
H-l [25] n.a. 3.96 4.68 4.66 6.92 11.04 6.01 35.60 8.34
p-value n.a. 0.138 0.322 0.200 0.230 0.137 0.420 <0.001 0.400
tion of scores.[2, 4] The same direction of the data is evident for the validation data set (Table 4).
The explanatory power of the four segments was calculated to be 25% for P, 7% for a, 17% for B1 and 51% for B2, indicating that the trauma room phase (B1+B2, 68%) comprises most predictive relevance followed by the patients basic data and the prehospital phase (fig. 3) (step 6).
finally the score formulas have been integrated into an Excel spreadsheet. So the probability of survival for a given patient may be calculated quite easily. www.sequential-trauma-score.com
D
IScUSSIonScoring systems enable the physician to transform complex clinical circumstances into a single number and to translate different severity codes into a com-mon language. The cohort investigated in this study comprises severely and multiply-injured, blunt trauma patients expressed by the high ISS of 26.8 and the nISS of 32.8 respectively. The sequential trauma score (STS) therefore seems to be best suited to patients with “real” major trauma.
In contrast to many other scores the STS comprises the base excess and coagulation variables that have been proved to contain relevant predictive power [14-16, 19]. The score integrates the predictive power of the oxygen saturation obtained by pulse oximetry on admission to the trauma room and pathologic pupil-lary function on-scene as well as on admission which is indicated by the high odds ratios (oR) in the respec-tive logistic regression models. Peripheral oxygen satu-ration has never before been used to predict mortality. In 2006 Raux et al. [27] reported that Spo2 did not add a statistically significant value to other variables to predict trauma mortality in 675 patients which is in contrast to our findings. To the best of our knowledge pupillary function has not previously been evaluated or integrated into major trauma scoring systems. How-ever, in neurosurgery pupillary dysfunction is regarded as an important predictor for the outcome of patients with traumatic brain injury [28-31]. The high rate of severe traumatic brain injuries (aIShead≥ 3) of about 50% in our cohort probably strengthens the predictive effect of the variable “pupillary dysfunction”.
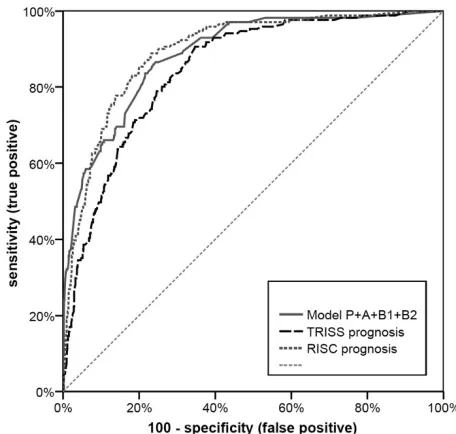
The sequential trauma score is based on results from 2,354 patients. other commonly used scores are clearly based on more patients. for example, the trau-Fig. 1.Receiver operating characteristic curves (Rocs) of the
models P, P+a, P+a+B1 and P+a+B1+B2 (final model). P patients basic data, a prehospital phase, B1 early trauma room phase, B2 late trauma room phase.
Fig. 2. Receiver operating characteristic curves (Rocs) of the final model (P+a+B1+B2), TRISS and RISc. P patients basic data, a prehospital phase, B1 early trauma room phase, B2 late trauma room phase. TRISS trauma and injury severity score, RISc revised injury severity classification score.
ma mortality prediction model by osler [22] is based on 702,229 trauma victims derived from the national trauma data bank. However, the quality criteria of the STS indicate good discrimination, high specificity (98.2%), high overall accuracy (90.7%), and a high aUc of the Roc (0.90) as well as excellent precision and calibration. The STS has better quality criteria than the well-known TRISS and RISc when applied to the investigated cohort. when other well-known scores are applied to the Trauma Registry of the Ger-man Trauma Society (1993-2000, n = 8056) the aUc of the Rocs are at the highest for the Score by Rixen (aUc = 0.88, 95% cI 0.85-0.90), followed by the aS-coT (aUc = 0.85, 95% cI 0.82-0.88), the nISS (aUc = 0.80, 95% cI 0.77-0.84), the ISS (aUc = 0.79, 95% cI 0.75-0.82) and the RTS (aUc = 0.77, 95% cI 0.73-0.80) [19]. This emphasizes that the STS is a simple and improved score compared with these.
The TMPM-score recently introduced by osler [22] shows an aUc of the Roc of 0.93 indicating a very high discrimination quality, but the score comprises in-jury severity, age, gender and mechanism of inin-jury, and no other variables. The national Trauma Data Bank comprises about 75% patients with an ISS of <16 [32]. The mean ISS within the Trauma Registry is 24.5 containing 74% patients with an ISS of greater than 16 [33]. The two collectives (minor and major trauma) are therefore comparable only with limita-tions. with its high overall accuracy and the aUc of the Roc of 0.90 the STS is one of the most precise trauma scores.
To the best of our knowledge the STS is the first sequential, dynamic score that takes the information available at the different described points in time (pa-tients’ basic data, prehospital phase, early and late trau-ma room phase). Its precision increases with every ad-ditional piece of information available later on. If they know the four relevant predictors from the prehospital segment - blood pressure, pulse rate, GcS and pupil-lary function - the medical team at the scene can esti-mate the first assessment of prognosis. on admission to the trauma room the peripheral oxygen saturation and the pupillary function can easily be recorded with-in a structured primary survey accordwith-ing to the aTlS®guidelines [34]. The base excess can be
deter-mined from the first blood gas analysis and the throm-boplastin time should be available about 25 minutes after trauma room admission. after the completion of the diagnostic phase (sonography, X-ray and or cT/whole body cT) in the trauma room it is obvious whether the patient has a severe injury with a maxi-mum aIS code (either aIS = 4 or 5). at this point in time we need to know only whether the patient has an aIS 4 or 5 injury. we can then make a reliable predic-tion of the expected probability of survival before the patient is transferred to the IcU. So the Sequential Trauma Score might help the trauma team to identify critically injured high risk patients earlier. The STS can be seen as a tool to quantify the surgeons “gut feeling” which could be an advantage especially for young, not so experienced trauma team members. The STS could also guide the decision which patient damage control surgery should be applied to. This issue should be evaluated in further studies. we assume that below a
predicted probability of survival of 75% the principles of damage control surgery should at least be consid-ered. To make the STS calculation easy and practicable a spreadsheet has been designed, which is available on-line (see results).
In case of an early death of a trauma patient the STS could be used to estimate whether the death might have been preventable or rather not. This might also help the medical team as a tool for “exculpation”.
To our opinion 7 of the 11 STS variables can prin-cipally be addressed by an appropriate therapy. for ex-ample it should be tried to elevate the blood pressure and reduce tachycardia by differentiated volume thera-py and of course surgical control of the bleeding. low GcS and pupillary dysfunction should be addressed by correct perfusion pressures for the brain, intracranial pressure therapy and by surgical evacuation of in-tracranial hematomas, if indicated. low oxygen satura-tion should be addressed by optimal airway manage-ment and ventilation. low base excess as an indicator for suboptimal tissue perfusion should be addressed by an aggressive anti-shock therapy (volume, transfu-sion, surgical control of the bleeding). low thrombo-plastin time should be addressed by surgical control of the bleeding, rapid transfusion and optimal coagulato-ry management. So the STS not only comprises prog-nostic information but also indicates the most relevant therapeutic targets.
a secondary aim of this study was to calculate the explanatory power of each segment: these were 25% for the patients basic data, 7% prehospital, 17% for early trauma room phase and 51% for late trauma room phase. The patient’s basic data are fixed and not accessible for medical treatment. The small contribu-tion of 7% of the prehospital phase is surprising. This emphasizes that it is quite difficult on-scene to make a correct assessment of the patients “real” condition. with a total of 68% the trauma room phase (B1+B2) seems to have the most impact on mortality. This un-derlines the importance of correct triage of patients with major trauma to be able to transport them to ade-quate facilities with a structured and routine trauma protocol. These calculations are a tool to assess the di-mension of each segment knowing that they indicate results of a mathematical model. To the best of our knowledge similar calculations have not yet been made in trauma management. comparable calculations in in-tensive care medicine have been done by Zimmer-mann et al. [26].
There are several limitations to our study. Because some data were missing from the Trauma Registry the sequential trauma score could be developed on only 2,354 patients. This might bias the results. Because the variable “hypothermia” was rarely recorded it had to be excluded, although its high predictive power has been proved within our and other trauma registries [35, 36]. we decided to cope the problem with the missings by considering only “complete cases” which is necessary for the final multivariate regression mod-el. we declined to use imputation of missing values because this procedure could also lead to a systematic bias.
com-ponent is the only variable that is not significant in the final model. Because it is appropriate to be able to choose between aISmax = 4 or aISmax = 5, and not every severely-injured patient has an injury with an aIS of 5, we left this variable in the final model know-ing that it did not add much additional predictive pow-er.
96.2 of the cohort investigated sustained blunt trau-ma. Thus the STS should not be applied to patients with penetrating trauma.
There is also potentially different intercenter con-sistency in grading injuries (aIS, ISS). another limiting factor is the relatively small size of our validation group. furthermore the generalizability of our results has to be seen critically due to unquantifiable differ-ences of the health care systems in different countries. To address the mentioned last two issues a prospective and external validation of the sequential trauma score outside the Trauma Registry of the German Trauma Society is necessary to verify our findings. This should be done in the future.
In conclusion, the sequential trauma score devel-oped in this study is the first sequential score that pro-vides a prognosis of patients with blunt major trauma at several points in time. with every additional piece of information the precision increases. Based on easy available routine data the medical team has a simple, useful tool to identify patients at high risk and to pre-dict the prognosis of an individual patient with major trauma very early, quickly and precisely.
Statements:
This study has the full approval of the ethics committee of the ludwig-Maximilians-University of Munich (lMU), Ger-many.
There are no conflicts of interest.
There was no funding for this particular study, however, the Trauma Registry of the German Trauma Society (Deutsche Gesellschaft für Unfallchirurgie, DGU) in general was partly funded by the Deutsche forschungsgemeinschaft (DfG) ne 385 / 5 and by a grant of novo nordisk a/S, Bagsvaerd, Denmark.
Dr Huber-wagner declares: I had full access to all the data in the study and had final responsibility for the decision to sub-mit for publication.
Acknowledgements:
**working group on Polytrauma – German Trauma Society (DGU)
Sektion notfall-, Intensivmedizin und Schwerverletztenver-sorgung – nIS – der DGU
chairmen: a. Seekamp, PhD and S. Ruchholtz, PhD; chair-men of working subgroup “Trauma Registry”: R. lefering, PhD and Th. Paffrath, MD.)
***Participating hospitals (alphabetic)
Universitätsklinik der RwTH aachen; Zentralklinikum augsburg; Kreiskrankenhaus Bad Hersfeld; charité - campus Virchow-Klinikum Berlin; Martin-luther-Krankenhaus Berlin; Klinikum Buch; BG-Unfallklinik Berlin-Mahrzahn; Krankenanstalten Gilead Bielefeld; BG-Klinik Bochum Bergmannsheil; Knappschaftskrankenhaus der Ruhr-Universität Bochum; friedrich-wilhelms-Universität Bonn; Zentralkrankenhaus Sankt-Jürgen-Straße Bremen; Zentralkrankenhaus Bremen ost; Klinikum Bremerhaven-Reinkenheide; allgemeines Krankenhaus celle; Klinikum chemnitz; Klinikum Dessau; Klinikum lippe-Detmold;
Krankenhaus Dresden-neustadt; Technische Universität Dresden; Krankenhaus Dresden-friedrichstadt; Heinrich-Heine-Universität Düsseldorf; Klinikum Erfurt; Kreiskrankenhaus Eschwege; Universitätsklinikum Essen; Evang. Krankenhaus lutherhaus Essen; BG Unfallklinik frankfurt / Main; Universitätsklinik frankfurt/Main; Klinikum frankfurt/oder; Klinikum fürth; Johanniter-Krankenhaus Geesthacht; Städtisches Klinikum Görlitz; Klinik an Eichert Göppingen; Georg-august-Universität Göttingen; Universität Graz (Österreich); allg. Unfall -vericherungsanstalt Graz (Österreich); Kreiskrankenhaus Grevenbroich; Universitätsklinik Groningen (niederlande); Kreiskrankenhaus Gummersbach; BG-Unfallkrankenhaus Hamburg; Kreiskrankenhaus Hameln; Medizinische Hochschule Hannover; Krankenhaus Hannover-nordstadt; friederikenstift Hannover; Ev. Krankenhaus Hattingen; orthopäd. Universitätsklinik Heidelberg; St. Bernward Krankenhaus Hildesheim; Universität des Saarlandes Hom-burg / Saar; waldviertel Klinikum Horn (Österreich); lKH Judenburg-Knittelfeld (Österreich); Städt. Klinikum Karl-sruhe; christian-albrechts-Universität Kiel; chirurgischer lehrstuhl der Universität zu Köln; Städt. Klinikum Köln-Merheim; allg. öff. Krankenhaus Krems/Donau (Österreich); Städt. Klinikum St. Georg leipzig; Universität leipzig; Ev. Krankenhaus lengerich; allg. öffentl. Kranken-haus linz (Österreich); Ev. KrankenKranken-haus lippstadt; Univer-sitätsklinikum lübeck; BG Unfallklinik ludwigshafen; St.-Marien-Hospital lünen; Krankenhaus altstadt; Städt. Klinikum Magdeburg; otto-von-Guericke-Universität Magde burg; Johannes-Gutenberg-Universität Mainz; Univer-sitätsklinikum Mannheim; Universität Marburg; Klinikum Minden; Krankenhaus Maria Hilf Mönchengladbach; Klinikum der Universität München – chirurgische Klinik – campus Innenstadt – ludwig-Maximilians-Universität München/lMU; Städt. Krankenhaus München-Harlaching; westfälische wilhelms-Universität Münster; BG-Unfallklinik Murnau; lukaskrankenhaus der Städt. Kliniken neuss; Marienhospital osnabrück; Vogtland Klinikum Plauen; Klinikum Remscheid; Klinikum Rosenheim; Sana-Kranken-haus Rügen; St. Johanns-Spital - landeskrankenSana-Kranken-haus Salzburg (Österr.); Diakonissenkrankenhaus Schwäbisch Hall; Kreis -krankenhaus Soltau; Johanniter-Krankenhaus der altmark Stendal; Kreiskrankenhaus Traunstein; BG-Unfallklinik Tübingen; Bundeswehrkrankenhaus Ulm; Universitätsklinik Ulm; Klinikum der Stadt Villingen-Schwenningen; Klinikum weiden / opfz.; asklepios Kreiskrankenhaus weißenfels; Donauspital wien (Österreich); ferdinand-Sauerbruch-Klinikum wuppertal; Julius-Maximilians-Universität würzburg; Universitätsspital ETH Zürich (Schweiz); Rettungs stelle Zusmarshausen.
R
EfEREncES1. Kung H-c, Hoyert Dl, Xu J, Murphy Sl. Deaths: final Data for 2005. national Vital Statistics Reports of the cDc. 2008;56(10):1-121.
2. lefering R. Trauma Score Systems for quality assess-ment. Eur J Trauma. 2002;28:52-63.
3. Bouillon B, lefering R, Vorweg M, Tiling T, neugebauer E, Troidl H. Trauma score systems: cologne Validation Study. J Trauma. 1997 apr;42(4):652-8.
4. Senkowski cK, McKenney MG. Trauma scoring systems: a review. J am coll Surg. 1999 nov;189(5):491-503. 5. Baker SP, o'neill B, Haddon w, Jr., long wB. The
in-jury severity score: a method for describing patients with multiple injuries and evaluating emergency care. J Trau-ma. 1974 Mar;14(3):187-96.
7. champion HR, Sacco wJ, carnazzo aJ, copes w, fouty wJ. Trauma score. crit care Med. 1981 Sep;9(9):672-6. 8. champion HR, Sacco wJ, copes wS, Gann DS,
Gennarelli Ta, flanagan ME. a revision of the Trauma Score. J Trauma. 1989 May;29(5):623-9.
9. Boyd cR, Tolson Ma, copes wS. Evaluating trauma care: the TRISS method. Trauma Score and the Injury Severity Score. J Trauma. 1987 apr;27(4):370-8.
10. osler T, Rutledge R, Deis J, Bedrick E. IcISS: an interna-tional classification of disease-9 based injury severity score. J Trauma. 1996 Sep;41(3):380-6; discussion 386-8. 11. Rutledge R, fakhry S, Baker c, oller D. Injury severity
grading in trauma patients: a simplified technique based upon IcD-9 coding. J Trauma. 1993 oct;35(4):497-506; discussion 506-7.
12. osler T, Baker SP, long w. a modification of the injury severity score that both improves accuracy and simplifies scoring. J Trauma. 1997 Dec; 43(6): 922-5; discussion 925-6.
13. champion HR, copes wS, Sacco wJ, lawnick MM, Bain lw, Gann DS, Gennarelli T, Mackenzie E, Schwaitzberg S. a new characterization of injury severity. J Trauma. 1990 May;30(5):539-45; discussion 545-6.
14. Rixen D, Raum M, Bouillon B, Schlosser lE, neugebauer E. Predicting the outcome in severe injuries: an analysis of 2069 patients from the trauma register of the German Society of Traumatology (DGU). Unfallchirurg. 2001 Mar;104(3):230-9.
15. Rixen D, Raum M, Bouillon B, lefering R, neugebauer E. Base deficit development and its prognostic signifi-cance in posttrauma critical illness: an analysis by the trauma registry of the Deutsche Gesellschaft fur un-fallchirurgie. Shock. 2001 feb;15(2):83-9.
16. Kroezen f, Bijlsma TS, liem MS, Meeuwis JD, leenen lP. Base deficit-based predictive modeling of outcome in trauma patients admitted to intensive care units in Dutch trauma centers. J Trauma. 2007 oct;63(4):908-13. 17. annual Report of the Trauma Registry of the German
Trauma Society (DGU). working Group on Polytrauma -German Trauma Society (DGU) 2003.
www.traumaregister.de
18. Ruchholtz S, lefering R, Paffrath T, oestern HJ, neuge-bauer E, nast-Kolb D, Pape H-c, Bouillon B. Reduction in Mortality of Severely Injured Patients in Germany. Dtsch arztebl. 2008;105(13):225-31.
19. lefering R. Revised Injury Severity classification (RISc) – Development and validation of a classification system for severely injured patients based on a large trauma reg-istry. [Revised Injury Severity classification (RISc) – En-twicklung und Validierung eines Schweregrad-Klassifika-tionssystems für schwerverletzte Patienten zur anwen-dung in einem nationalen Traumaregister] (Habilitationss-chrift). IfoM - Institut für forschung in der operativen Medizin. cologne: University witten/Herdecke, faculty of Medicine, Germany, 2007. pp. 1-131.
20. Huber-wagner S, lefering R, qvick l, Körner M, Kay M, Pfeifer K, Reiser M, Mutschler w, Kanz K. Effect of whole-body cT during trauma resuscitation on survival: a retrospective, multicentre study. lancet. 2009;373:1455-61.
21. lefering R. Development and validation of the Revised Injury Severity classification (RISc) score for severely in-jured patients. Eur J Trauma Emerg Surg. 2009;35:437-47 22. osler T, Glance l, Buzas JS, Mukamel D, wagner J, Dick a. a trauma mortality prediction model based on the anatomic injury scale. ann Surg. 2008 Jun;247(6):1041-8. 23. Ruchholtz S. The Trauma Registry of the German Society
of Trauma Surgery as a basis for interclinical quality man-agement. a multicenter study of the German Society of Trauma Surgery. Unfallchirurg. 2000 Jan;103(1):30-7.
24. nagelkerke nJD. a note on a general definition of the coefficient of determination. Biometrika. 1991;78:691-2. 25. lemeshow S, Hosmer Dw. a review of goodness of fit
statistics for use in the development of logistic regression models. am J Epidemiol. 1982;115:92-106.
26. Zimmerman JE, Kramer aa, Mcnair DS, Malila fM, Shaffer Vl. Intensive care unit length of stay: Bench-marking based on acute Physiology and chronic Health Evaluation (aPacHE) IV. crit care Med. 2006 oct; 34(10):2517-29.
27. Raux M, Thicoipe M, wiel E, Rancurel E, Savary D, David JS, Berthier f, Ricard-Hibon a, Birgel f, Riou B. comparison of respiratory rate and peripheral oxygen sat-uration to assess severity in trauma patients. Intensive care Med. 2006 Mar;32(3):405-12.
28. Schynoll w, overton D, Krome R, wesolowski D, wang aM, wilson a, coffey M. a prospective study to identify high-yield criteria associated with acute intracranial com-puted tomography findings in head-injured patients. am J Emerg Med. 1993 Jul;11(4):321-6.
29. Murray GD, Butcher I, McHugh GS, lu J, Mushkudiani na, Maas aI, Marmarou a, Steyerberg Ew. Multivari-able prognostic analysis in traumatic brain injury: results from the IMPacT study. J neurotrauma. 2007 feb;24(2): 329-37.
30. Mushkudiani na, Hukkelhoven cw, Hernandez aV, Murray GD, choi Sc, Maas aI, Steyerberg Ew. a sys-tematic review finds methodological improvements nec-essary for prognostic models in determining traumatic brain injury outcomes. J clin Epidemiol. 2008 apr;61(4): 331-43.
31. Hukkelhoven cw, Steyerberg Ew, Habbema JD, farace E, Marmarou a, Murray GD, Marshall lf, Maas aI. Pre-dicting outcome after traumatic brain injury: development and validation of a prognostic score based on admission characteristics. J neurotrauma. 2005 oct;22(10):1025-39. 32. national Trauma Data Bank. annual Report. 2007. 33. annual Report of the Trauma Registry of the German
Trauma Society (DGU). working Group on Polytrauma -German Trauma Society (DGU) 2007.
34. advanced Trauma life Support for Doctors - Student course Manual. 7th Edition ed. chicago: american col-lege of Surgeons, 2004.
35. Martin RS, Kilgo PD, Miller PR, Hoth JJ, Meredith Jw, chang Mc. Injury-associated hypothermia: an analysis of the 2004 national Trauma Data Bank. Shock. 2005 aug;24(2):114-8.
36. Shafi S, Elliott ac, Gentilello l. Is hypothermia simply a marker of shock and injury severity or an independent risk factor for mortality in trauma patients? analysis of a large national trauma registry. J Trauma. 2005 nov;59(5): 1081-5.
Received: November 21, 2009 / Accepted: January 27, 2010
Address for correspondence:
Dr Stefan Huber-wagner
Munich University Hospital (lMU)
Department of Trauma Surgery – campus Innenstadt nussbaumstr. 20
80336 Munich Germany
Phone: +49(0)89/5160-2511 fax: +49(0)89/5160-4934
a
PPEnDIXFormula model P: Probability of survival Ps = 1 - (1 / (1 + EXP(2.268 – 1.234*age≥60)))
Formula model P+A:
Ps = 1 - (1 / (1 + EXP(3.566 – 1.653*age≥60 – 1.353*GcS≤8 – 1.311*anisocoria – 0.983*blood pres-sure<90 – 0.78*pulse rate≥120)))
Formula model P+A+B1:
Ps = 1 - (1 / (1 + EXP(3.901 – 1.663*age≥60 – 0.602*blood pressure<90 – 0.7*anisocoria on-scene – 1.11*GcS≤8 – 1.294*anisocoria in TR – 1.316*base excess≤-8 – 0.756*Spo2<90 – 0.947*thromboplastin time<50%)))
Formula model P+A+B1+B2:
Ps = 1 - (1 / (1 + EXP(4.857 – 1.333*cccM – 0.772*massive transfusion – 0.345*aISmax= 4*(1-aISmax=