R E S E A R C H A R T I C L E
Open Access
Hyperspectral cell sociology reveals spatial
tumor-immune cell interactions associated
with lung cancer recurrence
Katey S. S. Enfield
1*, Spencer D. Martin
1,2, Erin A. Marshall
1, Sonia H. Y. Kung
1, Paul Gallagher
1, Katy Milne
3,
Zhaoyang Chen
1, Brad H. Nelson
3,5, Stephen Lam
1,2, John C. English
4,6, Calum E. MacAulay
1,6, Wan L. Lam
1,6and Martial Guillaud
1Abstract
Background:The tumor microenvironment (TME) is a complex mixture of tumor epithelium, stroma and immune cells, and the immune component of the TME is highly prognostic for tumor progression and patient outcome. In lung cancer, anti-PD-1 therapy significantly improves patient survival through activation of T cell cytotoxicity against tumor cells. Direct contact between CD8+ T cells and target cells is necessary for CD8+ T cell activity, indicating that spatial organization of immune cells within the TME reflects a critical process in anti-tumor immunity. Current immunohistochemistry (IHC) imaging techniques identify immune cell numbers and densities, but lack assessment of cell–cell spatial relationships (or“cell sociology”). Immune functionality, however, is often dictated by cell-to-cell contact and cannot be resolved by simple metrics of cell density (for example, number of cells per mm2). To address this issue, we developed a Hyperspectral Cell Sociology technology platform for the analysis of cell–cell interactions in multi-channel IHC-stained tissue.
Methods:Tissue sections of primary tumors from lung adenocarcinoma patients with known clinical outcome were stained using multiplex IHC for CD3, CD8, and CD79a, and hyperspectral image analysis determined the phenotype of all cells. A Voronoi diagram for each cell was used to approximate cell boundaries, and the cell type of all neighboring cells was identified and quantified. Monte Carlo analysis was used to assess whether cell sociology patterns were likely due to random distributions of the cells.
Results:High density of intra-tumoral CD8+ T cells was significantly associated with non-recurrence of tumors. A cell sociology pattern of CD8+ T cells surrounded by tumor cells was more significantly associated with non-recurrence compared to CD8+ T cell density alone. CD3+ CD8- T cells surrounded by tumor cells was also associated with non-recurrence, but at a similar significance as cell density alone. Cell sociology metrics improved recurrence classifications of 12 patients. Monte Carlo re-sampling analysis determined that these cell sociology patterns were non-random. Conclusion:Hyperspectral Cell Sociology expands our understanding of the complex interplay between tumor cells and immune infiltrate. This technology could improve predictions of responses to immunotherapy and lead to a deeper understanding of anti-tumor immunity.
Keywords:Cell sociology, Hyperspectral imaging, Lung cancer, Immunohistochemistry, T cell, Lung cancer, CD3, CD8, CD79a, Spatial organization
* Correspondence:kenfield@bccrc.ca
Katey S. S. Enfield and Spencer D. Martin are co-first authors.
1Integrative Oncology, British Columbia Cancer Research Centre, Vancouver,
BC V5Z1L3, Canada
Full list of author information is available at the end of the article
© The Author(s). 2019Open AccessThis article is distributed under the terms of the Creative Commons Attribution 4.0
International License (http://creativecommons.org/licenses/by/4.0/), which permits unrestricted use, distribution, and
reproduction in any medium, provided you give appropriate credit to the original author(s) and the source, provide a link to the Creative Commons license, and indicate if changes were made. The Creative Commons Public Domain Dedication waiver
Background
Information obtained from formalin fixed paraffin em-bedded (FFPE) tissues is crucial for clinical management of cancer patients. Standard of care includes routine immuno-histochemistry (IHC) staining of FFPE sections for cancer diagnosis, prognosis, and for guiding choice of therapy [1]. Increasingly, clinical research groups are transitioning to-wards multicolor antibody panels to detect more complex cell phenotypes from a single slide [2]. While this approach offers additional biological information, multicolor staining requires specialized equipment and analysis software. Recently, commercially available multispectral imaging and analysis systems have been developed that can quantify cell types based on target protein expression and assess their localization within epithelial and stromal compartments [3].
These technologies have been instrumental in the ad-vancement of cancer immunology as different immune markers have both prognostic and predictive power. For example, the presence of intratumoral T cells has been associated with improved patient outcomes in multiple cancer types [4–6], leading to increased focus on enhancing the activity of these cells. In the therapeutic setting, some studies have found that PD-L1 staining was associated with improved response to immune checkpoint blockade antibodies [7], which are thought to reverse T cell exhaustion. However, inconsistencies in these studies may be due to the acknowledged highly heterogenous staining of PD-L1, rendering IHC staining difficult to interpret [8–11]. We were intrigued by the possibility that a more detailed analysis relating the spatial relation-ships of specific immune cell subtypes with tumor cells and stroma could enhance the value of IHC in the context of prognostic and predictive biomarker staining.
Methods to understand the complex biology and the prognostic and predictive implications of the many cell types within the tumor microenvironment (TME) are rapidly pro-gressing. Techniques to incorporate spatial information with hyperspectral analysis typically involve identifying specific compartments within the TME [3, 12, 13]. While these methodologies identify clinically relevant compartments and cell densities within them, they are currently severely limited in their ability to reproducibly assess, in an automated fashion, all aspects of tumor architecture and the associ-ated immune cell population. Development of methods to investigate these cell-cell spatial relationships is crucial for advancing our understanding of tumor-immune inter-actions and it is anticipated that this form of analysis will generate a higher-order of useful information that cannot be provided by crude measures of cell density and distribution.
We utilize the term“cell sociology”to conceptualize the morphological observation of adjacency and contiguity between selected target cell populations. This incorporates
the premise that direct cell-cell communication is one in-tegral part of the biological process of anti-tumor immun-ity, exemplified by the complex network of interactions between antigen presenting cells, T cells, and target cells. For example, interactions between CD4+ T cells and CD8+ T cells help determine the level of anti-tumor immunity [14], whereas the interaction between CD8+ PD1+ T cells and PD-L1+ target cells can lead to T cell exhaustion and reduction, if not outright abrogation, of anti-tumor activity [15]. Importantly, quantification of cell sociology has the potential to afford greater prognostic and/or predictive insight on host anti-tumor immunity than has historically been provided by cell density evalu-ation alone.
To this end, we developed the Hyperspectral Cell Sociology platform. This technology images multiplex IHC-stained tissue, quantifies cell subsets, and mea-sures spatial relationships between cell types of interest. The multispectral detector component of this image analysis sytem exploits the ability to detect IHC-linked chromagens that may be difficult to resolve by human microscopic observation due to different (often faint) densities in staining or due to superimposition of multiple-stained structures. This results in a detailed map of cellular topography of any selected tumor area. The individual elements of the map may then be quan-tified and related in a spatial paradigm. As a proof of concept, we illustrate the cell sociology of CD3+ T cells, CD3+ CD8+ T cells, CD79a+ B cells, and unstained cells in full tissue sections of lung adenocarcinoma, revealing novel parameters that are important for anti-cancer immunity.
Methods
Patient tissue accrual
British Columbia Cancer Agency. FFPE tumor tissues (n= 20) were obtained from the Tumor Tissue Repository of the British Columbia Cancer Agency or Vancouver General Hospital under informed written patient consent and with approval from the University of British Columbia
– BC Cancer Agency (BCCA) Research Ethics Board
(Table1).
Multicolor immunohistochemistry
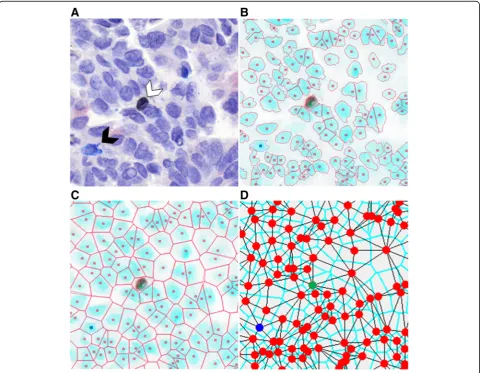
and rinsed with dH2O [16]. Slides were then stained with Mouse AP polymer, Warp Red chromogen, and CAT hematoxylin counter stain. Second round staining included anti-CD79a (SP18/Spring Biosciences), DaVinci Green dilu-ent, Mach 2 Mouse-AP polymer, IP Warp Red chromogen, and 1:5 dilution of CAT hematoxylin counterstain [16]. White light images were analyzed using a Pannoramic Digital Slide Scanner from 3D Histotech and the Pan-noramic Viewer software (v1.15). A representative image is shown in Fig.1a.
Hyperspectral whole slide imaging system
Based on direction from a pulmonary pathologist (JCE), five areas (8000 × 8000 pixels) were investigated from each of 20 whole tissue sections. We developed an in-house
automated hyperspectral whole slide imaging system that consisted of a computer controlled x-y stage (Marzhauser Wetzlar SCAN series), a Zeiss Axioscope 2 Mot plus microscope, a CRI Varispec tunable light filter, an Andor Neo (2 K by 2 K) camera, and a Zeiss 20X (NA 0.75) plan APROCHROMAT objective lens. We acquired images with a pixel sampling spacing of 0.33μm (20X magnifica-tion). The user selected the area to be imaged on the slides and the absorption spectra of the labels (antibodies stain color). Based upon previously recorded stain spectra, the system automatically selected wavelengths to be imaged and collected (using a continuously active focus) up to 16 different spectral images per camera field at 20 nm increments (420 nm–720 nm). Spectral images from a blank area of each of the slides were used for calibration
purposes, and each spectral image was corrected for illumination intensity and uniformity, filter efficiency, and camera fixed pattern noise. Once the area was imaged, the system stitched all overlapping camera fields together to make a seamless hyperspectral image. Regions of interest (ROI) of each image were manually generated, under direction of the pathologist, to encircle predominantly epithelial tumor cell containing areas. This excluded tis-sue artefacts or blank space that could have confounded downstream analysis.
Spectral unmixing
Using the absorption spectra of each antibody and haematoxylin, the stains were computationally unmixed to determine the concentration of each stain for every pixel in the selected area (Additional file 1: Figure S1). The program assumed that every pixel in the flat field and dark field corrected recorded images (16 wavelegths) were a linear combination of the concentration of the individual stains occurring at that pixel weighted by the absorption characteristics of each of the stains occurring at that pixel. When mathematically separating the com-ponents, the program added an addition error term to each pixel to compensate for the electronic and photonic noise in the images. To separate these linear combinations of absorption stains with differing concentration at each pixel, the Multivariate Curve Resolution – Alternating Least Squares algorithm was used (MATLAB R2014a). For this process, the collected hyperspectral image data was log10 transformed and modeled to consist of 4 concentration images (one per stain used) multiplied by the spectra of each stain plus an error term [17, 18]. To use this method, the following were assumed throughout the analysis: (1) the spectra were constant; (2) there were no negative concentrations; and (3) the concentration at each pixel was not required to add to one (denoted as additivity). These assumptions removed the requirement of prior knowledge of the absorption spectra of the glass, stains and tissue, which would be required if the additivity constraint was used.
Image segmentation
Each image was visualized and evaluated for sample quality; areas with a large proportion of empty space were discarded, leaving a total of 94 areas for further analysis. Automatic thresholding for stain positivity and nuclei segmentation were performed as previously described [19] and customized for each image to adjust for variability in the tissue architecture, cellular composition, and stain intensity. To identify individual nuclei, the unmixed haematoxylin image was segmented using multiple itera-tions of increasing stain intensity thresholds with the Otsu algorithm. The first iteration removed small objects (< 50 pixels) and classified large objects (> 1000 pixels) for
additional segmentation iterations. Subsequent iterations used increasing intensity thresholds resulting in increasing segmentation of nuclei. Segmented objects that were > 150 pixels were considered as new separate objects, and segmented objects < 150 pixels were considered part of the original object and reattached to it. After each iteration, segmented objects were processed by a distance transform and watershed algorithms to determine whether the objects required additional segmentation, and objects > 1000 pixels were reprocessed with further, more strigent segmentation (higher thresholds), for up to three itera-tions. Finally, an edge relocation algorithm refined the nuclei boundaries [20] (Fig.1b).
Multicolor stain characteristics of segmented cells
The intensity threshold of each stain within the boundary of segmented nuclei was manually adjusted to differentiate stain positivity from background. Segmented cells were visualized in order of decreasing concentration of the selected antibody intensity, and the user determined the intensity threshold at which true positive cells were differ-entiated from background (Additional file 2: Figure S2). Thresholds were customized for each stain on each slide and applied across all areas imaged from the same slide. A three level binary decision tree was constructed to categorize each cell into a group based on the positivity or negativity of each stain, resulting in eight (23) possible groups (Additional file 3: Figure S3A). During classifica-tion, each cell that was assigned incompatible markers was assessed manually (for example CD3, a T cell marker, co-stained with CD79a, a B cell marker). The majority of double (CD3+ CD79a+) or triple (CD3+ CD8+ CD79a+) positive-stained cells were overlapping T and B cells that could not be differentiated by the segmentation algorithm. Cells within groups corresponding to overlapping T and B cells were processed such that a nucleus was automatically added beside the existing nucleus, and one nucleus was assigned as a T cell and one as a B cell (Additional file3: Figure S3B). However, when evidence of stain positivity of incompatible markers was observed in a single cell (and not in overlapping cells), the cells were excluded from analysis (Additional file 3: Figure S3C). Cells categorized as CD3-CD8+ CD79a+ and CD3-CD8+ were rare and were assigned to the unstained group to preserve the tissue architecture. Most cells in this category were staining artifacts, though some CD3-CD8+ cells may have been CD8+ natural killer cells.
Quantification of cell sociology
the user, and can be conceptualized as a neighborhood in a city. In this analogy, cells in a tissue sample could be considered as houses in a neighborhood, and two adjacent cells would be next-door neighbors. Cell neighbors were identified by first associating a Voronoi polygon to each nucleus, whereby the boundary between cells was posi-tioned at the geometric mean between cell nuclei centers. The Voronoi polygon served as a good approximation of the cell membrane location (Fig.1c). Cell-neighbor infor-mation was calculated for every cell in an imaged area (Fig. 1d), and these specific relationships were used to examine the cell sociology in each tumor.
Cell sociology was quantified by calculating the fre-quency of each cell-cell interaction in each imaged area. Figure 2a shows an example where a given “red” cell has five neighbors: one“red” neighbor (1/5), one“blue” neighbor (1/5), and three“yellow” neighbors (3/5). The neighbor frequency of red cells neighboring the central red cell is 0.2, blue cells neighboring the red cell is 0.2, and yellow cells neighboring the red cell is 0.6. In contrast, Fig.2b shows a more homogeneous example, whereby all neighbors of a given red cell are red, a neighbor frequency of 1.0. The neighbor frequency of each cell-neighbor rela-tionship was calculated for every cell in the imaged area, and a mean neighbor frequency and standard deviation was generated for each unique cell-neighbor relationship in each area. Importantly, the mean neighbor frequency was not a function of the density of a given cell type. For example, if two rare cell types often clustered together (low cell density), the neighbor frequency would be high.
In contrast to algorithms that use pixel distances from target cells to define neighbors, our method assigns neighbors as any cells that shares a Voronoi polygon border, thereby allowing cells of different sizes and distances between nuclei to be assessed as neighbors (Fig.2a-c).
To assess the benefit of cell sociology measures to individual patients, we assessed whether individual ROIs differed from the range covered from the mean ± standard deviation of the recurrent and non-recurrent groups. The minimum and maximum values were calculated for each cell type, and for each ROI, the density and mean neigh-bor frequency were assessed as similar (within the range defined by the means) or different (outside the range of standard deviations). Each ROI that fell within the range by density and outside the range by cell sociology was given a + 1 value, and each ROI that was misclassified by cell sociology was given a−1 value. Values within the range of the standard deviations were assigned a value of zero. These ROI-specific values were then summed for each patient and cell type and displayed as a heatmap (Fig.5).
Monte Carlo analysis of cell sociology
Monte Carlo analysis was performed on the calculated neighbor frequencies scores to determine whether these scores could be expected by random arrangements of the different cell types. The positions of all cells in the imaged area were fixed and the category of each cell position was randomized in 500 in silico simulations, while keeping the number of cells in each category fixed.
This produced a histogram of neighbor frequency scores for each cell – cell interaction from the simulations, thereby allowing the calculation of z-scores for the experi-mental neighbor frequencies. Two hypothetical scenarios depicting a random distribution and a non-random distri-bution illustrate this concept (Additional file4: Figure S4). Highly negative z-scores indicate a tendency towards avoidance while highly positive z-scores indicate a tendency towards co-localization. An absolute z-score value > 3 signifies a non-random neighbor score.
Results
High T cell density is associated with absence of tumor recurrence
Increased T cell density has been associated with non-re-currence and/or survival in most tumor types analyzed to date, including lung cancer [23, 24]. To determine whether our cohort of lung adenocarcinoma samples would be sufficient to demonstrate this prognostic asso-ciation, we assessed the T cell densities in our cohort of eight recurrent and 11 non-recurrent cases (Table 1). Overall survival was the only clinical variable with a statisti-cally significant difference between recurrence groupings (p= 0.005). For each imaged area, we selected a sub-region that contained mostly tumor epithelium, as intraepithelial (versus intrastromal) tumor-infiltrating lymphocytes (TILs)
carry the greatest prognostic significance (with implications for tumor-immune cell sociology below). Firstly, the densities of CD3+ T cells, CD3+ CD8+ T cells, and CD79a+ B cells/plasma cells were assessed. Examples of a recurrent and a non-recurrent case with low and high levels of immune cell infiltration, respectively, are shown in Fig.3a & b. We observed significantly increased densities of both CD3+ CD8- T cells and CD3+ CD8+ T cells in non-recurrent cases of lung adenocarcinoma (p= 0.003 andp= 0.011, respectively). However, density of CD79a+ B cells was not associated with recurrence (p> 0.05) (Fig.4a).
Distinct cell sociology patterns were observed in non-recurrent cases
The primary mechanism of CD3+ CD8+ T cell activity is mediated through direct contact of the T cell receptor on the CD3+ CD8+ T cell with the MHCI/peptide/B2M complex on tumor cells, while anti-tumor activity of CD3+ CD8- T cells is mediated through both contact dependent and independent mechanisms [14]. We hy-pothesized that the frequency of neighboring tumor cells and T cells would be increased in non-recurrent cases. To test this hypothesis, we quantified the neighbor frequencies between unstained cells and CD3+ CD8+ T cells, unstained cells and CD3+ CD8- T cells, and unstained cells and
CD79a+ B cells for all areas (n= 95; 8 non-recurrent and 11 recurrent patients, 5 ROIs per patient). The areas analysed were assessed by a pathologist as containing mostly tumor epithelial cells, so we considered the majority of unstained
cells as tumor cells, though we could not definitively rule out some unstained stromal cell contamination.
non-recurrent cases (p= 0.001, Fig.4b, c), an association that was more significant than CD3+ CD8+ T cell density alone (p= 0.011, Fig. 4a, b). Figure4c shows examples of epithelial cells interacting with other epithelial and immune cells, where the neighbor frequencies of a single tumor cell are visualized by color-coding the neighbor interactions. Even in this small sample set, these results provide intri-guing preliminary data to support the improved prognostic value of cell sociology readouts over cell density alone.
Interestingly, the neighbor frequency of tumor cells with CD3+ CD8- T cell neighbors was also significantly higher in non-recurrent cases (p= 0.008), but the association was at a similar significance level to that observed with CD3+ CD8-T cell density alone (p= 0.003). The lack of increased signifi-cance is concordant with the tumor contact-independent mechanisms of anti-tumor CD3+ CD8- T cell activity [14]. Finally, we found that neither the density nor the neighbor frequency of tumor cells with CD79a+ B cell neighbors was significantly different between recurrent and non-recurrent cases, in agreement with the inconsistent prognostic signifi-cance of B cells in lung signifi-cancer [25–27] (Fig.4a-c).
We then assessed whether cell sociology of tumor cells with CD3+ CD8-, CD79a+, and CD3+ CD8+ immune cell neighbors was able to improve recurrence classification of individual patients as compared to the density of these three cell types. As a baseline, CD3+ CD8+ T cell density in at least one ROI was able to correctly classify eight patients; CD79a+ cell density was able to correctly classify three
patients; CD3+ CD8- T cell density was able to correctly classify two patients; while eight patients were not correctly classified by any density metric. To compare, we then con-sidered the cell sociology of these cell types with tumor cells across the ROIs. Cell sociology of CD3+ CD8+ T cells was able to perform equally as well as density in 17 patients, improve classification of one patient, and misclassified one patient. Cell sociology of CD79a+ cells was able to perform equally well as density in 8 patients, improve classification of six patients, and misclassified three patients. Cell sociology of CD3+ CD8- cells was able to perform equally as well as density in five patients, improve classifi-cation of 10 patients, and misclassified four patients. Taken together, consideration of cell sociology metrics improved classification of 12 patients as compared to density (Fig. 5). This further supports the use of cell sociology metrics as a clinically relevant read-out, which warrants further investigation in larger studies.
To assess whether the observed cell neighbor frequen-cies would be expected due to random distribution of the cells, we applied the Monte Carlo iterative re-sampling method. The majority of the z-scores between unstained (tumor) cells and CD3+ CD8+ T cells were highly sig-nificantly negative (z <−3), indicating a non-random distribution of cells and a tendency towards avoidance (Additional file 5: Figure S5). This suggests that the increased proximity of tumor cells and CD3+ CD8+ T cells observed in non-recurrent cases is indicative of a
biologically relevant immune process associated with dis-ease recurrence. Thus, our pilot study demonstrates the promise of utilizing tumor and immune cell sociology features to improve prognostic accuracy.
Discussion
The quantification of cell-cell interactions and spatial rela-tionships within the tumor architecture is likely to provide more precise biological information compared to cell dens-ities alone, and holds as-of-yet unknown clinical potential. We have developed a novel pipeline for hyperspectral imaging and cell sociology analysis of multiplexed IHC specimens (Fig. 6), and applied it to 100 areas from 20 FFPE tumor sections of lung adenocarcinoma (CD3, CD8, CD79a, haematoxylin). The quantification of cell-cell spatial relationships within the TME allowed a more com-prehensive examination of immune-tumor cell interactions. Our cell sociology analysis revealed that the spatial organization of CD3+ CD8+ T cells within the tumor epi-thelium may provide additional prognostic value compared to CD3+ CD8+ T cell density alone. This research provides a framework for future studies investigating how the spatial context of diverse cell types in the TME could reveal new insights for both biological and clinical studies.
The analysis of tumor architecture and spatial organization of cell-cell interactions in histology specimens is challenging. While two other systems exist to identify neighborhoods, they both rely primarily on distance be-tween nuclei [28, 29]. Our system uses Voronoi tessella-tion, which has the advantage of not requiring arbritrary definitions of neighborhoods (Fig. 2). Since each Voronoi polygon is interpreted as an approximation of the cell boundary, only cells contacting each other (sharing common Voronoi edge) are considered neighbors. This approach accounts for the natural variability in tissue architecture in which cell neighbors can be observed to be closely packed (e.g. clusters of small immune cells) or distant (e.g. disorganized tumor cells) from one an-other (Fig. 2). Despite using different neighborhood concepts, these technologies should provide similar results, though discrepancies could arise when analyzing low frequency cell populations. Further studies are required to compare and validate experimental data generated by these different technologies.
As the complexity of staining panels increases in the quest to improve resolution of cell types, so does the importance of statistical methods to ensure the correct interpretation of results. We incorporated the Monte Carlo iterative re-sampling methodology to provide a z-score indicating that a cell-cell interaction was increased or decreased more than random distribution would antici-apte. Indeed, our results demonstrate that the spatial organization of different cell subsets is highly non-random, likely indicating underlying biological phenotypes. The use
of these and other statistical methods are becoming increasingly important as technology improvements allow for the analysis of whole slide images, that consist of greatly increased cell numbers and exponentially in-creased cell sociology.
The investigation of the prognostic value of immune cell infiltrate in tumors has gained much interest over the last decade, and several new immunotherapies have been approved for treatment of a variety of cancer types [30]. For example in colorectal cancer, the density of CD8+ T cells at the tumor invasive margin (dubbed the
“immunoscore”) is more predictive of outcomes compared to the traditional Tumor; Node; Metastasis (TNM) scoring [6] or microsatellite instability scores [31,32]. Our meth-odology may be used to augment the prognostic value of the immune infiltrate. Despite the limited sample size of our pilot study (n = 20), we demonstrate that the spatial organization of CD3+ CD8+ T cells and unstained cells in tumor epithelial areas is more significantly associated with recurrence than CD3+ CD8+ T lymphocyte density alone. On the patient level, we also find that cell sociology improves the classification of 6/8 non-recurrent and 6/11 recurrent patients when compared to classification by cell density. This reinforces our contention that the addition of cell sociology quantifications to currently available prog-nostic or predictive tools would add advance our insight into anti-tumor immunity. Furthermore, our technology could be used for investigating immune phenotypes in patients receiving immunotherapy. For example, the use of PD-L1 expression as a biomarker for anti-PD1 immuno-therapy response is currently under investigation [33–35], but major challenges have arisen due to staining hetero-geneity [10,11]. PD-L1 may be expressed as a continuum ranging from low to high levels on tumor cells, and on tumor-associated immune cells (macrophages, being a relevant population in this regard). Thresholds for treat-ment are based on combinations of positive tumor cells, and sometimes immune cells, and cut-off points in the treatment algorithm vary with different analytical IHC antibody clones and detection platforms and remain a source of uncertainty for pathologists and oncologists involved in lung cancer [36]. Our cell sociology approach could conceivably identify specific spatial relationships between T cells, other immune cells, and PD-L1 expressing cells with the intention of refining checkpoint blockade immune oncology treatments.
killing function through direct cell-to-cell contact. Indeed, in our analysis, there was no association between absence of recurrence and any immune cell type neighboring any other immune cell type (CD3+ CD8+−T cells, CD3+ CD8- T cells, CD79 + -B cells; data not shown). These data suggest that clusters of immune cells–typically observed in fibrovascular stromal areas juxtaposed to tumor epithe-lium of certain lung cancers– may be less important to tumor rejection than dispersed within the tumor epithe-lium. Additionally, we found that CD3+ CD8- helper T cells were associated with absence of tumor recurrence,
recurrence. Since antibodies produced by B cells circu-late systemically, direct interactions of B cells and tumor cells may not be necessary for anti-tumor B cell activity. Analysis of a larger cohort of lung cancer patients would be required to resolve the more subtle influences that B cells may have on the TME.
Conclusions
We have developed a pipeline for the analysis of cell sociology from hyperspectral IHC images in lung cancer. We believe future studies quantifying cell-cell spatial interactions will generate enhanced biological insight not currently available from cell density information alone. The study of cell sociology could be applied to any number of scenarios such as interactions between immune cells and tumor cells, different subclonal tumor cells, and tumor cells and stromal cells. Cell sociology has broad cross-dispiplinary applications, and is powerful tool for the understanding of biological events in which cell-cell spatial interactions dictate functionality, including cancer immunology.
Additional files
Additional file 1:Figure S1.Spectral unmixing. An example of a region
of interest captured by white-light imaging (top left). The subsequent panels represent the concentration maps of the spectrally unmixed hyperspectral image for all spectra of interest: haematoxylin, CD79a (red), CD3 (blue), CD8 (brown), and black artifacts. (TIF 1141 kb)
Additional file 2:Figure S2.Histogram of the integrated intensity
values of a given stain. The histogram represents the number of segmented cells (y-axis) as a function of integrated stain intensity (II3) (x-axis, max = 0, min = 255). In this example, cells below a threshold of 234 are considered positively stained (blue), while those above a threshold of 234 are negative (red). (TIF 102 kb)
Additional file 3:Figure S3.Cell categorization into groups based on
stain characteristics. (A) A binary decision tree was used to catetgorize all segmented cells into groups. Cells positive for incompatible lineage markers (CD79a+/CD3+ or CD79a+/CD3+/CD8+) required reassignment, whereas CD8+ CD3- and CD8+ CD79a+ cells were rare and excluded from analysis. (B) Cells positive for incompatible markers were visually assessed for evidence of cell overlap occurring as a result of improper segmentation due to object proximity. In this example of a CD3+ CD79a + cell, the topmost image shows CD3+ (blue) and CD79a+ (red) channels visualized in false color simultaneously and the nuclear boundary is shown as a red line. The second image shows only the CD3+ channel. The third image shows only the the CD79a+ channel. Since the presence of two overlapping cells is clear, a second nuclear centre is produced and the CD3+ CD79a+ cell is reassigned to a CD3+ cell immediately adjacent to a CD79a+ cell (bottom image). (C) In this example of a CD3+ CD79a+ cell, there is not clear evidence of two adjacent cells. As double positivity for these markers is not supported by current literature, these cells were rare and excluded from analysis. (TIF 207 kb)
Additional file 4:Figure S4.Monte Carlo simulation. (A) Hypothetical
samples depicting a random distribution (sample 1) and a non-random distribution (sample 2) are shown and colors represent different phenotypes of cells. (B) The neighbor score (top) and z-scores (bottom) of each combination of nearest neighbor interactions are shown. Low neighbor frequency of red cells with blue cell neighbors were present in sample 1; furthermore, the z-score of this observation was near zero, indicating this interaction would be expected from random (non-meaningful) distributions of the cells. In contrast, in sample 2, the neighbor frequency of red to blue
cells was 0.6 and the z-score value was 24. The interactions happened much more frequently than would be expected by random distribution of the cells, meaning experimental data matching this pattern may indicate an underlying biological phenotype. (TIF 653 kb)
Additional file 5:Figure S5.Monte Carlo z-scores of mean neighbor
frequencies. Histograms of cell sociology z-scores generated by Monte Carlo analysis of unstained (tumor) cells with CD3+ CD8+ T cell neighbors in non-recurrent (top) and recurrent (bottom) cases. Cutoff z-scores of +/−3 were used to assess whether the distributions were likely to be non-random; the highly negative scores represent a tendency towards avoidance. (TIF 122 kb)
Abbreviations
B2M:Beta 2 Microglobulin; BCCA: British Columbia Cancer Agency; FFPE: Formalin fixed paraffin embedded; IHC: Immunohistochemistry; MHCI: Major Histocompatibility Complex I; PD-1: Programmed cell Death 1; PD-L1: Programmed cell Death Ligand 1; ROI: Regions Of Interest; TNM: Tumor; Node; Metastasis
Acknowledgments
The authors would like to acknowledge Dr. Raymond Ng and Dr. Zhaolin Xu for helpful discussion and critical appraisal of the manuscript.
Funding
This work was supported by grants from the National Sanitorium Association, the Terry Fox Research Institute, and the Canadian Institutes for Health Research (CIHR, FDN-143345 and MOP-142198). K.S.S.E., S.D.M. and S.H.Y.K. are supported by CIHR Frederick Banting and Charles Best Canada Graduate Scholarships.
Availability of data and materials
Data sharing is not applicable to this article as no datasets were generated or analysed during the current study.
Authors’contributions
KSSE and SDM conceived the project, performed data analysis, and composed the manuscript. SHYK, PG and ZC performed image acquision and data processing. KM, SL and JCE provided clinical and histopathological expertise. EM contributed to data interpretation and manuscript preparation. CEM and MG developed the spectral unmixing, hyperspectral imaging and cell sociology analysis software. BN supervised staining of the tissues and helped compose the manuscript. CEM, WLL and MG are prinicipal investigators of this project, they contributed to data interpretation and manuscript preparation. All authors have read, edited and approved the final manuscript.
Ethics approval and consent to participate
Tissues were obtained from the Tumor Tissue Repository of the British Columbia Cancer Agency or Vancouver General Hospital under informed written patient consent and with approval from the University of British Columbia–BC Cancer Agency (BCCA) Research Ethics Board.
Consent for publication
Not applicable.
Competing interests
The authors declare that they have no competing interests.
Publisher’s Note
Springer Nature remains neutral with regard to jurisdictional claims in published maps and institutional affiliations.
Author details
1Integrative Oncology, British Columbia Cancer Research Centre, Vancouver,
BC V5Z1L3, Canada.2Faculty of Medicine, University of British Columbia, Vancouver, BC, Canada.3Deeley Research Centre, Victoria, BC, Canada. 4
Received: 17 August 2018 Accepted: 19 December 2018
References
1. Mehnert JM, Monjazeb AM, Beerthuijzen JMT, Collyar D, Rubinstein L, Harris LN. The challenge for development of valuable Immuno-oncology biomarkers. Clin Cancer Res. 2017;23(17):4970–9.
2. Parra ER, Uraoka N, Jiang M, Cook P, Gibbons D, Forget MA, Bernatchez C, Haymaker C, Wistuba II, Rodriguez-Canales J. Validation of multiplex immunofluorescence panels using multispectral microscopy for immune-profiling of formalin-fixed and paraffin-embedded human tumor tissues. Sci Rep. 2017;7(1):13380.
3. Huang W, Hennrick K, Drew S. A colorful future of quantitative pathology: validation of Vectra technology using chromogenic multiplexed immunohistochemistry and prostate tissue microarrays. Hum Pathol. 2013; 44(1):29–38.
4. Pages F, Berger A, Camus M, Sanchez-Cabo F, Costes A, Molidor R, Mlecnik B, Kirilovsky A, Nilsson M, Damotte D, et al. Effector memory T cells, early metastasis, and survival in colorectal cancer. N Engl J Med. 2005;353(25): 2654–66.
5. Zhang L, Conejo-Garcia JR, Katsaros D, Gimotty PA, Massobrio M, Regnani G, Makrigiannakis A, Gray H, Schlienger K, Liebman MN, et al. Intratumoral T cells, recurrence, and survival in epithelial ovarian cancer. N Engl J Med. 2003;348(3):203–13.
6. Kirilovsky A, Marliot F, El Sissy C, Haicheur N, Galon J, Pages F. Rational bases for the use of the Immunoscore in routine clinical settings as a prognostic and predictive biomarker in cancer patients. Int Immunol. 2016;28(8):373–82. 7. Daud AI, Wolchok JD, Robert C, Hwu WJ, Weber JS, Ribas A, Hodi FS, Joshua AM, Kefford R, Hersey P, et al. Programmed death-ligand 1 expression and response to the anti-programmed death 1 antibody Pembrolizumab in melanoma. J Clin Oncol. 2016;34(34):4102–9.
8. Wolchok JD, Chiarion-Sileni V, Gonzalez R, Rutkowski P, Grob JJ, Cowey CL, Lao CD, Wagstaff J, Schadendorf D, Ferrucci PF, et al. Overall survival with combined Nivolumab and Ipilimumab in advanced melanoma. N Engl J Med. 2017;377(14):1345–56.
9. Brahmer J, Reckamp KL, Baas P, Crino L, Eberhardt WE, Poddubskaya E, Antonia S, Pluzanski A, Vokes EE, Holgado E, et al. Nivolumab versus Docetaxel in advanced squamous-cell non-small-cell lung Cancer. N Engl J Med. 2015;373(2):123–35.
10. Teixido C, Vilarino N, Reyes R, Reguart N. PD-L1 expression testing in non-small cell lung cancer. Ther Adv Med Oncol. 2018;10:1758835918763493. 11. Gridelli C, Ardizzoni A, Barberis M, Cappuzzo F, Casaluce F, Danesi R,
Troncone G, De Marinis F. Predictive biomarkers of immunotherapy for non-small cell lung cancer: results from an experts panel meeting of the Italian Association of Thoracic Oncology. Trans Lung Cancer Res. 2017;6(3):373–86. 12. Lu G, Little JV, Wang X, Zhang H, Patel MR, Griffith CC, El-Deiry MW, Chen
AY, Fei B. Detection of head and neck Cancer in surgical specimens using quantitative Hyperspectral imaging. Clin Cancer Res. 2017;23(18):5426–36. 13. Spagnolo DM, Al-Kofahi Y, Zhu P, Lezon TR, Gough A, Stern AM, Lee AV,
Ginty F, Sarachan B, Taylor DL, et al. Platform for quantitative evaluation of spatial Intratumoral heterogeneity in multiplexed fluorescence images. Cancer Res. 2017;77(21):e71–4.
14. Melssen M, Slingluff CL Jr. Vaccines targeting helper T cells for cancer immunotherapy. Curr Opin Immunol. 2017;47:85–92.
15. Arasanz H, Gato-Canas M, Zuazo M, Ibanez-Vea M, Breckpot K, Kochan G, Escors D. PD1 signal transduction pathways in T cells. Oncotarget. 2017; 8(31):51936–45.
16. Pirici D, Mogoanta L, Kumar-Singh S, Pirici I, Margaritescu C, Simionescu C, Stanescu R. Antibody elution method for multiple immunohistochemistry on primary antibodies raised in the same species and of the same subtype. J Histochem Cytochem. 2009;57(6):567–75.
17. Zhang X, Tauler R. Application of multivariate curve resolution alternating least squares (MCR-ALS) to remote sensing hyperspectral imaging. Anal Chim Acta. 2013;762:25–38.
18. de Juan A, Jaumot J, Tauler R. Multivariate Curve Resolution (MCR). Solving the mixture analysis problem. Anal Methods. 2014;6:4964–76.
19. MacAulay C, Keyes M, Hayes M, Lo A, Wang G, Guillaud M, Gleave M, Fazli L, Korbelik J, Collins C, et al. Quantification of large scale DNA organization for predicting prostate cancer recurrence. Cytometry A. 2017;91(12):1164–74. 20. MacAulay C, Palcic B. An edge relocation segmentation algorithm. Anal
Quant Cytol Histol. 1990;12(3):165–71.
21. Lukat G, Sommer B, Kruger J. Membrane simulation analysis using Voronoi tessellation. J Cheminform. 2014;6(Suppl 1):O23.
22. Sudbo J, Marcelpoil R, Reith A. New algorithms based on the Voronoi diagram applied in a pilot study on normal mucosa and carcinomas. Anal Cell Pathol. 2000;21(2):71–86.
23. Fridman WH, Zitvogel L, Sautes-Fridman C, Kroemer G. The immune contexture in cancer prognosis and treatment. Nat Rev Clin Oncol. 2017; 14(12):717–34.
24. Geng Y, Shao Y, He W, Hu W, Xu Y, Chen J, Wu C, Jiang J. Prognostic role of tumor-infiltrating lymphocytes in lung Cancer: a meta-analysis. Cell Physiol Biochem. 2015;37(4):1560–71.
25. Shalapour S, Lin XJ, Bastian IN, Brain J, Burt AD, Aksenov AA, Vrbanac AF, Li W, Perkins A, Matsutani T, et al. Inflammation-induced IgA+ cells dismantle anti-liver cancer immunity. Nature. 2017;551(7680):340–5.
26. Shalapour S, Font-Burgada J, Di Caro G, Zhong Z, Sanchez-Lopez E, Dhar D, Willimsky G, Ammirante M, Strasner A, Hansel DE, et al. Immunosuppressive plasma cells impede T-cell-dependent immunogenic chemotherapy. Nature. 2015;521(7550):94–8.
27. Nelson BH. CD20+ B cells: the other tumor-infiltrating lymphocytes. J Immunol. 2010;185(9):4977–82.
28. Schapiro D, Jackson HW, Raghuraman S, Fischer JR, Zanotelli VRT, Schulz D, Giesen C, Catena R, Varga Z. Bodenmiller B: histoCAT: analysis of cell phenotypes and interactions in multiplex image cytometry data. Nat Methods. 2017;14(9):873–6.
29. Barua S, Fang P, Sharma A, Fujimoto J, Wistuba I, Rao AUK, Lin SH. Spatial interaction of tumor cells and regulatory T cells correlates with survival in non-small cell lung cancer. Lung Cancer. 2018;117:73–9.
30. Tang J, Shalabi A, Hubbard-Lucey VM. Comprehensive analysis of the clinical immuno-oncology landscape. Ann Oncol. 2018;29(1):84–91.
31. Mlecnik B, Bindea G, Angell HK, Maby P, Angelova M, Tougeron D, Church SE, Lafontaine L, Fischer M, Fredriksen T, et al. Integrative analyses of colorectal Cancer show Immunoscore is a stronger predictor of patient survival than microsatellite instability. Immunity. 2016;44(3):698–711. 32. Ogino S, Giannakis M. Immunoscore for (colorectal) cancer precision
medicine. Lancet. 2018;391(10135):2084–6.
33. Reck M, Rodriguez-Abreu D, Robinson AG, Hui R, Csoszi T, Fulop A, Gottfried M, Peled N, Tafreshi A, Cuffe S, et al. Pembrolizumab versus chemotherapy for PD-L1-positive non-small-cell lung Cancer. N Engl J Med. 2016;375(19): 1823–33.
34. Hui R, Garon EB, Goldman JW, Leighl NB, Hellmann MD, Patnaik A, Gandhi L, Eder JP, Ahn MJ, Horn L, et al. Pembrolizumab as first-line therapy for patients with PD-L1-positive advanced non-small cell lung cancer: a phase 1 trial. Ann Oncol. 2017;28(4):874–81.
35. Hellmann MD, Ciuleanu TE, Pluzanski A, Lee JS, Otterson GA, Audigier-Valette C, Minenza E, Linardou H, Burgers S, Salman P, et al. Nivolumab plus Ipilimumab in lung Cancer with a high tumor mutational burden. Engl J Med. 2018;378(22):2093-104.