_____________________________________________________________________________________________________
Design of Medical Wastes Incinerator for Health
Care Facilities in Akure
O. O. Olanrewaju
1*and R. J. Fasinmirin
11
Department of Agricultural and Environmental Engineering, School of Engineering and Engineering Technology, Federal University of Technology, P.M.B. 704, Akure, Ondo State, Nigeria.
Authors’ contributions
This work was carried out in collaboration between both authors. Author OOO designed the study. Author RJF performed the statistical analysis, wrote the protocol and wrote the first draft the manuscript. Author OOO managed the analyses of the study and the literature searches. Both authors read and approved the final manuscript.
Article Information
DOI: 10.9734/JERR/2019/v5i216919 Editor(s): (1) Dr. P. Elangovan, Associate Professor, Department of EEE, Sreenivasa Institute of Technology and Management Studies, Chittoor, Andhra Pradesh, India. (2) Dr. S. Selva Nidhyananthan, Associate Professor, Department of Electronics & Communication Engineering, Mepco Schlenk Engineering College, Sivakasi-626005, India. Reviewers: (1) B. P. Naveen, Amity University, Gurgaon, India. (2) C. M. Narayanan, National Institutes of Technology, India. (3) Obiekea Kenneth, Ahmadu Bello University, Nigeria. Complete Peer review History:http://www.sdiarticle3.com/review-history/42495
Received 25 February 2019 Accepted 02 May 2019 Published 13 May 2019
ABSTRACT
Health Care Facilities (HCFs) are primarily saddled with the responsibilities of providing medical care, thus ensuring sound health of individuals. Tremendous efforts have been made by the government to ensure her availability in nooks and crannies of every community, which have resulted into improved medical services. However, among other environmental challenges confronting health care facilities in developing countries is Medical Waste generated in the course of carrying out their duties which is often ignored and in most instances treated as municipal or domestic solid waste. Effective management of medical waste requires keen planning, training and tracking throughout the waste generation, segregation, storage, collection, transportation, treatment and disposal processes. The fundamental information for selecting and designing the most efficient treatment method of medical waste is obtained by means of Waste Composition Analysis. Results from this study revealed that the daily waste generation rate of Ondo State Specialist Hospital Akure (OSSHA) and Mother and Child Hospital Akure (MCHA) was 124.5 kg/day. The hospitals’ waste consists of 81.6% combustible wastes and 18.4% non-combustible
wastes by mass. The combustible wastes are paper (6.50%), textiles (14.34%), cardboard (3.88%), plastics (6.04%) and food waste (19.08%). Since the ratio of combustible medical waste is higher than non-combustible medical waste, incineration (thermal destruction) at elevated temperature under controlled operational condition is considered the best disposal option to detoxify the medical waste. In other to prevent the release of harmful gases from burnt medical waste through incinerator, a counter-current packed bed wet scrubber is designed which operates by impaction and absorption.
Keywords: Health care facilities; medical waste; incinerator; waste composition analysis.
1. INTRODUCTION
Health-care facilities generate medical waste which is capable of creating unsafe environment for both man and animals, as well as alter the properties of soil and local groundwater. Management of a medical waste thus becomes a matter of concern to public health administrator, environmentalist, infection control specialists, as well as the populace due to its potential environmental hazards and public health risks as it contains highly toxic chemicals, bacteria and pathogenic viruses [1,2]. It is undoubted that health-care activities generate various types of hazardous and infectious materials. However, the consequences of indiscriminate disposal of medical waste have been highlighted by various regional and global studies, but the methods to manage this waste in a scientific manner putting into consideration safety of the ecosystem have not been fully introduced [3,4,5]. As a result, majority of the health institutions disposed combustible and non-combustible medical waste by open burning together with domestic waste, a practice considered inimical to the health of nearby dwellers [6,7]. In Nigeria, biomedical wastes are characterized as infectious wastes which are further categorized as pathological waste, culture and stock of infectious agents, sharps (hypodermic needles, syringes and scalpel blades), waste from human blood, waste from surgery or autopsy that were in contact with infectious agents and products of blood and laboratory waste [8,9]. Other wastes in these category includes waste from diverse therapeutic
operations such as dialysis, autopsy,
chemotherapy and biopsypara clinical test which generates chemical, radioactive and toxic materials that affect the environment and her occupants [2]. Every health-care facility is expected to effectively manage their waste following the right processes from the point of generation to final disposal [6]. Incineration of Medical Waste has many benefits such as significant volume reduction (about 90%) and
mass reduction (about 70%), thorough
disinfection and energy recovery. Thus,
incineration ensures detoxification, decrement and resource recovery, and it has been technically proven as an reliable waste treatment method [5,10,11].
1.1 Incineration Technology
Disposal of medical waste through incineration process has been widely accepted in the field of infectious and hazardous waste management with regards to its advantages, which includes reduction in the quality (infectious state) and quantity (weight and volume) of the waste, reduction in toxic emission, suitability for all types of waste apart from sharps, exclusion of the risk of contamination of soil and local groundwater and low construction cost [2]. Waste obtained from hospitals is heterogeneous in nature because they consist of various degrees of elements in major and minor quantities, some of which are toxic and extremely infectious if not properly managed [4,9,12]. Hence, the need for incineration to decontaminate the medical waste by subjecting it to thermal destruction process at high temperature (1100°C - 1600°C) under controlled operational conditions. The products of combustion are ash residue, water and carbon-dioxide. Incinerator is the unit in which the process occur. A well-designed incinerator does not only consider reduction of waste volume as priority but the environment as well must be put
into consideration, hence, the need for
incorporation of a gas cleaning device to the incineration process to ensure the release of clean and safe air to the atmosphere. A complete combustion of the medical waste and reduction in potential pollutants contained in the emission lends the process well to waste disposal in areas where population density is relatively high and availability of sites for landfill is low [13,14]. Incinerators reduce the solid mass of the initial waste by 80–85% and compresses the volume by 95–96%, based on the composition and extent of recovery of the material. Thus, as
completely, it reduces the required volume for disposal definitely [15,16,17].
Minimization of the impacts of medical waste in HCFs is pre-requisitely a function of appropriate and practicable waste management system. Ethically, it is the responsibility of HCFs management to ensure proper medical waste management, which involves the determination of sources, waste characterization, frequency of generation, safe handling practices, segregation, storage, transportation, treatment and final disposal [1,2,15]. Most dominant approach to medical waste treatment and disposal in Africa, Asia and some parts in Europe are landfill, open burning and incineration. However, most of the HCFs often neglect the harmful side of these practices when it is not duly followed according to the World Health Organisation standard [3,5,8]. The use of incinerator without flue gas emission control device is as good as burning the
waste in open space while unengineered landfill is synonymous to direct contamination of
groundwater. Therefore, this study is geared towards design and the development of a medical waste incinerator equipped with a
counter-current packed bed wet scrubber.
2. MATERIALS AND METHODS
The medical waste incinerating system equipped with air pollution control device for the health care facilities in Akure, Ondo state, Nigeria was designed and developed using appropriate and essential principles. The fabrication of the system is in progress. The major component of the incineration system includes the combustion system, connecting ducts, filtration system and the air pollution control system.
2.1 Design of a Controlled-Air-Batch-Feed Incineration Technology
2.1.1 Determination of the incinerator
capacity
The incinerator capacity and burning time (residence time) was determined from the quantity of waste load generated by the HCFs using the equations developed by Walter [18]:
Y = 1.72 x W . (1)
N = W
0.9Y (2)
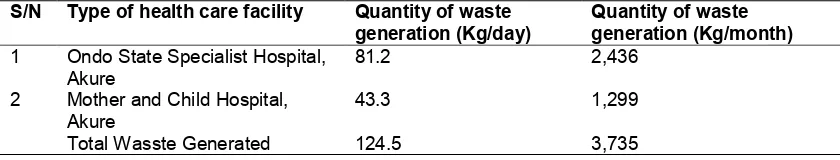
Where W is the waste load (lbs/day or kg/day), Y is the optimum incinerator capacity (lbs/hr or kg/hr) and N is the Optimum burning time (hrs/day). From the survey and measurement, the average wastes quantification from the two public hospitals is shown in Table 1.
For unknown future of higher generation of medical waste, the waste load (W) from the HCFs is estimated as 269 kg/day. Hence the optimum incinerator capacity (Y) is 100 kg/hr. 2.1.2 Design assumptions
For the air-starved batch-feed type of incinerator designed to treat a mixture of 70% ‘black bag’ and 30% ‘red bag’ medical wastes at a optimum throughput capacity of 100 kg/hr, the following assumptions were made with regards to United States Environmental Protection Agency [19].
Ignition/Primary chamber temperature is
760°C (1400°F)
Secondary chamber temperature is 1100°C
(2010°F)
Flue gas residence time at 1000°C (1830°F)
is 1 second
Residual oxygen in flue gas is 6% minimum
30% of air required for stoichiometric combustion is supplied into the primary chamber
Excess air at 150% of the theoretically required air is supplied in the secondary chamber of the incinerator during the peak burning rate.
Detailed monitoring of the temperatures of gases and water and at critical points of the system with the use of appropriate devices. The use of thick standard materials for
adequate protection of the combustion chamber from fire.
A little opening (sealed glass covered by blast-gates) as view point is installed on the primary chamber to enhance easy view of the flame pattern and the waste bed.
The use of adequate refractory and
insulation materials for combustion
chambers outside surfaces to maintain operating temperature.
Table 1. Quantity of medical wastes generated daily and monthly in the HCFs
S/N Type of health care facility Quantity of waste
generation (Kg/day)
Quantity of waste generation (Kg/month)
1 Ondo State Specialist Hospital,
Akure
81.2 2,436
2 Mother and Child Hospital,
Akure
43.3 1,299
Total Wasste Generated 124.5 3,735
2.1.3 Design of primary chamber
In design of the primary chamber of the starved-air-batch-feed incinerator, the initial volume of the chamber is determined. The optimum incinerator capacity per hour (100 kg/hr) was dumped as a heap and the volume is calculated as slightly rounded parabolic shape measured as 5 m3 value of which is used in the design of the chamber using equation [20].
V = L x B x H (3)
Assuming a suitable chamber depth, H of 2 m, with the ratio of length to breadth as 1.5:1, Hence, the width of incinerator, B is1.29 m and the length of incinerator, L is1.93 m.
Chamber sizing is based on heat release, which is the amount of heat generated when combustible material burns [7,17]. Biomedical waste contains varieties of low density, high heating value wastes (e.g. plastics), as well as high density, low heating value wastes (e.g. tissue, bones). Therefore, the primary chamber was sized to accommodate the variation in the waste composition. The volume of the primary chamber was designed to allow for a total heat release rate of 41,020.73 kJ/h and with an operating temperature range between 400-760°C (750-1400°F).
2.2 Machine Conception
The main concept behind this machine is to design a movable and well-regulated incineration system equipped with air pollution control device
that will be economically feasible and
environmental friendly. The machine is expected to be used basically for burning solid combustible medical wastes at 400°C – 760°C and 1100°C in
the primary and secondary combustion
chambers respectively. The material selected for
the designed are locally available which makes the cost of production low. The incinerator uses basic principle of conduction to achieve burning while flue gas emission control device utilises the principle of absorption and impaction with the aid of counter-current randomly-packed bed and
water (wet scrubber) to remove
hazardous/infectious substances from emitted gases. It is expected that the machine reduces the quantity and quality of the medical waste after burning to produce ash and harmless gases. A conceptual drawing of the machine is shown in Fig. 1.
2.3 Heat and Material Balance
Heat and material balance calculation is an integral part of designing and evaluating incinerators. The technique involves a detailed estimation of the input and output conditions of the incinerator. It was used to determine the combustion air and auxiliary fuel requirements for incinerating a given medical waste and/or to
determine the limitations of an existing
incinerator when charged with a known waste [4,20]. The following steps were taken to calculate the heat and material balance sample. 2.3.1 Heating values of material input
The material flow per hr into the incinerator is 100 kg/hr. Based on an input of 30% of 100 kg/h (i.e 30 kg/h), the ‘red bag’ is assumed to have the following composition, according to Oumarou et al.[17] and John and Swamy [20]: dry tissue, water and ash represents 6.0, 21.0 and 3.0 kg/h respectively.
Fig. 1. Conceptual drawing of a batch feed incinerator incorporated with packed bed wet scrubber
Table 2. Higher heating values and total heat of the combustible medical waste
Component Calorific value kcal/g HHV kJ/kg Input kg/h Total Heat in kJ/h
C5H10O3 6.028 25,220 6.0 151,320.0
H2O 0.0 0.0 21.0 0.0
(C2H4)x 9.039 37,820 21.0 794,220.0
(C2H3Cl)x 9.119 38,154 2.1 80,123.4
C6H10O5 5.703 23,860 36.4 868,504.0
Ash 0.0 0.0 13.5 0.0
Total 100.0 1,894,167.4
2.3.2 Determination of stoichiometric oxygen for combustible medical wastes and combustion air rates
The total stoichiometric (theoretical) amount of oxygen required to oxidize (burn) the waste is
determined by the chemical equilibrium
Table 3. The combustion equation and the stoichiometric air requirement
Waste Combustion Equation Stoichiometric air requirement
(per kg waste) (kg/hr) Tissue (dry) C5H10O3 + 6O2 5CO2 + 5H2O 9.34
Poly Ethylene (C2H4)x + 3O2 2CO2 + 2H2O 79.5
PVC 2(C2H3Cl)x + 5O2 4CO2 + 2H2O + 2HCl 4.27
Cellulose C6H10O5 + 6O2 6CO2 + 5H2O 41.6
134.8 The stoichiometric air is calculated thus:
Stoichiometric air = Stoichiometric O x Total Input (kg/h)
Molecular weight of O (4)
= 134.8 x100
23 = 586.1 kg/h of air
Primary chamber was supplied at 30 % of that required for stoichiometric combustion total air required for waste at primary chamber = (0.3 x 586.1) + 586.1 = 761.9 kg/h. The air supply in the secondary chamber was designed to provide excess air 150% of that theoretically required during the peak burning rate [3,11,20]. Hence, Total air required for waste at secondary chamber (150% excess) = (1.5 x 586.1) + 586.1= 1465.3 kg/h.
2.3.3 Material balance for combustion chambers
A. Total Mass Input
Total air required for waste at secondary chamber (Dry air) = 1465.3 kg/h Total mass of waste per hour = 100 kg/h
Moisture in air = mass of oxygen in air x dry air (5) = 0.0132 x 1465.3 = 19.3 kg/h
Total Mass input = mass of waste + Dry air + moisture in air (6)
= 100 kg/h + 1465.3 kg/h + 19.3 kg/h = 1584.6 kg/h
B. Total Mass Output (Assuming Complete Combustion)
Dry Products from waste
Less stoichiometric air for waste = 586.1kg/h
Total excess air = 586.1 x 1.5 = 879.2 kg/h
Adding nitrogen from stoichiometric air 0.77 x 586.1= 451.3 kg/h Sub-total air = (879.2 + 451.3) = 1330.5 kg/h Add total C02 from combustion:
C02 formed from C5H10O3 = 10.47 kg/h
C02 formed from (C2H4)x = 72.4 kg/h
C02 formed from (C2H3Cl)x = 3.92 kg/h
C02 formed from C6H10O5 = 56.2 kg/h
142.9 kg/h
Total waste dry products = Sub-total air + total C02 from combustion (7)
= (1330.5 + 142.9) kg/h = 1473.4 kg/h Moisture present in waste
H2O in the waste = 21.0 kg/h
H2O from combustion reactions = 55.5 kg/h
H2O in combustion air = 19.3 kg/h
Ash Output
Ash Output = 13.5 kg/h HC1 formed from Wastes
HC1 formed from (C2H3Cl)x = 1.65 kg/h
Total Mass Out
Total Mass Out = Total waste dry products + Total moisture + Total CO2 from combustion +
HCl formed from waste + Ash Output (8)
= (1330.5 + 95.8 + 142.9 + 1.65 + 13.5) kg/h = 1584.4 kg/h 2.3.4 Energy balance of the incinerator
Analysis of energy balance for an incinerator prototype entails the use of first law of thermodynamics and energy conservation [21] i.e.;
ƩE = ƩE (9)
A. Total energy input to the incinerator
Energyinput = Qbmw + QNatural gas + Qair (10)
Assuming energy from air Q (air) is negligible we have the energy input to be:
Energyinput = Qbmw + QNatural gas (11)
Total heat in from combustible medical waste Qbmwis the summation of all combustible materials:
Total heat required to burn cellulose = 868,504 kJ/h Total heat required to burn Rubber = 794,220 kJ/h Total heat required to burn Plastic = 80,123.4 kJ/h Total heat required to burn Tissue = 151,320 kJ/h Qbmw = Total heat required input = 1,894,167.4 kJ/h
Total heat in from natural gas QNatural gas is calculated as:
QNatural gas = Energy from natural gas
Mass flow rate of natural gas = 20.6 kg/h (assumed)
= mass flow rate of natural gas x higher heating value of natural gas = 20.6 kg/h x 43,000 kJ/kg = 885,800 kJ/h
Hence, the total energy supplied to the system = (1,894,167.4 + 885,800) kJ/h Energy = 2,779,967.4 kJ/h
B. Total energy output from the incinerator
Energyoutput = Qet + Hflue gases (12)
Total heat out based on equilibrium temperature of 1100°C (Qet)
Radiation loss (Rloss) = 5%of total heat available (13)
= 0.05 x 1,894,167kJ/h = 94,708.35 kJ/h
Heat to ash, Heat to dry combustion products and Heat out due to flue gases release is calculated using equation 14 as used by Patel and Kumar [4], Ganguly et al. [12] and Walter [18];
Heat to ash (Hash) is calculated as 12,166.5 kJ/h using equation 14, Where weight of ash, m = 13.5
kg/h, mean heat capacity of ash, Cp = 0.831 kJ/kg°C ([20] and Temperature difference, ΔT = 1084.5°C.
Heat to dry combustion products (Hdcp) is then calculated as 1,735,321.9 kJ/h using equation 14,
where weight of combustion products, m = 1473.4 kg/h, mean heat capacity of dry (medical wastes) products, Cp = 1.086 kJ/kg°C and Temperature difference, ΔT = 1084.5°C.
Heat to moisture (Hmoisture) is then calculated as 479,538.5 Kj/h using equation 15,
ΔH = mC ∆T + mH (15) Where weight of water, m3 = 95.80 kg/h, mean heat capacity of water, Cp3 = 2.347 kJ/kg°C,
Temperature difference, ΔT = 1084.5°C, Hv = latent heat of vaporizations of water = 2460.3 kJ/kg. Heat out due to flue gases release (Hflue gases) is then calculated as 266,570.7 kJ/h using equation 4,
which involves the addition of the Heat out due to release of CO2, O2, HCl respectively, where the
mass, m are 142.9 kg/h, 134.8 kg/h and 1.65 kg/h; specific heat capacity, Cp are 0.844 kJ/kg°C, 0.919 kJ/kg°C and 0.795 kJ/kg°C for CO2, O2 and HCl respectively; and Temperature difference, ΔT
is 1084.5°C.
Hence, the total Energyout (Qout) = (Rloss + Hash + Hdcp + Hmoisture + Hflue gases) kJ/h (16)
Energy = 2,588,305.9 kJ/h
2.3.5 Determination of auxiliary fuel required to achieve 1100°C and mass flow rate
Total heat required from natural gas (Hfuel) =
2,779,967.4 + 5% radiation loss = 2,918.965.8 kJ/h, Available heat (net) from natural gas at 1100°C and 20% excess air = 89,814.3 kJ/m3 (Assumed). Therefore, natural gas required is (2,918.965.8 kJ/hr / 98,947.99 kJ/m3) = 29.5 m3/h [14,20].
Mass flow rate of gas, ṁ = density of methane gas, ρa x volumetric flow rate of gas
= 1.25 kg/m3 x 29.5 m3/h = 36.88 kg/h = 0.01 kg/s.
Assuming 10 gas burners, each burner will consume 3.69 kg of methane gas per hour which is equivalent to 0.0011 kg/s. Six burners in primary chamber will deliver at 0.0066 kg/s (22.14 kg/h) and four burners in secondary chamber at 0.0044 kg/s = 14.74 kg/h. Dry Products from fuel at 20% excess air = dry fuel density x Methane gas required = 16.0 kg/m3 x 29.5 m3/hr. fuel = 472 kg/h [14,20].
2.3.6 Secondary chamber volume required to achieve 1 second residence time at 1100 °C
Total dry product which is the summation of the Total Dry Products from waste and Dry Products from fuel = (1,584.4 + 472) kg/h = 2056.4 kg/h, assuming dry products have the properties of air
and using the ideal gas law, the volumetric flow rate (V ) of dry products (d ) at 1000°C is calculated as 2.1m3/s using equation 17 [22].
PV = nR T (17)
ii) Total moisture = Total moisture from waste + Moisture from fuel = 95.8 kg/h + 46.9 kg/h = 142.7 kg/h
Using the ideal gas law, the volumetric flow rate of moisture at 1000°C (V ) as 0.2 m3/s using equation 17. Total volumetric flow rate (Vt) which
is the summation of volumetric flow rate of dry products at 1000°C and volumetric flow rate of moisture at 1000°C is 2.3 m3/s. Therefore, the active chamber volume required to achieve one second retention is 2.3m3.
The observed one second retention time of 2.3 m3 is sufficient for the active chamber. Although, some dead spaces occur in the chamber creating zero or negligible flow in reality. Hence, the length of the secondary chamber is calculated from the flame front to the location os the temperature sensor to achieve the retention time of one second as recommended by Ganguly et al.[12] and Walter [18].
2.4 Residual Oxygen in the Flue Gas
EA (excess air) = %O
(21% − %O )
150
100=
%O
(21% − %O )
150 (21% - %O2) = 100 %O2
%O2 = 12.6%
2.5 Efficiency of the Machine
The efficiency of the machine is calculated using the relation:
ɳ =Energy output
Energy input x 100%
= 2,588,305.9
2,779,967.4 x 100 = 93%
2.6 Air Pollution Control System
2.6.1 Design conception of packed Scrubber
A vertical design concept is considered for the packed beds wet scrubber, the liquor is sprayed from the top and flows downward across the bed. Appropriate distribution of liquor is important for efficient removal of gases [22]. The
Fig. 2. Conceptual drawing of a countercurrent packed bed wet scrubber
(18)
The efficiency of the machine is calculated using
Air Pollution Control System
Design conception of packed bed wet
A vertical design concept is considered for the he liquor is sprayed from the top and flows downward across the bed. Appropriate distribution of liquor is important for . The collection of
acid gases in packed-bed scrubbers is achieved by absorption. The effectiveness of absorption in packed beds is related to the uniformity gas velocity distribution, the surface packing material, the amount an
distribution of scrubber liquid, and the pH and turbidity of the scrubbing liquid. The measure of gas absorption is affected by the extensive liquid surface contacted by the gas stream as the liquid flows downward over the packing material [16,18]. Variety of available packing materials offer a large exposed surface area to facilitate contact with and absorption these acid gases. The packing materials which ranges in size from 0.5 to 3 inches are randomly oriented in the bed.
Typically, sodium hydroxide (NaOH) or
occasionally sodium carbonate (Na
with water to neutralize the absorbed acid gases in a packed-bed scrubber. These two soluble alkali materials are preferred because they minimize the possibility of scale formation in the nozzles, pump, and piping. For the typical case of using NaOH as the neutralizing agent, the HC1 and SO2 collected in the scrubber react with
NaOH to produce sodium chloride (NaC1) and sodium sulphite (Na2S03) in an aqueous solution.
The conceptual design of the countercurrent packed bed wet scrubber is shown in
Conceptual drawing of a countercurrent packed bed wet scrubber
bed scrubbers is achieved The effectiveness of absorption in related to the uniformity of the gas velocity distribution, the surface area of the packing material, the amount and uniform distribution of scrubber liquid, and the pH and The measure of gas absorption is affected by the extensive liquid surface contacted by the gas stream as the liquid flows downward over the packing material ]. Variety of available packing materials offer a large exposed surface area to facilitate contact with and absorption these acid gases. materials which ranges in size from 0.5 to 3 inches are randomly oriented in the bed.
roxide (NaOH) or
(Na2CO3) is used
with water to neutralize the absorbed acid gases bed scrubber. These two soluble alkali materials are preferred because they minimize the possibility of scale formation in the les, pump, and piping. For the typical case of using NaOH as the neutralizing agent, the collected in the scrubber react with NaOH to produce sodium chloride (NaC1) and ) in an aqueous solution. he countercurrent packed bed wet scrubber is shown in Fig 2.
2.6.2 Design analysis of packed-bed scrubber/absorber
The following assumptions were made in the design of packed tower scrubber:
Pollutant concentration entering the
column in the waste gas = 0.07
( − ⁄ − )
Pollutant concentration entering the
column in the solvent (liquid phase) = 0.000005
( − ⁄ − )
Maximum concentration of the pollutant in the liquid phase if it were allowed to come to equilibrium with the pollutant entering the column in the gas phase ∗ =
0.55
( − ⁄ − )
Waste gas flow rate entering the column
= 1.259 /min.
Liquid flow rate entering the column =
0.078 /min
Efficiency of the scrubber ɳ = 99%
Pollutant exiting the column in the waste gas can be determined from assumed efficiency of air pollution control device using equation 19 as recommended by Walter [18] and Danzomo et al. [23].
Y = Y (1 −ɳ100) (19) = 0.0007 mol
Minimum liquid to gas phase ratio is calculated as 0.126 using equation 20 as used by
L
G =
Y − Y
X ∗− X (20)
Therefore, the actual liquid to gas phase ratio, which is a product of the minimum liquid to gas ratio and an adjustment factor, Adjfac (usually
between 1.2 and 1.5) is calculated as 0.1512 using equation 21.
L
G =
L
G x Adj (21)
The waste flow rate of the gas, G’’ through the scrubber is determined as 0.0233 kg/s using equation 22, where ρg = density of combustion
gases at STP = 1.11 kg/m3 [22]
G′′= ρ x G
60 (22)
Hence, the gas velocity, VGF, which is
determined by dividing the waste gas flow rate by the density of the gas, is calculated as 0.0209 m/s.
The liquid flow rate, L’’ through the scrubber is determined as 1.3 kg/s using equation 23, where ρL = density of liquid at STP = 1000 kg/m3
[20,22].
L′′= ρ x L
60 (23)
The molar flowrate of the pollutant free solvent, Ls is estimated as 0.000114 kmol/s using
equation 24, where the Molecular weight of gas, Mwg is 0.029 kg/mol [11,18]
L = L
G x
G”
M (1 + Y ) (24)
2.6.3 Assumption of absorption factor
The Absorption factor (Absfac) value is frequently
used in describing the relationship between the equilibrium line and the liquid-to-gas ratio [19]. In several pollutant-solvent systems, the most economical value for Absfac ranges from 1.5 to
2.0 [16,18]. For this design, the adsorption factor of 1.65 is assumed.
2.6.4 Determination of superficial gas flow rate
A Generalised pressure drop correlation chart showing the correlation between the liquid and vapour flow rates, system physical properties and packing characteristics, with the gas mass flow-rate per unit cross-sectional area; with lines of constant pressure drop as a parameter as d used by Coker et al. [9]; Doherty and Malone [24], The Abscissa value from the graph is calculated using Equation 25 as 0.06.
F =L”
G” ρ
ρ (25)
A percentage flooding of 80% is observed, which is satisfactory assuming a pressure drop of 8 mm H2O/m packing at OrdinateK4 which is 0.4. The
superficial gas flow rate/gas mass flow-rate per unit column cross-sectional area, Gsfr is then
1.11 kg/m3 [22], density of scrubbing, ρL and
acceleration due to gravitational, g is 9.8 m/s (Gupta and [21]).
K =
13.1( Gsfr) x F μρ
.
ρ ρ − ρ
(26)
The superficial gas flow rate/gas mass flow-rate per unit column cross-sectional area, Gsfr is then
calculated as 0.5859 kg/m2s.
2.6.5 Determination of packed-bed area and diameter
The value of the packed bed area and diameter on the actual gas flow rate per unit area is estimated by determining the required column area, SA. The required column area is calculated
by dividing the gas flow rate by the superficial gas flow rate as shown in equation 27 below where Gas flow rate, G” = 0.0233 kg/s, mass flux of gas per cross sectional area of column, Gsfr = 0.5265 kg/m2s. The column area required,
SA is 0.039 m 2
while the column diameter, D calculated as 0.223 m using equation 28 as adopted by John and Swamy [20], and Danzomo et al.[23].
SA = Gas low rate (G” )
super icial gas mass low rate (G ) (27)
D = 1.13√Tower area (28)
The height of packing, Z is calculated by multiplying the assumed column height, 4m and the height of overall gas phase transfer unit, HOG
of 0.25 m.
3. CONCLUSION AND RECOMMENDA-TION
3.1 Conclusion
The estimated quantity of medical waste from surveyed health-care facilities was about 62.25 kg/day, equivalent to 22.41 ton/year. The average generation rates of total medical waste, general waste, hazardous–infectious waste and sharp waste in public hospitals within Akure metropolis were 0.75, 0.50, 0.19 and 0.06 kg/bed/day respectively. Of the total medical waste generated in the facilities, 65.36% consisted of general waste, 26.78% was infectious waste, and 7.86% was sharps waste. The medical waste has higher calorific value, higher heating value and volatile matter, which
can realize the sustained combustion of waste. The combustible component accounted for more than 60%, so it is entirely feasible to dispose medical waste by high temperature incineration. Daily increment of medical waste generation and the quest to safeguard the people and environment from outbreak of diseases, a cost effective and environmental-friendly incinerator was designed in present study to treat biomedical waste generated in surveyed HCFs with a capacity of 100.0 kg/h. From the material
balance analysis by assuming complete
combustion, total mass input (1584.6 kg/h) is found to be equal to total mass output (1584.4 kg/h) while the total energy input from the heat balance analysis is found to be 2,779,967.4 kJ/h and total energy output to be 2,588,305.9 kJ/h. From the design analysis, 184.7 m3/h of natural gas is required to achieve a design temperature of 1100oC. Also, from the design, the volume of secondary chamber is found to be 3.1 m3 with a detention time of 1 second. A Counter-current packed bed wet scrubber with 99% scrubbing efficiency was designed with the incinerator to adsorb toxic (flue) gases that might be emitted in the course of burning the waste.
3.2 Recommendations
This pilot study in Akure, the state capital territory of Ondo State, Nigeria, shows that very little has been done on medical waste management in the metropolis. It is therefore recommended that the Ministries of Environment and Health put in place a legislation that will regulate medical waste generation and management, and also adopt a multidisciplinary approach to manage medical waste generated within the metropolis and the state at large. Moreover, to improve the existing conditions, extensive research on effective waste
management practices and regulation is
paramount. However, the unending increment of medical waste generation due to multifaceted activities carried out in hospitals poses enormous environmental and health problems. to pose both environmental and health problems to the residents of the city, it is recommended that an energy recovery incinerator equipped with an air pollution control system is developed, positioned and used in treatment of wastes generated in the health care facilities in Akure, Ondo state, Nigeria.
COMPETING INTERESTS
REFERENCES
1. Abanobi OC, Opara K, Nwakwuo G,
Morakinyo OM. Assessment of medical waste management practices in selected hospitals: A case study of Owerri, Nigeria.
Journal of Environmental Health.
2011;8(1): 7-12.
2. Hassan A. Assessment of medical waste disposal methods in Hargeisa public
hospital – Somaliland. International
Journal of Social Science and Humanities
Research (Online). 2018;6(4):1144-
1167.
3. Batterman S. Findings on an assessment of small-scale incinerators for health-care waste. Publications of the World Health Organization; 2008.
Available:https://www.who.int/water_sanita tion_health/medicalwaste/en/smincinerator s.pdf
4. Patel RK, Kumar S. Design of biomedical waste incinerator. International Journal for
Research in Applied Science &
Engineering Technology. 2017;5(9):436-442.
5. Lup DT, Stroe AM, Chezan PM, Pica EM. The importance of waste incineration. Studia Ubb Ambientum. 2018;63(1):43-48. 6. Longe EO. A preliminary study of medical waste management in Lagos metropolis, Nigeria. Iranian Journal of Health Science Engineering. 2006;3(2):133-139.
7. Oriaku BU, Ikpeze OO. Significance of medical waste management in Awka, Nigeria. Proceedings of the Third African
Regional Conference on Sustainable
Development. 2009;3(3):34-39.
8. Bassey BE, Benka-Coker MO, Aluyi HA.
Characterization and management of solid medical wastes in the Federal Capital Territory, Abuja Nigeria. African Health Science. 2006;6(1):58-63.
9. Coker AO, Sangodoyin AY, Ogunlowo OO,
Mynepalli S, Felix H. Medical waste management in Ibadan, Nigeria. Obstacles
and Prospects. Waste Management.
2008;29(2):804-811.
10. Abdel Salam HA. Operating and emission characteristics of a novel design four chambers infectious meat incinerator. International Journal of Research in Engineering and Technology. 2013;2(11): 322-328.
11. Chukwumuanya EO, Ihueze CC,
Chukwuma EC. Theoretical design of a
non-energy recovery incinerator for Awka Municipality. Journal of Engineering and Applied Sciences. 2018;13:154-166.
12. Ganguly R, Vasistha P, Gupta AK. Design
of an incinerator to treat combined biomedical wastes generated from four major hospitals in Chandigarh and Shimla
City, India. Research Journal of
Pharmaceutical, Biological and Chemical Sciences. 2017;8(3S):201-212.
13. Chang MB, Huang CK. Characteristics of energy flow in municipal solid waste incinerator. Journal of Environmental Engineering. 2001;127(1):78-81.
14. Varghese C, Choudhary A, Chauhan R,
Jadhav R. Design and development of portable incinerator. International Journal of Advanced Research. 2016;4(3):1529-1531.
15. Goddu VK, Duvvuri K, Bakki VK. A critical analysis of healthcare waste management in developed and developing countries: Case studies from India and England.
Proceedings of the International
Conference on Sustainable Solid Waste Management. 2007;134–141.
16. Sorrels JL, Baynham Am, Randall D,
Hancy C. Incinerators and oxidizers. United States Environmental Protection Agency; 2017.
Available:https://www.epa.gov/sites/produc
tion/files/2017-12/documents/oxidizersincinerators_chapt er2_7theditionfinal.pdf
17. Oumarou MB, Ngala GM, Oluwole FA.
Design of municipal solid waste incinerator for use in semi-arid regions. Arid Zone Journal of Engineering, Technology and Environment. 2012;8:133-138.
18. Walter RN. Combustion and incineration process: Applications in environmental engineering. 3rd Ed, CRC Press, Taylor and Francis Group; 2010.
19. USEPA. EPA/530-SW-90-087A,
PB91-130187. Medical waste management in the United States-Second interim report to
Congress. Washington, DC: U.S.
Environmental Protection Agency, Office of Solid Waste; 1990.
20. John SE, Swamy CN. Design of incinerator
for the treatment of bio-medical solid waste in Chikmagalur city. Journal of Industrial Pollution Control. 2011;27(2): 173-179.
21. Khurmi RS, Gupta JK. A textbook of
Publishing House (PVT.) Ltd, Ram Nagar, New Delhi; 2005.
22. Kurt Carlsson KE. Gas cleaning in flue gas from combustion of biomass. Paper Prepared for the EU Project ThermalNet; 2008.
Available:https://pdfs.semanticscholar.org/ 5e23/bcb6462c09e45c6e5812369a3eb9c5 6d8916.pdf
23. Danzomo BA, Salami ME, Jibrin S, Khan MR, Nor IM. Performance evaluation of wet scrubber system for industrial air
pollution control. ARPN Journal of
Engineering and Applied Sciences.
2012;7(12):1669-1677.
24. Doherty MF, Malone MF. Conceptual
design of distillation systems. McGraw-Hill, New York. 2001;568.
© 2019 Olanrewaju and Fasinmirin; This is an Open Access article distributed under the terms of the Creative Commons Attribution License (http://creativecommons.org/licenses/by/4.0), which permits unrestricted use, distribution, and reproduction in any medium, provided the original work is properly cited.
Peer-review history: