Lean Transformation for Composite-Material Bonding Processes
Chiun-Ming Liu
1,*, Min-Shu Chiang
2,
and Wen-Chieh Chuang
31,3
Department of Industrial Engineering and Systems Management, Feng Chia University, Taichung, Taiwan.
2
Aerospace Industrial Development Corp, Taichung, Taiwan.
Received 17 October 2011; received in revised form 15 November 2011; accepted 13 December 2011
Abstract
Composite materials can greatly reduce production and transportation costs and so that they are widely used in the aerospace industry. Traditional composite materials manufacturers are facing competitive challenges such as shorter delivery time, high quality, and quick response to customer demand. Lean methods have been effectively applied to various industries for improving production quality and efficiency. In this study, a framework of lean transformation are organized and presented in a systematic way. The proposed lean transformation techniques are implemented in an aerospace company to improve the composite-material bonding process. Implementation results suggest the overall productivity of the composite-material bonding process increase significantly due to the elimination of bottlenecks, reduction of cycle time, and decrease of WIP inventory. The proposed approach can be applied to other manufacturing enterprises for improving their productivity.
Keywords: Lean production, composite-material bonding process, productive capability
1.
Introduction
Composite material is one of the most important airplane body structure components. The advantage of composite materials lies in the capability to hold the merits of original materials while preventing from their weakness [1, 2]. Compared with traditional metal materials, composite materials possess many special features, such as lighter mass density, stronger structure, better anti-corrosiveness, better anti-fatigue, and like [3].
So, the utilization of composite materials is widely seen in many industries such as aerospace industry, vehicle industry, construction industry, etc. In particular, composite materials are gradually replacing metal materials for manufacturing components and used in aerospace industry.
For many domestic composite materials manufacturers, their production facility and manufacturing process have been designed for small-to-medium production scale with push production systems. Due to market competition, the customers always demand shorter delivery, more cost effectiveness and higher quality. Therefore, those domestic manufacturers must somehow improve their manufacturing techniques and efficiency in order to strengthen their competitive.
Lean methods are originated and developed from Japanese Toyota Production Systems. The original idea of lean techniques is to eliminate waste or non-value-added activities in production process and reduce production cost. The core
*Corresponding author. E-mail address: [email protected]
skills and tools for lean methods may include: 1) applying value stream mapping to analyze the enterprise value chain, 2) using takt time to accommodate customer demand, 3) setting up pull-systems to replace push-systems, and 4) implementing line balancing, heijunka scheduling, and just-in-time for production planning.
In the early 1980s and 1990s, several scholars dedicated to lean production research and obtained significant results. Issues of multi-function work design, just-in-time production process, small batch size, pull-type kanban systems, and quick changeover production line have been studied by several scholars [4, 5, 6, 7]. Lee and Ebrahimpour [8] applied the value stream mapping tool to find roots of production problems and provided necessary information for improvement. Mabry [9] studied methods of applying small batch size, eliminating non-value-added activities, relocating facility layout and material flow, and designing efficient work study for improving efficiency for auto parts suppliers. Jones et al. [10] stressed on the importance and benefit of using value stream mapping for analyzing production process. Bamber and Dale [11] reported some findings of their research which studied the application of lean production methods to a traditional aerospace manufacturing company. Two main stumbling blocks to the application were identified, that is, the redundancy program and a lack of employee education in the concepts and principles of lean production. Lewis [12] argues that lean production can improve competitive advantage if the firm is able to have the productivity savings. It creates by combining normative and critical theory with empirical material drawn from three case studies.
Recently, Sullivan and Aken [13] summarized 7 tools from value stream mapping and types of major waste. Arbos [14] proposed a methodology for implementation of lean management in a telecommunication service. Wantuck [2002] dedicated to continuous improving, just-in-time production process, small batch size, pull-type kanban systems, and quality control management. Womack and Jones [15] pointed out that by using lean thinking way, the company can have many benefits, such as gaining more outputs with less input, transforming waste into valuable activities, quick responding to feedback, and making people feel satisfactory. Hines et al. [16] provided a framework to understand the evolution of lean which is not only a concept, but also an implementation within an organization, and pointed out areas for future research. Bruuna and Mefford [17] explored the implications for lean production systems of the Internet and presented some case examples of using the Internet for these purposes. Beachum [18] pointed out that under an ideal lean environment, the company can shorten lead time, reduce work-in-process inventory, improve product quality, and increase the on-time delivery rate if one piece flow with pull systems is implemented.
components and identify a key set of measurement items by charting the linkages between measurement instruments. Rubio and Corominas [2008] analyzed a production-management model that considers the possibility of implementing a reverse-logistics system for remanufacturing end-of-life products in a lean production environment. Pettersen [2009] investigated the definition of lean production, the methods and goals associated with the concept and how it differs from other popular management concepts. In addition, Pettersen argued that the organization should not accept any random variant of lean, but make active choices and adapt the concept to suit the organization’s needs.
Lean methods have been effectively applied to several industries such as vehicle, electronic and shoes industries. For the aerospace industry, manufacturers can expect to gain much more benefits if lean methods and tools are properly designed and implemented which are due to the special demand for manufacturing process, change of engineering, order quantity, and cost control.
The objective of this study is to develop a framework of lean transformation for improving the composite-material bonding process. The proposed approach provides a series of lean tools and methods in a systematic manner. The developed techniques are implemented in a domestic aerospace company to improve the composite-material bonding process. The results suggest that the overall productivity of the composite-material bonding process significantly increase by eliminating bottlenecks, reducing cycle time, and decreasing inventory level. The developed approach can be expected to extend to other various manufacturing processes for improving productivity.
2.
Development of Lean Transformation Techiques
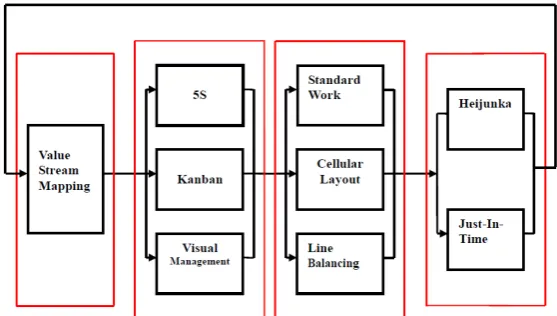
The methodology of lean transformation consists of a series of continuous improvement tools and methods. In this study, a series of lean methods and tools are reorganized in a systematic way that can be effectively applied to improve manufacturing process. The proposed lean transformation techniques may include five stages: 1) value stream mapping, 2) 5S, kanban, and cellular-layout planning, 3) standard work, visual management and jidoka, and 4) line balancing and heijunka scheduling. The tools applied in this study can be found in some related references [28, 29, 30]. Fig. 1 shows a framework for the proposed lean transformation. The detailed procedures are described as follows.
Fig. 1 A Framework for Lean Transformation Stage 1: Value Stream Mapping
Information flow appears on the top; (2) Process flow appears in the middle; (3) Timelines are shown on the bottom; and (4) Icons used in the map represent process, entities, inventory, and associated data; flow, communication, signals, and labels; and people and transportation, The analysis of value chain via value stream mapping provides details of current operational states within the enterprise and opportunities for improvements.
The procedures for value stream mapping are given as follows.
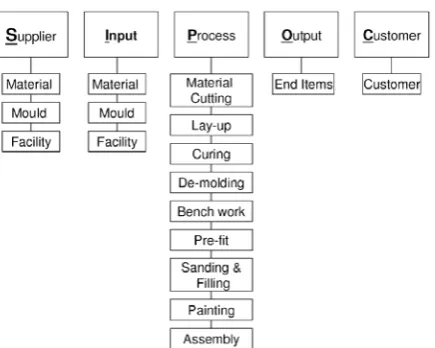
Step 1: Analyze suppliers, input, processes, output, and customers within the value chain.
Step 2: Select product family. The selection of major product family can be done by using product flow analysis for group products that share common flow patterns into families and value streams.
Step 3: Collect process data. The process data include manual cycle time, down time, flow time, changeover time, work-in-process inventory, defect rates, and yield rate.
Step 4: Perform gemba. Gemba is to see where the operations are and quantify value-added, non-value-added, and necessary non-value-added components of each particular activity.
Step 5: Draw the current-state value stream map. The drawing of current state value stream map can be done by using some articulate tools, icons, and techniques. The basic icons used in value stream mapping are a combination of flowcharting icons and unique shapes which are used to visually represent the various tasks and functions within a map.
Value stream mapping can be expected to help an enterprise focus on managing the value chain for all products and services from suppliers, input, processes, output, and customers. Through the analysis of enterprise value stream, a company can grasp the customer demand and provides value-added activities for meeting customer demand.
In order to identify and quantify the bottleneck workstations, several formulas are developed and used to provide necessary information. The development of equations are given as follows.
Step 1: Define variables. The variables defined in this study are:
(1) Operation Time (OT): Operation time is the sum of primal time (PT) and additional time (AT);
(2) Standard Time (ST): Standard time is an operation time (OT) with some additional allowance (r);
(3) Standard Capacity (SC): Standard capacity is the reciprocal of the number from ST divided by 3600 seconds;
(4) Needed Person (NP): Needed person is the number from dividing the multiplication of ST and order quantity (D) by total working hours (TH);
(5) Workload (WL): Workload is the number from NP divided by setting persons (SP); and
(6) Takt Time (TT): Takt time is the number from total working hours divided by order quantity (D).
Step 2: Formulate equations. The equations for computing the variables are:
(1) OT = PT + AT;
(2) ST = OT × (1 + r);
(3) SC = 3600 ÷ ST;
(4) NP = (ST × D) ÷ TH;
(6) TT = TH ÷ D.
Step 3: Compute number for the variables.
Stage 2: 5S, Kanban, and Visual Management
The aim of stage 2 is to organize the shop floor. Among these techniques, 5 S is a set of basic disciplines that can help enterprises ensure a clean and organized workplace. Those five basic disciplines are: sorting, straighten, shine, standardizing, and sustain. The sorting discipline is to clearly distinguish needed items from unneeded ones and eliminat them. The straightening discipline is to keep needed items in the correct place to allow for easy and immediate retrieval. The shining discipline is to keep the workplace neat and clean. The standardizing discipline is to make the disciplines of sorting, straightening and shining habitual. The sustaining discipline is to maintain established procedures.
Kanban can be a useful approach to simplify and manage the flow of production and inventory control. A kanban system can be seen as a loop of information and materials which are circulating between two stores of inventory. There are three distinct types of kanban systems that can be considered in this study. There are product-specific kanban, generic kanban, and hybrid kanban. The kanban system is used to trigger a variety of pull mechanisms that draw work through an entire value stream according to demand and downstream capacity. A scenario with multiple stores of inventory at various stages of production is carefully planned.
Stage 3: Standard Work, Cellular Manufacturing, and Line Balancing
Tools applied in stage 3 are used for designing and implementing to improve shop floor processes. Standard work is a tool for maintaining productivity, quality, and safety. Standard work provides a consistent framework for performing work in the designated takt time, illuminating opportunities and making improvement in work procedures. Standard work is structured around takt time, working sequence, and standard work-in-process stock. Takt time is the pace of sales in the marketplace; the working sequence is the series of steps that represent the best way to perform the task, and standard work-in-process stock is the minimum number of work pieces needed to maintain a smooth flow of work without accumulating inventories.
The cellular manufacturing is a product-oriented layout that places various machines which are required to process a family of parts in the exact sequence. The cellular manufacturing can be done by using the following procedure.
Step 1: Apply U-shape layout principles.
Step 2: Design balanced material flow.
Step 3: Allocate facility and hardware.
Line balancing is to balance the assignment of operations to workstations so that idle time and the number of people working on the line are minimized. The procedures for line balancing are:
Step 1: Complete work measurement and record all data.
Step 2: Obtain takt time and compare with cycle time. Takt time is calculated by dividing total effective working time for the period of total demand.
Step 3: Depict a balance analysis sheet.
Step 5: Improve the bottleneck stations by relocating or redesigning workstations. A balanced cell is preferred, where the cycle time of all operations are within 30% of one another.
Stage 4: Heijunka and Just In Time
Heijunka and just in time used in this stage are applied to connect with supply and demand. The heijunka method is also referred to as rate-based, level, or campaign scheduling. Heijunka scheduling works as a shock absorber, buffering variations in supply and demand and providing the shop floor and suppliers with a stable short-term production plan. A heijunka schedule requires a forecast of quantity and mixs for each value stream. Then some batching is required. The batch size can be determined by calculating a changeover interval, which is the period of time required to produce one full cycle of a product family. The interval can be calculated by using a method called the every-part-every interval (EPE). EPE interval = (effective working time in period – run time × quantity for period) ÷ (number of products in mix × setup time). The heijunka scheduling can be summarized as follows.
Step 1: Break down the total volume of orders for a given planning period into scheduling intervals.
Step 2: Define a repetitive production sequence for scheduling interval by a heijunka calculation.
Step 3: Dictate the model mix scheduled on a given line.
Step 4: Use kanban cards or signals for the mix of products to put that schedule into operation.
The goal of just in time is to supply exactly the required products at the required time. Just in time deliveries need for all processes at every step through delivery of the final product to the external customer. The procedures for just-in-time production are:
Step 1: Leveled production. Distribute the production of different kinds of items evenly through the day and week to allocate work equally and use resources optimally.
Step 2: Pull system. Link each process organically to the proceeding and following processes.
Step 3: Continuous-flow processing. Make items literally one at a time wherever possible and emulate one-at-a-time processing in batch processing by reducing the size of batches.
Step 4: Takt time. Establish a timeframe for linking the pace of work in every process to the pace of sales in the marketplace.
3.
Analysis of Composite-Material Bonding Processes
Composite materials are made of two or more single materials through different synthesis and fabrication methods. The configuration of composite materials, which are used in this study, is a sandwich-type structure and fabricated by using carbon fiber with pre-fitting cloth to serve as outer covering, filling with honeycomb structuring material in-between, and gluing those components together by adhesives. The bonding process for composite materials consists of material cutting, lay-up, autoclave curing, de-molding, bench work, pre-fitting, sanding and filling, painting, assembly, marking, and stocking. Fig. 2 displays the sequence of bonding process for composite materials. The detailed bonding process is described as follows.
(1) Material Cutting: Before releasing of materials, task of materials and mold preparation are needed. The preparation of materials includes thawing procedure and cutting procedure.
(2) Lay-Up: Lay-up operation includes glue injection, laying, and bagging for honeycomb apertures.
(4) De-molding: When autoclave curing operation is finished, remove molds from the heat furnace, tear down bagging material, and take parts out of mold.
(5) Bench-work: Fix parts at the winding stand and polish broken filaments by using tools.
(6) Pre-fitting: Fix parts at the drilling stand and drill bores needed.
(7) Sanding and Filling: Remove impurities and pollutants on surface by using abrasive paper.
(8) Painting: Before painting, cover up the unpainted surface area by screen and then remove it after painting.
(9) Assembly: Apply glue on the connecting surface between parts, hinges, and binder bolt, and then rivet them.
(10) Marking: According to the indication by a blueprint, mark the part number using printing ink and then pack for stocking.
Fig. 2 Bonding process for composite materials used in this study
After the analysis of composite-material bonding process, several production problems are diagnosed. First, the plant space is getting crowded due to an increasing customer order and inappropriate plant layout and material flow design. Second, lots of WIP inventory can be found in-between each workstation due to bottleneck stations. Third, manufacturing quality is getting worse due to pollutants and waste activities scattered within production lines. Finally, production capability is going down due to unbalance of production lines. Traditional improvement methods have been utilized to somehow tackle the production problems, but no significant improvement is obtained [31].
4.
Implementation of Lean Transformation Techniques
4.1. Implementing Value Stream Mapping
During the value stream mapping phase, suppliers, input, processes, output, and customers within the value chain are analyzed. Fig. 3 displays the relationships of value chain among supplier, input, process, output, and customer.
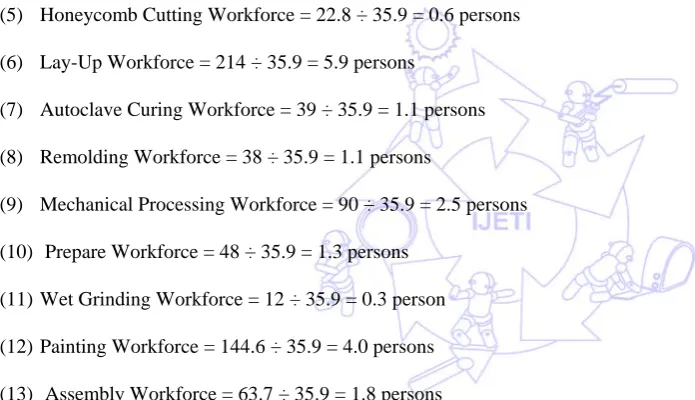
Product family is selected by using product flow analysis. Processing data such as cycle time, down time, flow time, changeover time, defect rate, and work-in-process inventory are collected. The takt time, workforce, workload, and process cycle efficiency are calculated as follows. This information can be used to determine a suitable batch size and balance a production line.
(1) Daily Demand = Monthly Demand ÷ Monthly Work Days
= 256 ÷ 20 = 12.8 pieces
(2) Total Daily Available Time = 460 minutes
(3) Takt Time = Total Daily Available Time ÷ Daily Demand
= 460 ÷ 12.8 = 35.9 minutes per piece
(4) Material Cutting Workforce = 49.2 ÷ 35.9 = 1.4 persons
(5) Honeycomb Cutting Workforce = 22.8 ÷ 35.9 = 0.6 persons
(6) Lay-Up Workforce = 214 ÷ 35.9 = 5.9 persons
(7) Autoclave Curing Workforce = 39 ÷ 35.9 = 1.1 persons
(8) Remolding Workforce = 38 ÷ 35.9 = 1.1 persons
(9) Mechanical Processing Workforce = 90 ÷ 35.9 = 2.5 persons
(10) Prepare Workforce = 48 ÷ 35.9 = 1.3 persons
(11) Wet Grinding Workforce = 12 ÷ 35.9 = 0.3 person
(12) Painting Workforce = 144.6 ÷ 35.9 = 4.0 persons
(13) Assembly Workforce = 63.7 ÷ 35.9 = 1.8 persons
(14) Marking Workforce = 15.6 ÷ 35.9 = 0.4 person
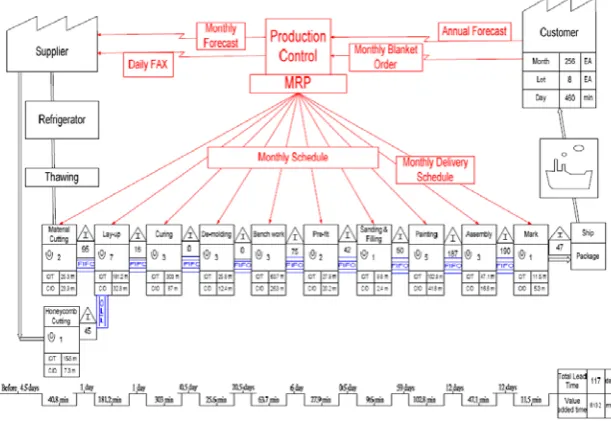
The operations are observed, and value-added, non-value-added, and necessary non-value-added components of each particular step are quantified. Then, a current-state value stream map is drawn using some articulate tools, icons, and techniques.
Fig. 4 The current-state value stream map
The process flow was drawn left to right. Each process box containing information of process title, number of setting persons, cycle time, and changeover time, represents where flow starts and when it stops. The first-in-first-out (FIFO) lanes for controlling stocks, depicted as triangle shapes, provide the quantity of inventory in-between processes. Those cycle times and waiting times from work in process are documented on the timeline underneath each process and inventory is at the bottom of the map. The total cycle time and production lead time are calculated and placed in the box at the right side of the map.
From this map, one can see the whole honeycomb sandwich panel production process, grasp the connection between material flow and information flow, and identify the sources of waste and bottleneck stations. Large variation from one process to another in cycle time shows where bottlenecks may occur. The total cycle time represents the amount of time required for one unit of work to be processed through all processes of the value stream, without any waiting time between processes. The production lead time is the total expected elapsed time. From the moment raw materials are received, the finished good is shipped to the customer. Using the data from total cycle time and production lead time, one can compute the process cycle efficiency, an indicator used to measure the relative amount of value which is added and contained within the whole production process. The process cycle efficiency can be defined as a percentage ratio of total cycle time to production lead time. The total cycle time from the current state is 813.2 minutes, while the production lead time is 117 days. So the resulting process cycle efficiency for the current state is 1.99%.
4.2. Implementing 5S, Kanban, and Cellular Manufacturing
When implementing systematic lean techniques, 5S is the fundamental discipline for employees and should be enforced into the routine operations in the workplace. The requirements for 5S discipline are:
(1) Unnecessary tools, equipment, and procedures are removed from the workplace.
(2) Unsafe conditions or damaged equipment are dealt with early in the process.
(3) Define how a task should be done and let everyone involved know the best way to perform tasks.
(4) Put everything in its place and organize material according to how frequently they are used.
In the current-state value stream map, only FIFO lanes were used to control the material flow. The kanban system is proposed to regulate the work-in-process inventory in order to implement the pull-type production system. The location of kanban is selected mainly at the connection between suppliers and production line, and between the customer and final assembly workstations in order to facilitate the pull system and visual workplace. Also, the kanban container is used in-between each workstation to control the work-in-process inventory. The work-in-process inventory is reduced to 424 pieces from 802 pieces by using the kanban system.
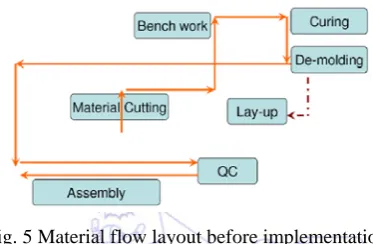
The cellular manufacturing principle is used to improve the material flow and space utilization in the shop floor. Fig. 5 displays the facility layout and material flow before the implementation of the cellular layout principle. Under such a layout environment, there are too many waste occupied spaces cause congestion for people, materials, and equipment. The movement of people and materials is unsmooth and hindered.
Fig. 5 Material flow layout before implementation
The cellular manufacturing principle is applied to improve the facility layout. Fig. 6 shows the resulting cellular manufacturing on the shop floor. The travel distance decreases from 504 meters to 258 meters due to the cellular-layout implementation, which suggests that travel distance of people and materials is significantly reduced. The cellular manufacturing environment also increases space utilization due to the shortening the distance between each process.
Fig. 6 Material flow of cellular manufacturing after implementation
4.3. Line Balancing and Heijunka Scheduling
The times for value-added and non-value-added activities in each workstation are measured. Also, the calculated takt time and observed cycle time from each workstation are used to identify the location of bottleneck stations. The calculated takt time from customer demand is 35.9 minutes per piece. The cycle times observed from each process are collected. Fig. 7 shows the production schedules and the associated cycle time in minute for each operation before implementation. Fig. 7 also displays value-added time and non-value-added time for each process via the effort of gemba identification and analysis. The difference between the largest cycle time and the smallest cycle time is significant. This big gap results in serious bottleneck stations and large number of work-in-process inventory. One can find that lay-up, autoclave curing, bench-work, painting and assembly are bottleneck stations. In addition, the cycle times from those bottleneck stations exceed the takt time.
lay-up process was simplified by removing non-value-added activity. Curing process and demolding process were combined together and rescheduled as a work cell. Bench-work process, pre-fit process, and sanding and filling process were combined together to form a work cell. The painting process was simplified by eliminating waste activities. Assembly process and mark process are combined together to form a work cell. Also, the number of needed persons for each workstation was recalculated by using the takt time. The obtained balanced production schedule is depicted in Fig. 8. The number of rescheduled workstations is reduced to 6 from 11. The difference between the largest cycle time and the smallest cycle time is negligible.
0 100 200 300 400 Honeycomb Cutting Material Cutting
Lay-up Curing De-molding Bench work Pre-fit Sanding & Filling
Painting Assembly Mark
Process 0 100 200 300 400 Value Added Time Non-Value Added Time Takt Time (minutes)
Fig. 7 Production schedule before implementation
0 5 10 15 20 25 30 35 40 Honeycomb Cutting+Material Cutting Lay-up Curing+De-molding Bench work+Pre-fit+Sanding & Filling
Painting Assembly+Mark
Process 0 5 10 15 20 25 30 35 40 Combine#1 Combine#2 Combine#3 Takt Time (minutes)
Fig. 8 Production schedule after implementation
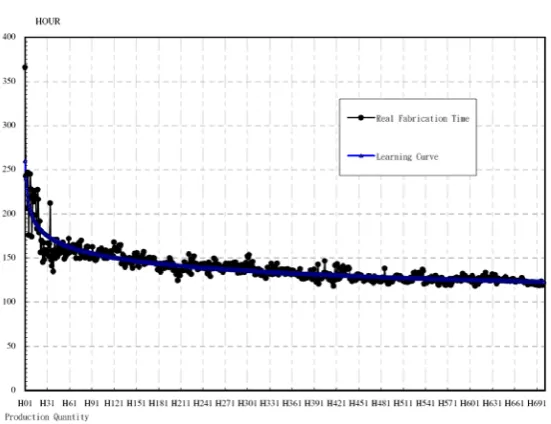
Fig. 9 shows the trend of decreasing learning curve during the implementation of systematic lean technique. The learning curve after finishing 691 products decreased from the initial 250 hours to 124 hours. The significant decrease of learning cure resulted from the effort of employee involvement and accelerated improvement workshops. During the accelerated improvement workshops, employees were encouraged to propose a variety of suggestions and ideas.
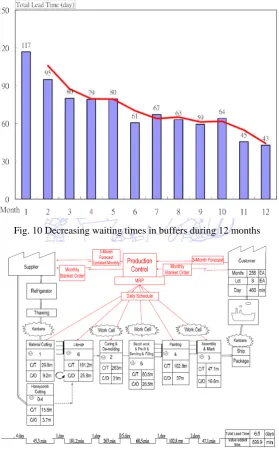
Also, the process lot size is reduced from the current batch size 256 pieces to 12.8 pieces by estimating every-part-every interval (EPE). Lot size reduction has impact on the waiting time and quantity of work-in-process inventory. Fig. 10 gives the trend of waiting times in buffers after implementing systematic lean technique. This downturn trend is very obvious. After 12 months of implementing systematic lean technique, the accumulating waiting time in buffers decreased from 117 days to 43 days.
Fig. 10 Decreasing waiting times in buffers during 12 months
Fig. 11 Value stream map after implementation
simplification of production schedule, reduction of production cycle time and fabrication time, adoption of pull-type kanban system, and decrease of workforce and WIP inventory. Particularly, the work-in-process inventory is reduced from 802 pieces to 424 pieces by using the kanban system and lot size reduction.
5.
Results
It took more than two years to implement the developed approach, not including training and education for the employees. With the exception of phase one, value stream mapping, the lean tools and methods have been, and continue to be, implanted concurrently and repeatedly, not sequentially.
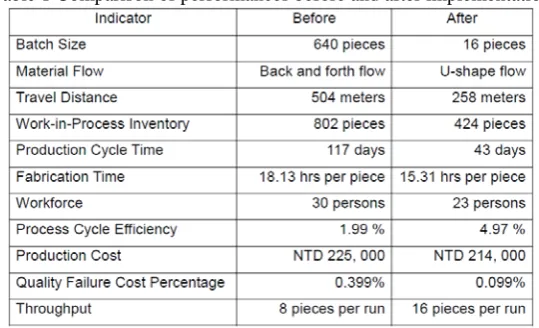
Comparisons are performed by using the production data collected for 12 indicators before and after the implementation of the proposed approach. The indicators used in this comparison are batch size, material flow, travel distance, work-in-process inventory, production cycle time, fabrication time, workforce, process cycle efficiency, production cost, quality failure cost percentage, and throughput. The major differences after implementation of the proposed lean transformation techniques are shown in Table 1.
From Table 1, the benefits obtained can be summarized as follows.
(1) The batch size is reduced from 640 pieces to 16 pieces as a result of implementing the takt time and the heijunka schedule.
(2) The travel distance decreases from 504 meters to 258 meters due to the cellular-layout implementation.
(3) The work-in-process inventory is reduced from 802 pieces to 424 pieces by using the kanban system.
(4) The production cycle time decreases from 117 days to 43 days followed by the use of line balancing technique.
(5) The fabrication time per piece is reduced from 18.13 hours to 15.31 hours due to the elimination of non-value activities and waste.
(6) The workforce decreases from 30 persons to 23 persons followed by the using line balancing technique.
(7) The process cycle efficiency increases from 1.99% to 4.97% by comparing the value stream maps before and after lean techniques Implementation.
(8) Production cost is reduced from $225,000 to $214,000 as a result of lean techniques implementation.
(9) The quality failure cost percentage is reduced from 0.399% to 0.099% as a result of lean techniques implementation.
(10) The throughput per run increased from 8 pieces to 16 pieces.
6.
Conclusions
In this study, lean transformation techniques are proposed and implemented for improving composite-material bonding process. The developed lean transformation techniques encompass five stages and in each phase detailed steps are designed and provided for displaying how lean transformation techniques are implemented. The proposed approach is implemented in a composite-material manufacturing plant owned by a local aerospace company. Twelve Indicators from production lines are used to compare the performance before and after implementation. Significant improvements can be found by using these 12 indicators. Implementation efforts result in streamlining material flow, reducing waste and cost, and increasing productive capability and flexibility of order fulfillment. The results from this study indicated that the proposed systematic lean techniques are effectively implemented in composite-material bonding process and may also be applied in different manufacturing processes.
The major contribution of this study is the development of systematic lean methods for improving the composite-material bonding process. There are very few efforts have been found to devote to the study of lean application to composite-material bonding processes. The developed approach can be applied to similar process improvements. However, there are several limitations on this study. The first limit is that the employees involved in this study should be familiar with the principles and methods of lean production and composite-material bonding processes because the implementation needs the frontline worker. The other one is that the lean transformation is fully supported by the high-rank managers in the organization. Without the full support from the high-rank managers, the implementation could not be done smoothly.
References
[1] T. Bitzer, “Honeycomb technology – materials, design, manufacturing, applications and testing,” London: Chapman and Hall, 1997.
[2] A. S. Herrmann, “Design and manufacture of monolithic sandwich structures with cellular cores”, Sandwich Construction, vol. 4, 2, pp. 719-728, 1998.
[3] M. Kolax, “Advanced composite fuselage structures”, JEC Composites, vol. 10, pp. 31-33, 2004.
[4] Y. Monden, “What makes the Toyota production system really stick,” Industrial Engineering, vol. 13, 1, pp. 13–16, 1981. [5] K. A. Wantuck, “The Japanese approach to productivity,”, 6th ed., U.S.A: FabTech International, 1983.
[6] C. C. Pegels, “The Toyota production system: lessons for American management,” International Journal of Operations and Production Management, vol.4, 1, pp. 3–11, 1984.
[7] Y. Sugimori, F. Kusunoki, F. Cho, and S. Uchikawa, “Toyota production system and kanban system: materialization of just-in-time and respect for human systems,” International Journal of Production Research, vol. 15, 6, pp. 553–564, 1997. [8] S. M. Lee and M. Ebrahimpour, “Just-in-time production system: some requirements for implementation,” International
Journal of Operations and Production Management, vol. 4, 4, pp. 3–15, 1984.
[9] B. G. Mabry, “Transformation to lean manufacturing by an automotive supplier,” Computers and Industrial Engineering, vol. 31, pp. 112, 95-98, 1996.
[10]D. T. Jones, P. Hines, and N. Rich, “Lean logistics,” International Journal of Physical Distribution Logistics Management, vol. 27, pp. 53-73, 1997.
[11]L. Bamber and B. G. Dale, “Lean production: A study of application in a traditional manufacturing environment,” Production Planning and Control, vol. 11, 3, pp. 291-298, 2000.
[12]M. A. Lewis, “Lean production and sustainable competitive advantage,” International Journal of Operations and Production Management, vol. 20, pp. 959-978, 2000.
[13]W. G. Sullivan and E.M. van Aken, “Equipment replacement decisions and lean manufacturing,” Robotics and Computer Integrated Manufacturing, vol. 18, pp. 255-265, 2002.
[16]P. Hines, M. Holweg, and N. Rich, “Learning to evolve A review of contemporary lean thinking,” International Journal of Operations and Production Management, vol. 24, 10, pp. 994-1011, 2004.
[17]P. Bruuna and R. N. Mefford, “Lean production and the Internet,” International Journal of Production Economics, vol. 89, pp. 247–260, 2004.
[18]D. Beachum, “Lean manufacturing beefs up margins pull systems, takt time, and one-piece flow benefit the operation of a powder coating system,” Organic Finishing Group, U.S.A: Walgren Co, 2005.
[19]J. J. Dahlgaard and S. M. Dahlgaard-Park, “Lean production, six sigma quality, TQM and company culture,” The TQM Magazine, vol. 18, 3, pp. 263-281, 2006.
[20]S. de Treville and J. Antonakis, “Could lean production job design be intrinsically motivating? Contextual, configurational, and levels-of-analysis issues,” Journal of Operations Management, vol. 24, pp. 99–123, 2006.
[21]T. Bonavia and J. A. Marin, “An empirical study of lean production in the ceramic tile industry in Spain,” International Journal of Operations and Production Management, vol. 26, 5, pp. 505-531, 2006.
[22]R. Conti, J. Angelis, C. Cooper, B. Faragher, and C. Gill, “The effects of lean production on worker job stress,” International Journal of Operations and Production Management, vol 26, 9, pp. 1013-1038, 2006.
[23]T. J. Persoon, S. Zaleski, and J. Frerichs, “Improving preanalytic processes using the principles of lean production (Toyota Production System),” American Journal of Clinical Pathology, vol. 125, pp. 16-25, 2006.
[24]F. A. Abdulmaleka and J. Rajgopal, “Analyzing the benefits of lean manufacturing and value stream mapping via simulation: a process sector case study,” International Journal of Production Economics, vol. 107, pp. 223–236, 2007. [25]R. Shah and P. T. Ward, “Defining and developing measures of lean production,” Journal of Operations Management, vol.
25, pp. 785–805, 2007.
[26]S. Rubio and A. Corominas, “Optimal manufacturing–remanufacturing policies in a lean production environment,” Computers and Industrial Engineering, vol. 55, pp. 234–242, 2008.
[27]J. Pettersen, Defining lean production: some conceptual and practical issues,” The TQM Journal, vol. 21, 2, pp. 127-142, 2009.
[28]S. Bell, “Lean enterprise systems”, New York: Wiley Inter-Science, 2006. [29]J. Black, “Lean production”, New York: Industrial Press, Inc., 2008. [30]J. Nicholas, “Lean production for competitive advantage”, Boca Raton:
[31]D. Heider, M.J. Piovoso, and J.W. Gillespie Jr., “Application of a neural network to improve an automated thermoplastic tow-placement process,” Journal of Process Control, vol. 12, pp. 101-111, 2002.