http://www.sciencepublishinggroup.com/j/acm doi: 10.11648/j.acm.20180703.17
ISSN: 2328-5605 (Print); ISSN: 2328-5613 (Online)
A Forecast Model for Language
Under the Influence of
Immigration
Geng Liu
1, *, Keai Yang
2, Zhuojun Yao
21
Department of Mathematics, Rongcheng College of Harbin University of Science and Technology, Weihai, China
2Department of Economics & Management, Rongcheng College of Harbin University of Science and Technology, Weihai, China
Email address:
*
Corresponding author
To cite this article:
Geng Liu, Keai Yang, Zhuojun Yao. A Forecast Model for Language Under the Influence of Immigration. Applied and Computational Mathematics. Vol. 7, No. 3, 2018, pp. 121-129. doi: 10.11648/j.acm.20180703.17
Received: June 1, 2018; Accepted: July 11, 2018; Published: July 19, 2018
Abstract:
Under the influence of globalization, population distribution of different languages has become a matter of universal concern. In this paper, the mater is considered from three aspects. First of all, Gray Model is used to predict the number of second language speakers. Then, the influencing factors are taken into account to predict the number of net immigrants through the BP neural network. Finally, while considering the impact of immigration, Logistic growth model are used to predict the population of native speakers. In order to analyze the demographic changes in different regions, firstly, logistic growth model is used to predict the population in different regions. Secondly, influencing factors are combined with the BP neural network to predict the number of net immigrants in the next 50 years. Based on the forecast, French will surpass the Punjabi, which ranks number nine to become the tenth language with the greatest number of native speakers. As for the total number of speakers using a particular language, native speakers plus second language speakers are considered. The Gray Model is used to predict the number of second language speakers in different regions over the next 50 years. Based on the forecast, no language in the current top-ten lists will be replaced by another language. Net immigration is used to reflect the changing global language distribution over the next 50 years. GDP per capita, education funds, medical expenses and tourism revenue are identified as four factors. BP neural network are used to find out the relationship between influencing factors and net immigrants, and then the number of net immigration of different regions in the next 50 years are predicted. Numerical results demonstrated that model in this paper is efficient and promising.Keywords:
The Distribution of Languages, The Number of Speakers, Gray Model, BP Natural Network, Logistic Growth Model1. Introduction
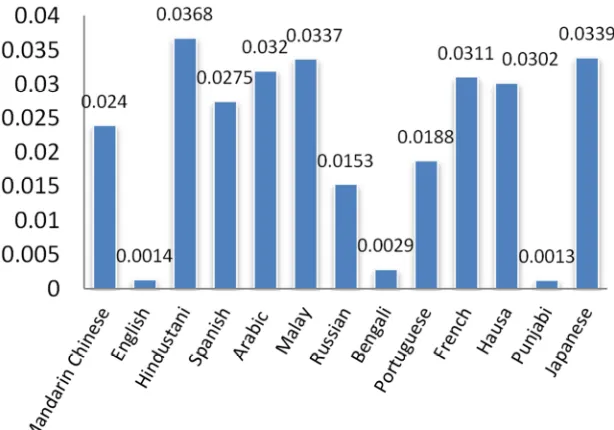
Language is the most important communication tool of human beings and the main expression of communication among people. At present, there are currently 6,900 languages on Earth, but not all languages are widely used. Among the ten languages most widely used are Mandarin (incl. Standard Chinese), Spanish, English, Hindi, Arabic, Bengali, Portuguese, Russian, Punjabi, and Japanese [1]. The proportion of different language users is shown in figure 1.
Although most languages are used as mother tongues, along with the social progress and economic development, these languages are gradually being used as the second language or
even the third language. Similarly, with economic development and transportation facilities, more and more people like to immigrate to economically developed countries. Therefore, a model is needed to be established to predict the number of people who master the multilingual and understand the trend of internationalization of the future language.
country as their mother tongue. While considering the impact of immigration, Logistic growth model is used to predict the
population in different language regions.
Figure 1. World population percentages.
By analyzing the demographic changes in different linguistic regions, two aspects, which are the changes in the population base and the net immigrants, are considered. The first aspect, Logistic growth model is used to predict the population in different language regions. The second aspect, influencing factors are combined with BP neural network to predict the number of net immigrants in the next 50 years.
According to total numbers of speakers of a particular language, native speakers plus second language speakers are only considered. Using the GM to predict the number of people who speak a second language, the number of people who speak a second language in different regions over the next 50 years is gotten.
2. Distribution Systems in Different
Languages
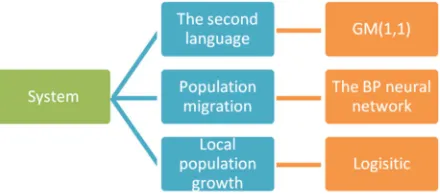
Before diving into the specific modeling steps, briefly explain the whole idea, analyze the flowchart shown in Figure 2.
Figure 2. Language distribution model.
A distribution model is established for people who speak
different languages. At the same time, various factors are taken into account. Three aspects are considered to analyze the problem, which are the number of second language speakers, the number of net immigration and native speakers. Considered these three aspects, different models are established and different influencing factors are analyzed. As you can see in the figure above, GM is used to predict the number of second language people, the Logistics model is used to predict the number of native speakers.
2.1. The Second Language
Due to the frequent exchanges in various regions, more and more people have mastered two languages or even more than two languages. People are also aware of the importance of mastery of multiple languages and begin to actively learn other languages. Since there are many influencing factors in the number of second language people and their relationship is very complicated and uncertain GM is used to predict the number of second language people.
2.1.1. Gray Model
Gray theory is a new method [3] for predicting uncertainty with poor information. It is applied widely for high accuracy and feasibility. Therefore, GM is used to predict the number of second language people. By looking up the data, the number of second language people from 1962 to 2018 is chosen as the data series. The process of establishing GM is as follows:
0 0 0 0 0
1 2 0 1 2
X( ) = x() x() ⋅ ⋅ ⋅ x() n x() k ≥ k = ⋅ ⋅ ⋅ n
( (), ( ), , ( ))( ( ) , , , , ) (1)
The new sequenceX(1)is generated by accumulating the
original data series,
1 1 1 1
1 2
X( ) = x() x( ) ⋅ ⋅ ⋅ x() n
( ( ) , ( ) , , ( ) ) (2)
where 1 0 1
1 2
k mx
k
x
m
k
n
=
=
∑
( =
⋅ ⋅ ⋅ )
() ()
(
)
(
)
,
,
,
(3)The mean generation sequence for 1 x( )
is as follows:
1 1 1 1
2
3
z
()=
z
()z
()⋅ ⋅ ⋅
z
()n
(
(
),
(
),
,
(
))
(4)where
1 1 1 1
1 2 3
2
z() k = x()k + x() k + , k = ⋅ ⋅ ⋅ n
( ) ( ( ) ( ) ) ( , , , ) (5)
So gray differential equation model of GM is
1 1
dx
ax t b
dt + =
() ()
() (6)
Set
(
(0)(2),
(0)(3),
(0)( )) , u=(a,b)
T TY
=
x
x
⋯
x
n
(1) (1) (1) 1 (2), 1 (3), 1 ( ), z z B z n − − = − ⋮
⋮ (7)
Then GM can be expressed as matrix equation:
Y
=
Bu
(8)With least square method the next formula are obtained:
1
( , )T ( T ) T
u a b B B B Y
∧ ∧ ∧
−
= = (9)
Calculate gray differential equation and the predictive model are obtained:
(1) (0)
(0) ( ) (1)
( 1) ( (1) )
( 1) exp( ( 1) ( )), 1, 2, 3, ,
ak
k
u u
x k x e
a a
x k x k x k k n
− ∧ ∧ ∧ + = − + + = + − = ⋯ (10)
Meanwhile, by serial-down calculation, the original series are gotten.
(0) (1) (1)
( ) ( ) ( 1)
x i x i x i
∧ ∧ ∧
= − − (11)
2.1.2. Testing the Model
In order to test the accuracy of GM, four indicators are taken into consideration, which are relative error, correlation
degree, mean square error ratio and small probability error.
1. Relative error: 0 0
( ) ( )
( ) 100%
( )
i x k x k q k
x k
−
= × ,
In addition, mean residual is:
2 1 ( ) 1 n k
q q k
n =
=
−
∑
(12)2. Correlation degree:
1 1 n
i k
k
R
n =η
=
∑
(13)where,
0 0
0 0
min min ( ) ( ) min min ( ) ( )
( ) ( ) min min ( ) ( )
s s
s t s t
i
i s
s t
x t x t x t x t
x k x k x t x t
ρ η
ρ
− + −
=
− + − (14)
[0,1]
∈
ρ ,Generally speaking, the closer this coefficient is
upper to 1, the better is the correlation degree. 3. Variance ratio:
1
0
S c
S
= (15)
where, 2 0 1 ( ( ) ) n k
S x k x
=
=
∑
− (16)4. Little probability of error
{
( )
0.6745
1}
p
=
ε
k
− <
ε
S
(17)Table 1. Annotation of this table.
Level q r c p
Level 1 (good) 0.01 0.90 0.35 0.95 Level 2 (qualified) 0.05 0.80 0.50 0.80 Level 3 (not very qualified) 0.10 0.70 0.65 0.70 Level 4 (not qualified) 0.20 0.60 0.80 0.60
After the number of second language people is predicted by GM, the accuracy of the model is tested. Through the Table.1, four indicators and its value can be seen.
Table 2. Indicators of 13 languages.
Languages q r c p
Mandarin Chinese 0.146 0.915 0.533 0.900 English 0.025 0.949 0.499 0.900 Hindustani 0.006 0.787 0.538 0.900 Spanish 0.017 0.744 0.593 1.000 Arabic 0.048 0.833 0.437 0.900 Malay 0.001 0.963 0.811 1.000 Russian 0.001 0.820 0.338 1.000 Bengali 0.004 0.756 0.363 1.000 Portuguese 0.027 0.843 0.406 0.900 French 0.027 0.656 0.578 1.000 Hausa 0.122 0.773 0.357 1.000 Japanese 0.031 0.874 0.574 1.000
2.2. Population Migration
To determine the situation of population migration, a model should be established to predict the condition of the population migration. Due to many factors that affect population migration, the relationship between these factors and immigrants is not linear and is complicated. Therefore, BP neural network model is chose to find the relationship between influencing factors and net immigrants. In this way, the number of net migrants is predicted in different language locales. In the end, the status of
future population movements is gotten.
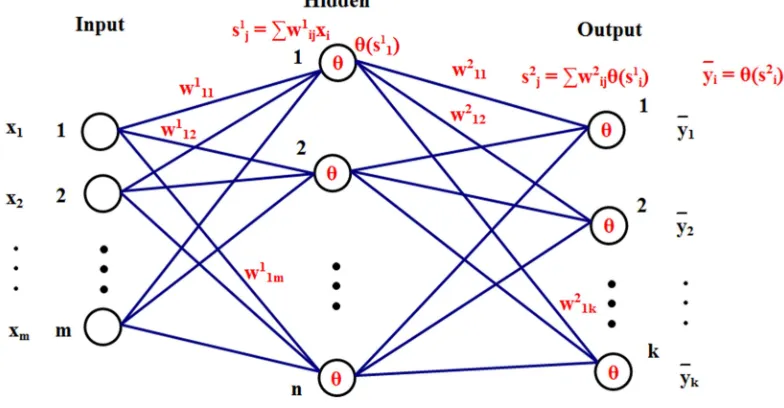
2.2.1. The BP Neural Network
BP neural network model are used to seek non-linear relationships between immigration influencing factors and immigrants. Before training the BP grid, the input sample set (also can see the influencing factor) and the output sample set are firstly determined. Therefore, the factors of that year are used as input samples, that year's number of migrants as output samples.
The BP neural network has any complex pattern classification ability and excellent multi-dimensional function mapping capability, which solves the problem of Exclusive OR, XOR and other problems that the simple perceptron cannot solve. In terms of structure, BP network has input layer, hidden layer and output layer. In essence, the BP algorithm is to calculate the minimum value of the objective function by using the gradient descent method [4].
The BP neural network firstly trains the grid before it is predicted. The network is trained to have the ability of associative memory and predictive power. BP neural network is training process as shown in Figure 3.
Figure 3. BP Neural Network.
After using MATLAB neural network toolbox for training grid, the weights and thresholds are got. After that, the relationship between the number of immigrants in different linguistic locales and the influencing factors are obtained.
2.2.2. Testing the Model
When the grid is trained, the first 10 groups of data are used as the training samples, and the later four groups are
used as the test samples to train the grid with smaller errors. The Figure 4 shows the error in the 13 most common languages that processed.
Figure 4. Errors of 13 languages.
2.3. Local Population Growth
Mother tongue is the language of the country where it is spoken and the language that represents its own identity. Then, the number of native speakers equivalent can be made to the number of natives and predict the number of native speakers using the population growth model. Here, the world's population is fitted by looking up the data and find that the fitted curve fits the Logistic model. Therefore, the Logistic model is used to predict and consider the immigration data.
2.3.1. Logistic Model
Logistic population growth model combines net population growth and the number of population [6]. Then a reasonable model are got, which brings year and population data to a logistic growth model.
0
( )
1 (
1)
mrt m
x
x t
x
e
x
−
=
+
−
(18)Assume that immigrants will change their mother tongue after immigration. Therefore, the number of native speakers is population plus the number of immigrants.
2.3.2. Testing the Model
The number of native speakers is predicted by using Logistic population growth model. The most-used 13 language regions are used to predict. And errors are all controlled within 0.05.
3. The Number of Speakers
Using the model, what will happen to the numbers of native speakers and total language speakers in the next 50 years can be predicted. Native speakers and total language speakers are
taken into the consideration
3.1. Native Speakers
For population projections, the Logistic model is used, and the impact of immigration is considered. Assume that the immigrant population speaks the language of its immigrant nation as its mother tongue. Therefore, the total number of native speakers is the number of people in the country plus the number of immigrants.
1
=
i i i i
j E M i i t M
L
L
L
L
a
b e
−=
+
+
+
(19)Where:
i j
L
is the total number of man who make the language ofi
thin 2018 as mother tongue after
j
years;i E
L
is the natural growth of man who take the language ofth
i
after 2018 as mother tongue;i M
L
is the natural growth of man who take the language ofth
i
after 2018 as mother tongue.3.1.1. Immigration
There are many factors that affect immigration. The four aspects are mainly analyzed,which are economic, education,
social welfare and service industry. Through analyzing, four factors: per capita GDP, education funds, medical expenditure and tourism revenue are identified. Data is looked up in countries from 1962 to 2018 through Wikipedia. The statistics that got are about five years. By processing these data, four indicators of the location of different language users about five years can be got.
regions in the next 50 years.
3.1.2. Population Growth
The logistic model is used to predict population growth.
The number of native speakers in the next 50 years is predicted through the model, and the Figure 5 shows the trend of population change.
Figure 5. Predict the number of native speakers.
It can be seen from the Figure 5 that the number of people in each region tends to be stable.
The predicted migration data is added to the population growth data, getting the total number of native speakers of a language in 50 years. The data are sorted and made a comparison.
Table 3. Rank of the nation speakers.
Rank Country Country (after 50 years)
1 Mandarin Chines Mandarin Chines 2 Spanish Spanish 3 English English 4 Hindustani Arabic 5 Arabic Hindustani 6 Bengali Portuguese 7 Portuguese Bengali 8 Russian Russian 9 Punjabi Japanese 10 Japanese French
As can be seen from the above Table 3, from the perspective of native speakers, there is no change in the top three languages of native speakers, which are also Mandarin Chinese, Spanish and English, still the top three. Arabic drop from fourth to fifth, Hindustani rise from fifth to fourth, Bengali drop from sixth to seventh, Portuguese rise from seventh to sixth, Russian also rank eighth, Japanese rise from the tenth to the ninth, Punjab drop out of top ten, French become the tenth instead of Punjab.
3.2. Total Language Speakers
People who have more than two languages will not be considered, so the total language speakers can be defined as the formula below.
i i i
j j j
T =L +S (20)
Where:
i j
T is the total number of man who speak the language of
th
i
in 2018 afterj
years; ij
S
is the total number of man who make the language ofth
i
in 2018 as second language afterj
years.After predicting the total number of native speakers, the total number of people who speak a second language is predicted, and the GM is used to make predictions.
By looking at the data from 1962 to 2018, the number of people who speak a second language data, the use of these data, through the GM, to predict the number of people who speak a second language after 50 years of change trend here is 13 languages spoken by the largest number of forecast results.
Figure 6. Prediction of the number of second language speakers.
The number of total language speakers in 50 years, and the changes in the top ten are shown in the Table 4.
Table 4. Rank of the total language speakers.
Rank Country Country (after 50 years)
1 Mandarin Chinese English
2 English Mandarin Chinese 3 Hindustani Arabic
4 Spanish Spanish 5 Arabic Hindustani 6 Malay Malay 7 Russian Russian 8 Bengali Portuguese 9 Portuguese Bengali 10 French French
Through the above Table 4, it can be known that the total language speakers after 50 years of ranked first by the standard Chinese language into English, standard Chinese fell to the second, Hindustani fall by a third to the fifth Arabic rising from the fifth to the third. In the eighth Bengali fell to ninth, Portuguese rose for the eighth. The rest of the basic did not change. Compared with 50 years later, the language category will not change, while the rank will vary.
4. Population Migration
Based on 50 years to predict future global migration patterns, judgment will be made to determine whether the geographical distribution of language change. In the model, BP neural network are used to predict the number of immigrants. Language distribution will be influenced by the number of immigrants. Through the change of immigration,
the change of the geographical distribution of language is described.
There are many factors that affect immigration. The four aspects of economy are mainly analyzed, education, social welfare and service industry. The result of analyze is that four factors were identified: per capita GDP, education funds, medical expenditure and tourism revenue. Four data from countries from 1962 to 2018 are looked up, through Wikipedia. The statistics that got are about five years. By processing these data, four indicators of the location of different language users about five years can be got.
For the next 50 years the migration data of different language areas, the influence factor of the next 50 years data values also needed to be predicted. The Gray Model are introduced to predict the future 50 years language users local GDP, per capita education, expenditure health spending and tourism revenue. The forecast data values are got into the trained network as the input data, to get the number of immigrants in different language areas after 50 years.
The 13 languages used the most are chosen to analyze and predict the immigration data.
As shown in Figure 7, it can be known that the net immigration trends in different language regions. Chinese language areas of immigration are stable, English language areas of immigration growth before falling. Hindustani, Arabic and Bengali language areas of the population has been removed from the state. And removed from the quantity is more and more big Spanish language areas of immigration leveled off French language areas of immigration to decline after reaching steady.
Figure 7. Projections of immigration.
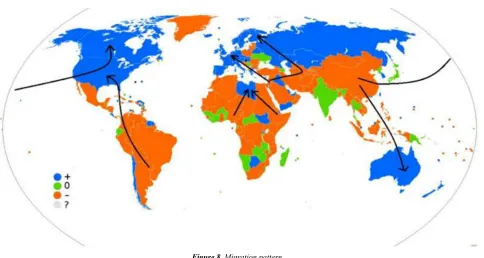
Figure 8. Migration pattern.
In the Figure 8, the blue area is a place where a large population of immigration flow in, the green area population moving in and out of the basic equal, the red area is a place where a large population of immigration flow out. This is almost the same with the forecast population migration data.
5. Conclusion
This model combines Gray Model, BP neural network and logistic growth models to form a complex system and predict the change of language population from three aspects. And sensitivity analysis proves the model is very robust. Based on the forecast, no language in the current top-ten lists will be replaced by another language in the next 50 years. It's worth noting that English will overtake Mandarin Chinese as the language with the largest number of speakers, and Mandarin Chinese will drop to second place At the same time, the model obtained the distribution of world languages in the next 50 years, and the branches of transnational corporations, embassies and other organizations could send corresponding talents accordingly.
References
[1] Brownell M D, Ekuma O, Nickel N C, et al. A population-based analysis of factors that predict early language and cognitive development [J]. Early Childhood Research Quarterly, 2016, 35:6-18.
[2] Molinaro N, Giannelli F, Caffarra S, et al. Hierarchical levels of representation in language prediction: The influence of first language acquisition in highly proficient bilinguals. [J]. Cognition, 2017, 164:61.
[3] Wu L F, Liu S F, Liu J. GM (1, 1) model based on fractional order accumulating method and its Stability [J]. Control & Decision, 2014, 29 (5):919-924.
[4] Qi D. On Design of the BP Neural Network [J]. Computer Engineering & Design, 1998.
[6] Law R, Murrell D J, Dieckmann U. Erratum: Population Growth in Space and Time: Spatial Logistic Equations [J]. Ecology, 2003, 84 (2):535-535.
[7] Kozlov V, Radosavljevic S, Wennergren U. Large time behavior of the logistic age-structured population model in a changing environment [J]. Asymptotic Analysis, 2017, 102(1-2):21-54.
[8] Zhang X, Liu Y. The city taxi quantity prediction via GM-BP model [C]// IEEE International Conference on Cyber Technology in Automation, Control, and Intelligent Systems. IEEE, 2015:1594-1598.
[9] Niyogi P, Berwick R C. The proper treatment of language acquisition and change in a population setting. [J]. Proceedings of the National Academy of Sciences of the United States of America, 2009, 106 (25):10124-10129.
[10] Ortega F, Peri G. The effect of income and immigration policies on international migration [M]// The Economics of International Migration. 2016:333-360.