1
Department of Soil Science and Agricultural Chemistry, College of Horticulture, Kerala Agricultural University, Vellanikkara, Thrissur, India
2
Assistant Professor, Soil Science and Agricultural Chemistry, Rice Research station, Vyttila
Abstract
The Pokkali rice cultivation is prevalent in acid saline soils, along the coastal tract of Ernakulam, Alapuzha and Thrissur districts of Kerala. The Pokkali cultivation passes through different stages of cultivation, starting from mound preparation to harvest. During the time of harvest, the fields are almost dry and by the time of harvest, the fields become completely waterlogged. This shift in the moisture regime causes a great variation in the nutrient status of the Pokkali soil. Along with it, changes in soil pH and electrical conductivity play a role in the nutrient dynamics in these soils. The present study was undertaken to understand the nutrient dynamics of Pokkali soil during the two different stages of cultivation namely mound preparation and harvest stages. The soil samples were collected from eight Pokkali padashekarams of Kottuvally panchayath and RRS, Vyttila Organic carbon, available nitrogen and magnesium showed a decreasing trend from mound preparation to harvest stage. The available nutrients namely P, K, Ca, S, Fe, B, Al and Na followed an increasing trend from mound preparation to harvest stage. Available Zn, Mn and Cu did not show any significant difference between two stages.
Keywords: Pokkali rice; acid saline Pokkali soil; mound preparation; harvest; nutrient status
I. INTRODUCTION
A unique system of rice cultivation is practiced along the coastal tract of Kerala in acid saline soils, which is known as the ‘Pokkali cultivation’. Actually it is named after a traditional variety of rice called Pokkali. These fields are low lying marshes situated near the estuaries of rivers and they are close to the sea.
The Pokkali rice is cultivated once in a year and cultivation extends between June to early
November when the fields have low salinity. The Pokkali farming passes through different stages of cultivation, starting from mound preparation to harvest. The cultivation practices are triggered by the strengthening of outer bunds, by the month of April. Sluices are set up to regulate the water flow. During low tide, the fields are drained and the sluices are closed at high tide. This helps in drying of the soil. Then mounds are formed, favouring the washing off salts by the action of the rain water during May – June. Then the sprouted seeds are sown [9]. By the time of harvest, the fields become completely waterlogged. Rice is harvested by the end of September. During harvest, only the panicles are cut. The rest of the stalks are left in the field itself [5]. Rice cultivation is followed by shrimp filtration during the high saline phase [8].
II. MATERIALS AND METHODS
The present investigation was undertaken in eight Pokkali padashekarams of Kottuvally panchayath and RRS, Vyttila (Table 1). The nine locations are designated as L1, L2, L3, L4, L5, L6, L7, L8, and L9. The georeferenced soil samples were collected during two stages of cultivation namely mound preparation and harvest stages and analysed for organic carbon, available N,P,K, Ca, Mg, S, Fe, Mn, Zn, Cu, B, Al and Na to assess the nutrient status in acid saline Pokkali soils.
Table 1. Locations selected for study
Locations Designation N latitude E longitude
Mundothuruth L1 10˚05'730" 076˚15'196"
Kalappumpadi L2 10˚06'393" 076˚14'654"
Muppathezhukettu L3 10˚06'142" 076˚14'680"
Periyali L4 10˚06'345" 076˚14'554"
Diamond L5 10˚06'446" 076˚14'576"
Kaitharam L6 10˚06'765" 076˚14'339"
Padinjare kaitharam L7 10˚06'345" 076˚13'576"
Thathapilli L8 10˚06'826" 076˚14'002"
RRS, Vyttila L9 09˚58'520" 076˚19'329"
Organic carbon of the soil was estimated by wet digestion method [14]. Available nitrogen in soil was estimated using alkaline potassium permanganate method. Available phosphorus in the soil samples was extracted using Bray No.1 reagent [2] and determined colorimetrically by the reduced molybdate ascorbic acid blue colour method. Available potassium and sodium in the soil samples was extracted using neutral normal ammonium acetate and it was estimated by flame photometry [4]. Available calcium and magnesium were determined using neutral normal ammonium acetate extract of soil with the help of atomic absorption spectrophotometer. Available sulphur in soil samples were estimated using spectrophotometer, after the extraction using CaCl₂ (0.15 %) [12]. Available micronutrients in soil samples were estimated using 0.1M HCl extract of soil [10]. Available boron in soil samples was estimated with hot water method [3]. Available Aluminium was estimated from soil samples using 0.1 M BaCl2 as the extracting agent and analysed using atomic absorption spectrophotometer.
III. RESULTS AND DISCUSSION
The soil reaction and electrical conductivity of soil is presented in table 2.
Locations Soil pH Electrical conductivity
Mound preparation Harvest Mound preparation Harvest
Mundothuruth 3.08 3.597 5.7 2.033
Kalappumpadi 2.84 3.727 5.533 2.633
Muppathezhukettu 3.29 4.193 5.133 2.1
Periyali 3.287 3.65 5.233 2.333
Diamond 2.933 3.453 8.067 3.567
Kaitharam 3.127 3.753 5.633 2.233
Padinjare kaitharam 2.84 3.243 6.333 2.9
Thathapilli 2.843 2.72 5.067 2.733
The soil reaction (pH) was highest during harvest, compared to the mound preparation stage. But electrical conductivity decreased from mound preparation to harvest stage. The inbuilt acidity of Pokkali soil becomes more dominant, when the salinity is washed away.
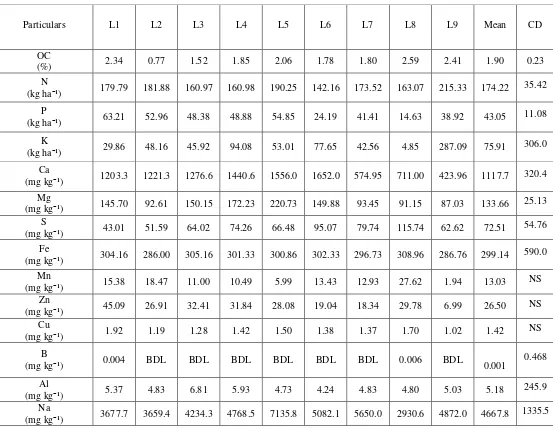
Table 2. Nutrient status of nine locations collected during mound preparation stage of cultivation
The nutrient status of Pokkali soil during mound preparation and harvest stage has been presented in the table 3 and 4.
The organic carbon content of Pokkali soil was found to possess high fertility status during both stages (> 0.75 %). Comparing two stages, organic carbon and available nitrogen was more at mound preparation stage. The breakdown of SOM and plant residues is typically slower in submerged than aerobic soil [1]; [13].This resulted in slow nitrogen mineralization in Pokkali soil. Available phosphorus content in Pokkali soil during mound preparation and harvest stages came under high fertility status. A slight increase of available P was observed from mound preparation to harvest stage. This increase can be
Particulars L1 L2 L3 L4 L5 L6 L7 L8 L9 Mean CD
OC
(%) 2.34 0.77 1.52 1.85 2.06 1.78 1.80 2.59 2.41 1.90 0.23
N
(kg ha⁻¹) 179.79 181.88 160.97 160.98 190.25 142.16 173.52 163.07 215.33 174.22 35.42
P
(kg ha⁻¹) 63.21 52.96 48.38 48.88 54.85 24.19 41.41 14.63 38.92 43.05 11.08
K
(kg ha⁻¹) 29.86 48.16 45.92 94.08 53.01 77.65 42.56 4.85 287.09 75.91 306.0
Ca
(mg kg⁻¹) 1203.3 1221.3 1276.6 1440.6 1556.0 1652.0 574.95 711.00 423.96 1117.7 320.4
Mg
(mg kg⁻¹) 145.70 92.61 150.15 172.23 220.73 149.88 93.45 91.15 87.03 133.66 25.13
S
(mg kg⁻¹) 43.01 51.59 64.02 74.26 66.48 95.07 79.74 115.74 62.62 72.51 54.76
Fe
(mg kg⁻¹) 304.16 286.00 305.16 301.33 300.86 302.33 296.73 308.96 286.76 299.14 590.0
Mn
(mg kg⁻¹) 15.38 18.47 11.00 10.49 5.99 13.43 12.93 27.62 1.94 13.03 NS
Zn
(mg kg⁻¹) 45.09 26.91 32.41 31.84 28.08 19.04 18.34 29.78 6.99 26.50 NS
Cu
(mg kg⁻¹) 1.92 1.19 1.28 1.42 1.50 1.38 1.37 1.70 1.02 1.42 NS
B
(mg kg⁻¹) 0.004 BDL BDL BDL BDL BDL BDL 0.006 BDL 0.001 0.468
Al
(mg kg⁻¹) 5.37 4.83 6.81 5.93 4.73 4.24 4.83 4.80 5.03 5.18 245.9
Na
attributed to the release of P from insoluble Fe and Al compounds under submerged conditions [11]. There was an increase in the available potassium content of Pokkali soil, with the advance of submergence. This significant increase may be due to the frequent tidal action [7].
Table 2. Nutrient status of nine locations collected during harvest stage of cultivation
Available calcium was found to be higher (> 300 mg kg⁻¹) in different locations during two stages of cultivation. The presence of lime shells adds to the calcium content of the soil. Available Mg followed a decreasing trend from mound preparation to harvest. High content of available sulphur was recorded in
Pokkali soils. The high levels of S owe to the high organic matter content as well as the seawater
inundation.
Particulars L1 L2 L3 L4 L5 L6 L7 L8 L9 CD
OC
(%) 0.74 1.43 0.75 1.22 1.38 1.21 1.41 1.03 1.63 1.20 0.23
N
(kg ha⁻¹) 64.81 56.44 73.17 58.53 52.26 39.72 64.81 140.17 156.80 78.52 35.42
P
(kg ha⁻¹) 31.45 30.96 46.09 27.47 64.90 53.361 30.165 19.712 119.265 47.044 11.08
K
(kg ha⁻¹) 599.63 1616.92 1406.50 1389.10 1288.02 2334.12 1108.37 779.28 1056.64 1286.51 306.43
Ca
(mg kg⁻¹) 797.81 1123.11 1374.99 1742.88 1641.64 2287.75 2029.50 1652.15 609.26 1473.23 320.40
Mg
(mg kg⁻¹) 43.01 51.59 64.02 74.26 66.48 95.07 79.74 115.74 62.62 72.51 25.13
S
(mg kg⁻¹) 196.08 274.82 259.21 328.02 401.93 365.49 303.14 556.86 111.68 310.80 54.76
Fe
(mg kg⁻¹) 584.71 763.12 959.61 1061.82 3904.32 1379.67 954.07 1855.63 882.46 1371.71 590.04
Mn
(mg kg⁻¹) 7.21 8.64 8.22 8.28 9.05 18.52 8.63 102.84 BDL 19.04 NS
Zn
(mg kg⁻¹) 19.19 21.68 50.10 20.11 20.24 17.16 19.63 66.63 13.68 27.60 NS
Cu
(mg kg⁻¹) 0.64 0.70 1.21 0.62 1.00 0.86 1.00 3.64 2.24 1.32 NS
B
(mg kg⁻¹) 0.78 0.85 2.181 2.921 1.714 1.658 1.440 1.837 0.977 1.596 0.46
Al
(mg kg⁻¹) 496.76 687.63 755.76 943.16 1028.84 1202.64 1137.86 2317.81 763.75 1037.13 245.96
Na
mound preparation stage. The presence of large content of boron and sodium during harvest may be due to sea water inundation.
IV. ACKNOWLEDGEMENTS
The financial assistance given by Kerala Agricultural University in the form of Junior Research Fellowship to the first author is gratefully acknowledged.
BIBILIOGRAPHY
[1] Acharya, C.N. 1935. Studies on the anaerobic decomposition of plant materials. III. Comparison of the course of decomposition of rice straw under anaerobic, aerobic, and partially aerobic conditions. Biochem. J. 29:1116–1120. [2] Bray, R. H. and Kurtz, L. T. 1945. Determining total, organic and available forms of phosphate in soils. Soil Sci. Soc. Am.
J. 64: 2115-2124.
[3] Gupta, U. C. 1972. Effects of boron and limestone on cereal yields and on B and N concentrations of Plant tissue.
Commun Soil Sci. Plant Anal. 6: 439-450.
[4] Jackson, M. L.1958. Soil Chemical Analysis. Prentice Hall of India Private Ltd., New Delhi, 498p.
[5] Jayan, P.R. and Sathyanathan, N. 2010.Overview of farming practices in the water logged areas of Kerala, India. Int. J.
Agri. & Bio. Eng. 3(4): 1-16.
[6] Ponnamperuma, F.N. 1972. The chemistry of submerged soils. Adv. Agron. 24:29–96.
[7] Sasidharan, N.K. 2004. Enhancing the productrivity of the rice- fish/ prawn farming system in Pokkali lands. Phd thesis, Kerala Agricultural University, Thrissur, 190p.
[8] Sasidharan, N.K., Abraham,C.T., and Rajendran, C.G. 2012. Spatial and temporal integration of rice, fish and prawn in the coastal wetlands of central Kerala, India. J. Trop. Agric. 50: 15-23
[9] Shylaraj, K. S., Sreekumaran, V., and Annie, K. 2013. Five decades of glorious research at the Rice Research Station,
Vyttila (1958-2013). Directorate of extension, Kerala Agricultural University, Thrissur, 80p.
[10]Sims, J. R. and Johnson, G. V. 1991. Micronutrient soil tests. In: Mortvedt, J. J., Cox, F. R., Human, L. M. and Welch, R. M. (eds), Micronutrient in Agriculture (2nd Ed.).SSSA, Madison, USA, pp. 427-476
[11]Snyder, C. S. 2002.Effects of soil flooding and drying on phosphorus reactions. Potash & Phosphate Institute (PPI) and the Potash & Phosphate Institute of Canada (PPIC), Conway, Canada, 4p.
[12]Tabatabai, M. A. 1982. Sulphur, In: Page, A. L., Miller, R. H. and Keeney, D. R. (eds), Methods of Soil Analysis Part 2.
Chemical and microbiological Properties (2nd Edition). American Society of Agronomy and Soil Science Society of
America, Madison, USA. pp.501-534.
[13]Villegas-Pangga, G., G. Blair, and R. Lefroy. 2000. Measurement of decomposition and associated nutrient release from
straw (Oryza sativa L.) of different rice varieties using perfusion system. Plant Soil 223:1–11.