Rao et al. World Journal of Pharmaceutical and Life Sciences
ANALYTICAL METHOD DEVELOPMENT AND VALIDATION OF ANTIDIABETIC
DRUGS (METFORMIN AND LINAGLIPTIN) IN TABLET DOSAGE FORM BY USING
RP- HPLC METHOD
S. Srinivasa Rao*, M. Chandra Shekar, N. Nagaprasanna and T. Supriya
Pulla Reddy Institute of Pharmacy, Domadugu, Gummadidala, Sangareddy, Telangana.
Article Received on 13/06/2019 Article Revised on 03/07/2019 Article Accepted on 23/07/2019
INTRODUCTION
Compound 1: Metformin is a oral tablet available as generic drugs and brand names are Glucophage, fortamet and glumetza. Metformin decreases hepatic glucose production, decreases intestinal absorption of glucose, and improves insulin sensitivity by increasing peripheral glucose uptake and utilization.
Compound 2: Brand name of drug is tradjenta and
generic name is linagliptin. It is a DPP-4 inhibitor developed by Boehringer Ingelheim for the treatment of type II diabetes. Two pharmacological characteristics that sets linagliptin apart from other DPP-4 inhibitors is that it has a non-linear pharmacokinetic profile and is not primarily eliminated by the renal system.
MATERIALS AND METHOD
Chemicals and Reagent: PREPARATION OF MOBILE PHASE
Transfer 1000ml of HPLC water into1000ml of beaker and add 0.1M KH 2 PO 4.
Transfer the above prepared KH 2 PO 4 buffer and Methanol is mixed in the proportion of (65:35).
They are mixed and sonicated for 20min.
PREPARATION OF METFORMIN AND
LINAGLIPTIN STANDARD AND SAMPLE
SOLUTION
PREPARATION OF STANDARD SOLUTION
Accurately weigh and transfer 500mg Metformin and 20mg Linagliptin into 100ml of volumetric flask and add 10ml of methanol and sonicate 10min (or) shake 5min and make with methanol.
Transfers the above solution into 1ml into 10ml volumetric flask dilute to volume with water.
METHODOLOGY
PREPARATION OF SAMPLE STOCK SOLUTION
Commercially available 20 tablets ware weighed, powdered and the powdered equivalent to the 870 mg of Metformin and Linagliptin of active ingredients were transfer into a 100ml of volumetric flask and add 10ml of Methanol and sonicate 20min (or) shake 10min and makeup with methanol. transfers above solution 1ml into 10ml of the volumetric flask dilute the volume with Water. And the solution was filtered through 0.45μm filter before injecting into HPLC system.
World Journal of Pharmaceutical and Life Sciences
WJPLS
www.wjpls.org
SJIF Impact Factor: 5.088*Corresponding Author: Prof. S. Srinivasa Rao
Pulla Reddy Institute of Pharmacy, Domadugu, Gummadidala, Sangareddy, Telangana.
ABSTRACT
A new, simple, precise, accurate and reproducible RP-HPLC method for Simultaneous estimation of bulk and pharmaceutical formulations. Separation of Metformin and Linagliptin was successfully achieve dona THERMO, C18, 250cmx4.6mm, 5µm or equivalent in an isocratic mode utilizing KH2PO4: Methanol (65:35) at a flow rate of
1.0mL/min and eluate was monitored at 226nm, with a retention time of 3.132 and 3.728 minutes for Metformin and Linagliptin respectively. The method was validated and found to be linear in the drug concentration range of 50µg/ml to150 µg/ml for Metformin and 50µg/ml to150 µg/ml for Linagliptin. The values of the correlation coefficient were found to 0.999for Metformin and 1 for Linagliptin respectively. The LOD and LOQ for Metformin were found to be 1.909 and 6.362 respectively. The LOD and LOQ for Linagliptin were found to be 0.0349 and 0.1163 respectively. This method was found to be good percentage recovery for Metformin and Linagliptin were found to be 100 and 100 respectively indicates that the proposed method is highly accurate. The method was extensively validated according to ICH guidelines for Linearity, Accuracy, Precision, Specificity and Robustness.
RESULTS AND DISCUSSION
SYSTEM SUITABILITY: System suitability data of Metforminand Linagliptin
parameter Metformin Linagliptin Acceptance criteria
Retention time 3.132 3.728 +-10 Theoretical plates 4560 7688 >2500 Tailing factor 1.59 1.56 <2.00
% RSD 0.4 0.4 <2.00
Standard Results of Metformin
S.no Sample name RT Area USPplate count USP tailing
1. Injection 1 3.728 4634008 7668 1.59 2. Injection 2 3.729 4606703 7787 1.57 3. Injection 3 3.726 4631981 7762 1.60 4. Injection 4 3.723 4622848 7646 1.59 5. Injection 5 3.724 4653812 7713 1.59
Typical Chromatogram of Standard- Typical Chromatogram of Sample-
RESULT
Results of system suitability study are summarized in the above table. Six consecutive injections of the standard
solution showed uniform retention time, theoretical plate count, tailing factor and resolution for both the drugs which indicate a good system for analysis.
SPECIFICITY
S no Sample name Metforminarea Rt Linagliptin Area Rt
1 Standard 1892041 1.132 4606966 3.728 2 Sample 1904192 3.131 4627816 3.723
3 Blank - - -
-4 Placebo - - -
-Results of forced degradation study for Metformin
Type of stress Degradation
products/Drug
Retention
time % Area
Peak
purity Result
% Assay
%Amount Degraded
AcidicHydrolysis (mg/mL in
1N HCl) at 70ºC for 2 days - 3.130 1653385 0.999 Passed 86 14
BasicHydrolysis (mg/mL in
1N NaOH) at 70ºC for 2 days - 3.130 1634097 0.999 Passed 85 15
Oxidative
Hydrolysis (mg/mL in 3%
v/v H2O2) at 70 ºC for 2 days
- 3.133 1643883 0.999 Passed 86 14
Photo Degradation (to UV
light) for 14 days - 3.131 1617526 0.999 Passed 84 16
Thermal Degradation at
Results of forced degradation study for Linagliptin
Type of stress Degradation
products/ Drug (D)
Retention
time % Area
Peak
purity Result
% Assay
%Amount Degraded
Acidic Hydrolysis (mg/mL in
1N HCl) at 70ºC for 2 days - 3.726 3891067 0.999 passed 84 16
Basic Hydrolysis (mg/mL in
1N NaOH) at 70ºC for 2 days - 3.729 3911416 0.999 passed 84 16
Oxidative
Hydrolysis (mg/mL in 3%
v/v) at 70 ºc for 2 days
- 3.731 3870137 0.999 passed 83 17
Photo Degradation (to UV
light) for 14 days - 3.730 3909913 0.999 passed 84 16
Thermal Degradation at
70ºC for 14 days - 3.733 3920769 0.999 passed 84 16
chromatogram representing specificity of standard
Chromatograms of Acid stress treated Metformin and Chromatograms of Base stress treated Metformin and Linagliptin mixture
RESULT
The forced degradation study showed the method was highly specific, the chromatographic peaks does not interfere with any other impurities. This proves that,
excipients have no effect on the analytical method. On the other hand, blank peak did not overlap drug peak. So the method is highly selective.
ACCURACY
Accuracy data for Metformin
S.NO Accuracy Level Injection Sample area RT
1 50%
1 953677 3.122 2 953428 3.124 3 953033 3.122
2 100%
1 1901769 3.131 2 1901974 3.134 3 1902392 3.136
3 150%
Accuracy (%recovery) results of Metformin
S.NO Accuracy
level
Sample
name Sample weight
μg/ml added
μg/ml
found % Recovery
% Mean
1 50%
1 435.00 247.500 245.91 99
99 2 435.00 247.500 246.08 99
3 435.00 247.500 246.06 99
2 100%
1 870.00 495.000 494.09 100
100 2 870.00 495.000 492.55 100
3 870.00 495.000 493.48 100
3 150%
1 1305.00 742.500 738.64 99
99 2 1305.00 742.500 737.88 99
3 1305.00 742.500 736.69 99
Accuracy data for Linagliptin
S.NO Accuracy Level Injection Sample area RT
1 50%
1 2325183 3.716 2 2317701 3.716 3 2317648 3.713
2 100%
1 4620300 3.721 2 4626991 3.725 3 4622070 3.726
3 150%
1 6948428 3.732 2 6949946 3.744 3 4940474 3.739
Accuracy (%recovery) results of Linagliptin
S.NO Accuracy
Level Sample name Sample weight μg/ml added μg/ml found % Recovery % Mean
1 50%
1 435.00 10.000 9.90 99
99 2 435.00 10.000 9.88 99
3 435.00 10.000 9.90 99
2 100%
1 870.00 20.000 19.73 99
99 2 870.00 20.000 19.74 99
3 870.00 20.000 19.75 99
3 150%
1 1305.00 30.000 29.66 99
99 2 1305.00 30.000 29.64 99
3 1305.00 30.000 29.64 99
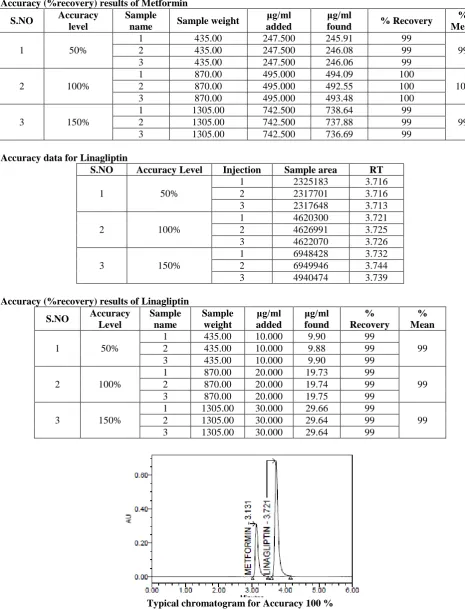
Typical chromatogram for Accuracy 100 %
RESULT
Results of accuracy study are presented in the above table. The measured value was obtained by recovery test. Spiked amount of both the drug were compared against the recovery amount.
4. PRECISION
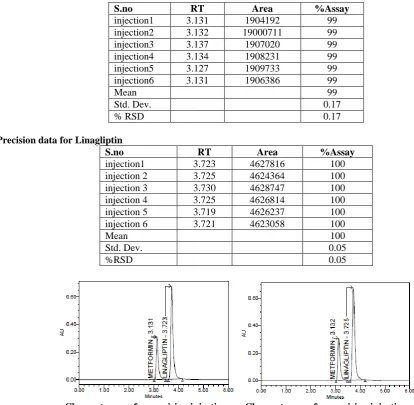
Precision data for Metformin
S.no RT Area %Assay
injection1 3.131 1904192 99 injection2 3.132 19000711 99 injection3 3.137 1907020 99 injection4 3.134 1908231 99 injection5 3.127 1909733 99 injection6 3.131 1906386 99
Mean 99
Std. Dev. 0.17
% RSD 0.17
Precision data for Linagliptin
S.no RT Area %Assay
injection1 3.723 4627816 100 injection 2 3.725 4624364 100 injection 3 3.730 4628747 100 injection 4 3.725 4626814 100 injection 5 3.719 4626237 100 injection 6 3.721 4623058 100
Mean 100
Std. Dev. 0.05
%RSD 0.05
Chromatogram for precision injection Chromatogram for precision injection
RESULTS
Results of variability were summarized in the above table. % RSD of peak areas was calculated for various
run. Percentage relative standard deviation (%RSD) was found to be less than 2% which proves that method is precise.
5. LINEARITY
Linearity data for Metformin
S.no Conc (μg/ml) RT Area
1. 50 3.125 953647
2. 75 3.137 1438138
Linearity plot of Metformin
Linearity data for Linagliptin
s.no Conc(μg/ml) RT Area
1. 50 3.720 2319958
2. 75 3.731 3474319
3. 100 3.733 4622273
4. 125 3.741 5788366
5. 150 3.748 6949516
Correlation coefficient (r2) 1
Linearity plot of Linagliptin
Chromatogram representing linearity
RESULT
6. ROBUSTNESS: Robustness data for Metformin
Parameter RT Theoretical plates Asymmetry
Decreased flow rate(0.8ml/min) 3.945 7450 1.62 Increased flow rate(1.2ml/min) 2.621 6131 1.55 Decreased temperature(200c) 3.940 7434 1.61 Increased temperature(300c) 2.621 6131 1.52
Robustness data for Linagliptin
Parameter RT Theoretical plates Asymmetry
Decreased flow rate (0.8ml/min) 4.678 8484 1.55 Increased flow rate (1.2ml/min) 3.118 7356 1.56 Decreased temperature(200c) 4.676 8409 1.55 Increased temperature(300c) 3.121 7304 1.55
Chromatogram for decreased flow rate Chromatogram for increased flow rate
Chromatogram for decreased temperature Chromatogram for increased temperature
RESULT
The results of Robustness of the present method had shown that changes made in the Flow and Temperature did not produce significant changes in analytical results which were presented in the above table. As the changes are not significant we can say that the method is Robust.
LIMIT OF DETECTION: Minimum concentration of
standard component in which the peak of the standard gets merged with noise called the LODLOD = 3.3* σ/S
Where; σ = standard deviation S = slope LOD for Metformin = 1.909 LOD for Linagliptin =0.0349
LOD data for Metformin and Linagliptin
S.No. Sample name RT Area
Chromatrogram for LOD: LIMIT OF QUANTIFICATION
Minimum concentration of standard component in which the peak of the standard gets detected and quantification
LOQ = 10*σ/S
Where; σ = standard deviation S = slope LOQ for Metformin = 6.362
LOQ for Linagliptin =0.1163
LOQ data for Metformin and Linagliptin
S.no Sample name RT Area
1 Metformin 3.134 3255 2 Linagliptin 3.716 9713
REFERENCES
1. H.H. Willard, L.L. Merritt, J.A. Dean, F.A. Settle. Instrumental Methods of Analysis, 7th edition, CBS publishers and Distributors, New Delhi, 1986; P.518-521, 580-610.
2. John Adamovies. Chromatographic Analysis of Pharmaceutical, Marcel Dekker Inc. New York, II Ed, P.74, 5-15.
3. Gurdeep Chatwal, Sahm K. Anand. Instrumental methods of Chemical Analysis, 5th edition, Himalaya publishing house, New Delhi, 2002; P.1.1-1.8, 2.566-2.570.
4. D. A. Skoog. J. Holler, T.A. Nieman. Principle of Instrumental Analysis, 5th edition, Saunders College Publishing, 1998; P.778-787.
5. Skoog, Holler, Nieman. Principals of Instrumental A nalysis, 5th Edition, Harcourt Publishers International Company, 2001; P.543-554.
6. William Kemp. Organic Spectroscopy, Palgrave, New York, 2005; P.7-10, 328-330.
7. P.D. Sethi. HPLC: Quantitative Analysis Pharmaceutical Formulations, CBS Publishers and distributors, New Delhi (India), 2001; P.3-137. 8. Michael E, Schartz IS, Krull. Analytical method
development and Validation, 2004; P. 25-46. 9. R. Snyder, J. Kirkland, L. Glajch. Practical HPLC
method development, II Ed, A Wiley International publication, 1997; P.235, 266-268, 351-353.653-600.686-695.
10. Basic Education in Analytical Chemistry. Analytical Science, 2001: 17(1).
11. Method validation guidelines International Conference on harmonization; GENEVA, 1996. 12. Berry RI, Nash AR. Pharmaceutical Process
Validation, Analytical method validation, Marcel Dekker Inc. New work, 1993; 57: 411-28.
13. Anthony C Moffat, M David Osselton, Brian Widdop. Clarke’s Analysis of Drugs and Poisons, Pharmaceutical Press, London, 2004; PP 1109-1110, 1601-1602.
14. Klaus Florey, Analysis Profile of Drugs Substances, Academic Press, New York, 2005; P.406-435. 15. P.N. Arora, P.K. Malhan. Biostatistics, Himalaya
Publishers House, India, P.113, 139-140,154. 16. Doserge, Wilson and Gisvold’s text book of organic
medicinal and pharmaceutical chemistry, 8th edn, Lippincott Company, 1982; P.183-197.