Telephone: +44 (0)1582 763133 Web: http://www.rothamsted.ac.uk/
Rothamsted Research is a Company Limited by Guarantee Registered Office: as above. Registered in England No. 2393175. Registered Charity No. 802038. VAT No. 197 4201 51. Founded in 1843 by John Bennet Lawes.
Rothamsted Repository Download
G - Articles in popular magazines and other technical publications
Kosack, K. E., Hawkesford, M. J., Mcmillan, V. E.,
Hammond-Kosack, M., Shepherd, G., Griffiths, S. and Foulkes, J. 2014. WGIN
Stakeholders' Newsletter [April 2014]. Department for Environment, Food
and Rural Affairs (DEFRA).
The publisher's version can be accessed at:
•
http://www.wgin.org.uk/stakeholders/WGIN%20Newsletters/WGIN_NL_%20April_
2014.pdf
The output can be accessed at: https://repository.rothamsted.ac.uk/item/8qy7q.
© 2014, Department for Environment, Food and Rural Affairs (DEFRA).
1
Contents:
Project Background Page 1 Research Updates Page 2 Subcontractor Projects / Events / News /
Publications Page 9
Images from 11th Stakeholder Event Page 10
Section 1 Project Background
The UK government is committed to more sustainable agriculture but this vision is facing an ever expanding range of environmental, energy and climate change challenges. Wheat is grown on a larger area and is more valuable than any other arable crop in the UK. Established in 2003, the Wheat Genetic Improvement Network (WGIN) arose directly from a realisation in the early 2000s that over the preceding two decades there had been a widening disconnection between commercial plant breeding activities and publicly funded plant and crop research. The overall aim of WGIN is to generate pre-breeding material carrying novel traits for the UK breeding companies and to deliver accessible technologies, thereby ensuring the means are available to produce new, improved varieties. An integrated scientific 'core' which combines underpinning work on molecular markers, genetic and genomic research, together with novel trait identification, are being pursued to achieve this goal. The programme is managed by a team including representatives of the key UK research groups and breeders. They ensure the programme and its outputs are communicated to the wider scientific and end user communities, via a web site
(www.wgin.org.uk), a stakeholder forum, focussed meetings and peer reviewed publications. WGIN liaises with equivalent operations overseas to ensure the programme is internationally competitive. The initial WGIN project ran for five years (2003-2008) and achieved considerable scientific success. In addition, the sustained networking activities and the availability of datasets generated by the project led to the establishment of many new wheat genetic improvement projects, including some funded jointly by the public sector and industry. Those funded by early 2008 were summarised in the May 2008 Stakeholders Newsletter (SNL) and since then many additional projects have been funded (see November 2010 SNL). There is no doubt that WGIN has a direct and significant impact on re-establishing the relationship between commercial plant breeding activities and public funded plant and crop research. However significant hurdles remain which currently prevent commercial implementation of much new research which should help to reduce the energy requirement and environmental impact of the UK wheat crop.
This project
The new WGIN Core Project started in 2008 to provide genetic and molecular resources for research in other Defra projects and for a wide range of wheat research projects in the UK. The resources under development include wheat genetic stocks, mapping populations, molecular markers and marker technologies, trait identification and evaluation, genomics and bioinformatics. The initially funded partners are the John Innes Centre (JIC), Rothamsted Research (RRes) and The University of Nottingham (UoN) but support has been allocated for sub-contracted projects which were awarded in open competition during 2009.
2
Section 2 Research UpdatesObjectives 2, 3 & 6: WGIN Develops New Resources for Wheat Gene Discovery (JIC)
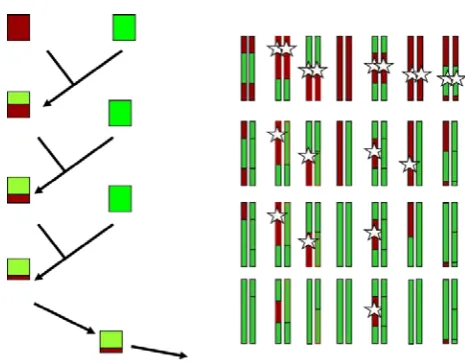
Bread wheat has 42 chromosomes (Figure 1). These chromosomes carry DNA which has a four letter alphabet (A, G, C, and T bases). It is different sequences of these bases that define what gene products are made. There are thousands of genes located on each wheat chromosome. Differences in gene sequences are the most important factors in determining how well the new wheat varieties, developed in wheat breeding programmes for the UK, perform. The majority of these differences are selected by breeders via the effect they have on crop performance or end use quality. WGIN produces resources that link wheat breeding in the UK to state of the art international projects that aim to fully describe the complete DNA sequence of all the wheat chromosomes (including the ~90% of the wheat genome that is not comprised of genes), giving breeders extra information on which DNA changes matter for UK agriculture.
Figure 1: The 42 chromosomes of bread wheat
In this article we are highlighting the production of genetic maps that have been developed using segregating populations developed within the WGIN project.
Avalon x Cadenza
WGIN proposed Avalon x Cadenza as a UK reference population. It comprises 204 doubled haploid lines between these parents which are very different from each other but both are very well adapted to the UK environment. The UK wheat research and breeding community embraced this concept with the result that a very large volume of high quality phenotypic data has been accumulated, in the case of WGIN data, this is publicly accessible. In addition to the phenotypic data, the concerted efforts of teams such as those at the University of Bristol led by Professor Keith Edwards have built on the original linkage map produced by WGIN to develop from Avalon x Cadenza one of the densest genetic maps in existence. WGIN workers have identified genes controlling key traits as quantitative trait loci (QTL). Over the last five years, WGIN has produced near isogenic lines (NILs) (Figure 2) that allow us to study the effects of these QTL in great depth because this type of germplasm reduces the ‘noise’ from other genes.
3
Paragon x Chinese SpringThe next three populations we describe all have Paragon as one the parents. In a similar idea to the Avalon x Cadenza reference population, WGIN proposed Paragon as a reference variety. Other resources like mutant and chromosomal deletion populations were developed in this variety. Partners within the BBSRC WISP programme adopted the use of Paragon, so results are comparable across many areas of research (http://www.wheatisp.org).
To complement this approach, WGIN developed a segregating population between Paragon and Chinese Spring. Chinese Spring will be the first wheat genome to be sequenced fully. So this population is useful in showing where these two genetic reference points are similar and where they are different. The population comprises 283 F8 recombinant inbreed lines (RILs) and has been used to develop a molecular map just short of 2000 genetic map units (cM) in length.
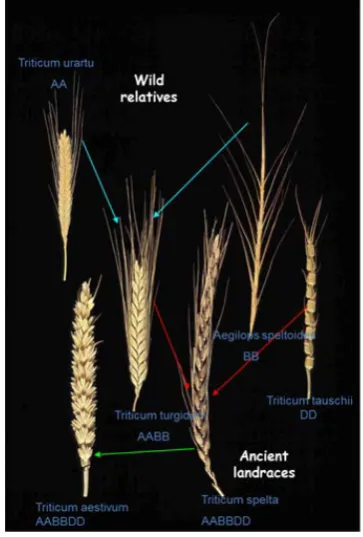
Figure 3 The evolution of bread wheat. The synthetic parent crossed with Paragon was produced by repeating this process under laboratory conditions
Paragon x Synthetic Bread Wheat
WGIN also committed to the development of a new segregating population between Paragon
and resynthesised bread wheat (Figure 3). WGIN used a synthetic developed by Ernie Sears, a towering figure in wheat genetics. This synthetic is derived from a cross between the wild ancestor of macaroni wheat and the weedy goat grass. We chose this line as a parent to create a very diverse population. Although the synthetic parent has absolutely no agronomic merit, genes within it could do, and the genetic map produced is useful in helping to combine maps together. Again, this is a RIL population with 251 lines and 1600 cM.
Paragon x Garcia
Wheat farmers and researchers from more arid parts of the world laugh when UK researchers mention the possibility of drought stress in the UK! However, recent years have seen periods of very low rainfall carrying significant yield penalties. The WGIN management group discussed UK drought data and drew on a previous Defra LINK project led by Dr Eric Ober to propose varieties with interesting drought tolerance characteristics for the UK. The variety Garcia was chosen, which is grown in northern Spain and southern France. This population is complete and comprises 351 RILs and the genetic map covers 1300 cM. Often the interpretation of drought data is difficult because variation in heading date means that tolerance and avoidance are difficult to discriminate between. It is hoped that this relatively large population size will allow the effects of flowering time and other traits beneficial under drought to be partitioned.
Bringing it all together
All the segregating populations and genetic maps described here are useful in their own right. However, the use of common gene based genetic markers and the interconnection of populations through common parents allows us to combine data to produce consensus genetic maps and alignments to sequenced genomes. WGIN is making major contributions to other UK and international projects to achieve this. Through this effort the identification of the gene sequences that control important variation for UK wheat breeding and farming is increasingly achievable.
4
Objective 8: Nitrogen Use Efficiency (NUE) and Quality QTLs linked to NUE (RRes)As in previous years, a field trial (The Diversity Trial) examining interactions of NUE and genotype was drilled in the autumn of 2012 and harvested in August 2013. Grain and straw yields were recorded and samples taken for nitrogen analysis. This trial was made available to the community for phenotyping / sub sampling. In total, 25 varieties subjected to 4 levels of Nitrogen
fertiliser application (0, 100, 200 & 350 kg/ha) were examined in this trial in a triplicate design. The 2013 harvest varieties consisted of elite current or older varieties. New varieties for the 2013harvest were AC Barrie (chosen because of exceptional high protein content and quality) and Cocoon (a taller variety which may have high nitrogen acquisition and utilisation capacity), replacing the two of the previously selected Avalon x Cadenza DH lines._________________
Figure 4: Mean yields of varieties with at least 3 years’ data since 2007, for each of the N levels, ranked on at 200 kg N/ha (N200). Error bars = standard deviations of the mean
Evident is the large impact of adding N fertiliser (compare N 0 with N 100, the relatively modest but significant yield increase between N 100 and N 200, and the minimal response above that (see N 350) (Figure 4). It is also clear that the rank order is comparable at all N input levels. Standard deviations are also plotted for N 200, clearly indicating the considerable year to year variation over the period of the study.
There is a clear season-dependent impact on relative performance with respect to N content,
over and above genotypic effects. The inverse relationship between yield and %N was noted with a clear additional interaction with year. As with yield, there was a notable differential stability of germplasm performance in terms of grain %N to climatic fluctuation (year to year variation, Figure 5).
5
Figure 5: Mean grain N concentration of the 33 varieties for which there is at least 2 years data since 2004 for N200 (200 kg N/ha). The varieties are ranked on their mean performance
In the autumn of 2013, the Diversity Trial was drilled again with 25 varieties, with varieties KWS Bonham and KWS Evoke replacing AC Barrie and Zebedee.
During 2014, in addition to the usual determination of NUE parameters, the trial will be assessed throughout the season using the new
Rothamsted UAV (Unmanned Aerial Vehicle, Figure 6) to monitor canopy development by NDVI (Normalised Difference Vegetation Index) and stress by thermal imaging. Further details on the UAV are available at:
http://www.rothamsted.ac.uk/news/aerial-eyes-crops
6
Objective 9: Identifying Robust Molecular Markers for Drought Tolerance (UoN)One DH mapping population (Savannah x Rialto, 94 lines) was characterised at Nottingham University (2 replicates) under irrigated and un-irrigated conditions in 2012-3. Measurements included anthesis date, plant height, combine grain yield, % stem water soluble carbohydrate at flowering (GS61) +10 days, onset and rate of leaf senescence and the grain 13/12C isotopic composition. Overall drought in the unirrigated treatment decreased grain yield (7.66 t/ha)
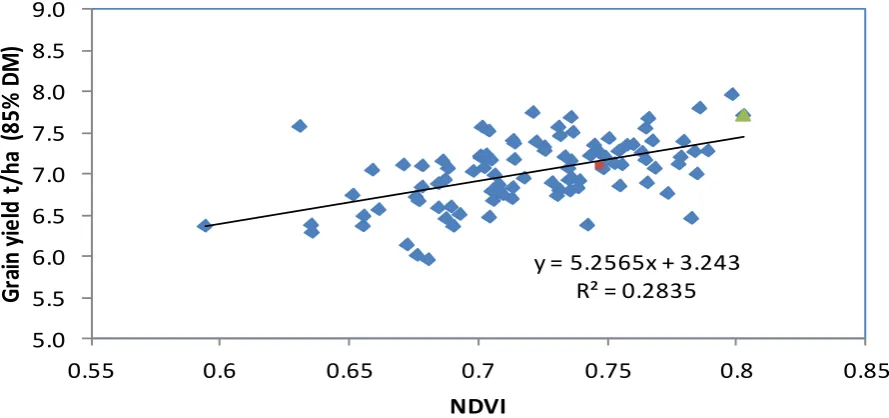
compared to the irrigated treatment (10.36 t/ha; P= 0.06). There was an interaction between Irrigation and DH line (P< 0.001; Figure 7). Stay-green traits measured in the unirrigated treatment were associated with grain yield performance amongst the 94 DH lines, e.g. the Normalised Difference Vegetation Index (NDVI), an indicator of canopy green area, measured during mid grain filling on 16 July (Figure 8).
Figure 7: Plots of Savannah x Rialto DH mapping population during grain filling at Sutton Bonington in 2013
Results indicated water-use efficiency (above-ground dry matter per unit water use) was negatively associated with grain yield under drought (implying a trade-off between water-use efficiency and season-long water use, and that water use was positively correlated with grain
yield amongst genotypes). In collaboration with Simon Griffiths and Luzie Wingen at John Innes Centre, QTL analysis is ongoing for these traits to identify markers for improved drought tolerance for application in wheat breeding.
y = 5.2565x + 3.243
R² = 0.2835
5.0
5.5
6.0
6.5
7.0
7.5
8.0
8.5
9.0
0.55
0.6
0.65
0.7
0.75
0.8
0.85
Gr
ain
yie
ld
t/
ha
(
85
%
DM
)
NDVI
Figure 8: Grain yield versus NDVI on 16 July in unirrigated plots at Sutton Bonington in 2012-13
7
Objective 10: Identification and Characteri-sation of Hexaploid Wheat Germplasm Which Reduces Take-All Disease (RRes)Take-all is the major root disease of wheat in the UK, associated with short rotations where consecutive wheat crops are grown. The disease is caused by the soil-borne fungus,
Gaeumannomyces graminis var. tritici (Ggt),
which attacks the cereal roots, causing black necrotic lesions which disrupt the uptake of water and nutrients from the soil (Figure 9). When severe disease occurs this leads to stunted and prematurely ripening plants with yield losses of up to 3 tonnes/ha. In the UK around 25% of the wheat area is sown to non-first wheat crops in the rotation. All these wheat crops are at risk from significant yield losses due to take-all. In addition to these yield losses, residual N is left in the soil increasing the risk of nitrate leaching into the environment (Macdonald & Gutteridge, 2012). Currently there is no form of genetic control for this disease available to farmers.
Figure 9: Ggt infected wheat root system
:
Take-All infected regions are black; fungal runner hyphae under microscopeResistance to Take-All in the Diploid Wheat Triticum monococcum
Triticum monococcum (AA genome) is an ancestral diploid relative of modern hexaploid
bread wheat. Over five years, 34 T. monococcum
accessions have been screened for root tissue-based resistance to take-all in naturally infected 3rd wheat field trials. Two accessions - MDR031 (origin Turkey) and MDR046 (origin Romania) - have been identified as displaying a consistent high level of resistance to the disease at both high and low disease pressures. Both T. monococcum
accessions possess a level of root resistance between that of the cereal species rye and triticale (high and intermediate resistance, respectively). Other T. monococcum accessions were severely infected (MDR037 and MDR043), with a similar susceptibility as modern hexaploid wheat cultivars (see WGIN newsletter October 2011 for more details). To investigate the genetic basis of resistance to Take-all, the most resistant T. monococcum accessions have been crossed to susceptible accessions to create mapping populations by single seed descent. The F6
mapping population between MDR037
(susceptible to Take-all disease) x MDR046 (resistant), developed as part of the WGIN programme, has been sown in a third wheat replicated field trial in November 2013 as part of a new BBSRC-HGCA-AGRII PhD project. The phenotype data generated, along with the creation of a high density molecular marker map, will be used to locate the genetic loci conferring the resistance trait. Two of the other mapping populations (MDR031 x MDR043 and MDR043 x MDR046) are currently at the F3 stage and will also be trialled under field conditions once they have reached the F6 stage.
The most resistant T. monococcum
8
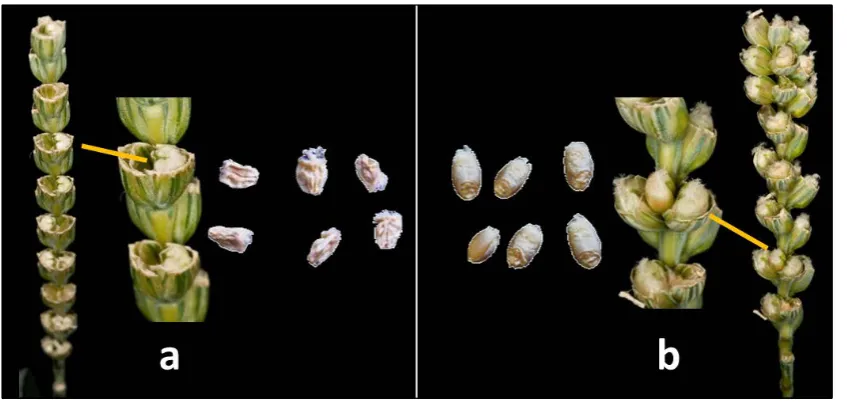
Figure 10: a) F1 ear, spikelet and mature grain from a Paragon ph1xT. monococcum cross, b) F1 ear, spikelet and mature grain from a Paragon ph1x ph1 cross (control)
Resistance to Take-all within the Watkins and Gediflux Hexaploid Wheat Collections
Since 2008 two hexaploid wheat collections, the Watkins and Gediflux collections (described in the WGIN Newsletter May 2008) have been screened for resistance to Take-all in third wheat field trials (Figure 11). In total 827 Watkins lines and 60 Gediflux lines have been tested. These lines were hand sown in single replicate small 0.5 m² plots with a number of replicated control cereal species. These included the highly resistant cereal species rye and the intermediately resistant species triticale. Also included were a number of modern hexaploid wheat cultivars which are considered fully susceptible, for example Hereward. Plant samples were dug up from the field in the summer and the root systems then washed and air-dried in a polytunnel, prior to storage at room temperature until take-all assessments could be carried out over the winter months. Each year, after the assessments were completed, the most susceptible Watkins and Gediflux lines would be discarded from the experiment and the most promising lines continued to be tested over multiple years. In 2011 the best 144 Watkins and 12 Gediflux lines, containing some potential
partial resistance to the
disease, were taken forward into replicated field
trials within the WISP project
(http://www.wheatisp.org/) where-in the most resistant 25 lines have now been identified. Theseresistant lines are from diverse geographical regions including Russia, India and Spain. At high take-all disease pressure these lines possess a level of resistance approaching that of the cereal species Triticale. The aim is now to create mapping populations to identify the genetic basis of resistance and closely linked molecular markers which could be used in plant breeding programmes to select for this important trait.__
Figure 11: Watkins and Gediflux collection screened for take-all resistance in a 3rd wheat field trial
Reference
9
Section 4 Sub-Contractor ProjectsThe Water Use Efficiency project funded at the University of Nottingham is now in its 2nd year of funding. Due to the lack of drought conditions in 2012, no grain sample analysis will be done. Instead the entire trial was re-drilled in Autumn 2013.
Section 5 Events
The 12th WGIN Stakeholders Meeting will take place on 21st November 2014 at Rothamsted Research. As in previous years, an afternoon panel discussion will take place. You are invited to send any suggestions for suitable topics to wgin.defra@rothamsted.ac.uk.
A Central European Breeding Workshop will be held in Martonvasar (Hungary) on 11th - 14th May 2014. If you are interested in attending, please contact Simon Griffiths (simon.griffiths@jic.ac.uk).
Section 6 News
At the March 2013 WGIN Management Meeting, Dr David Cooper at Defra announced that the WGIN 2 project would be extended until the end of the financial year (April 2014). Due to various reasons this project extension will now run until the end of May 2014.
Section 7 Publications 2013 / 14
Barraclough, P. B., Lopez-Bellido, R., Hawkesford, M. J. (2014). Genotypic variation in the uptake, partitioning and remobilisation of nitrogen during grain-filling in wheat. Field Crops Research 156, 242-248
Wan, Y., Sanchis Gritsch, C., Hawkesford, M. J., Shewry, P. R. (2014). Effects of nitrogen nutrition on the synthesis and deposition of the ω-gliadins of wheat. Annals of Botany, 113 (4), 607-615
Shaw, L.M., et al., (2013). Mutant Alleles of Photoperiod-1 in Wheat (Triticum aestivum L.) That Confer a Late Flowering Phenotype in Long Days. Plos One 8(11)
, e79459
Molnar, I., Simkova, H., Leverington-Waite, M., Goram, R., Cseh, A., Vrana, J., Farkas, A., Dolezel, J. Molnar-Lang, M. & Griffiths, S. (2013). Syntenic Relationships between the U and M Genomes of Aegilops, Wheat and the Model Species Brachypodium and Rice as Revealed by COS Markers. Plos One 8(8), e70844
Wilhelm, E.P., Howells, R.M., Al-Kaff, N., Jia, J., Baker, C., Leverington-Waite, M., Griffiths, S., Greenland, A.J., Boulton, M.I. & Powell, W. (2013). Genetic characterization and mapping of the Rht-1 homoeologs and flanking sequences in wheat. Theoretical and Applied Genetics 126(5), 1321-1336
Bai, C., Liang, Y., Hawkesford, M. J. (2013). Identification of QTLs associated with seedling root traits and their correlation with plant height in wheat. Journal of Experimental Botany 64, 1745-1753
Foulkes, J., Griffiths, S., Orford, S., Carvalho, P., DeSilva, J. (2013). Increasing the efficiency of water use of wheat by identification of isotope-based screens indicative of water use, transpiration efficiency and drought tolerance. Proceedings of AAB Conference Crop Resource Use Efficiency and Field Phenotyping. Belton Woods, Grantham, Lincs, UK, 25-26 March 2013
10
Section 8 Images from the 11th WGIN Stakeholders Event on 4th December 2013 at RothamstedPart of the WGIN Team: Vanessa McMillan, Cathy Mumford, Peter Shewry, Simon Griffiths, Michael Hammond-Kosack (back row), Gail Canning, Kim Hammond-Kosack, Malcolm Hawkesford (front row)
Amandeep Purewal (AHDB)
Malcolm Hawkesford (RRes)
11
For further information on the WGIN project please see www.wgin.org.uk or contact us at
wgin.defra@rothamsted.ac.uk
.
The contributors to this newsletter were: at Rothamsted Research: Kim Hammond-Kosack, Malcolm Hawkesford, Vanessa McMillan, Michael Hammond-Kosack and Graham Shepherd (stakeholder photographs); at the John Innes Centre: Simon Griffiths; at University of Nottingham: John Foulkes.