Patron: Her Majesty The Queen Rothamsted Research Harpenden, Herts, AL5 2JQ
Telephone: +44 (0)1582 763133 Web: http://www.rothamsted.ac.uk/
Rothamsted Research is a Company Limited by Guarantee Registered Office: as above. Registered in England No. 2393175. Registered Charity No. 802038. VAT No. 197 4201 51. Founded in 1843 by John Bennet Lawes.
Rothamsted Repository Download
A - Papers appearing in refereed journals
Evans, N., Butterworth, M. H., Baierl, A., Semenov, M. A., West, J. S.,
Barnes, A., Moran, D. and Fitt, B. D. L. 2011. Erratum: The impact of
climate change on disease constraints on production of oilseed rape.
Food Security. 3 (1), pp. 117-120.
The publisher's version can be accessed at:
•
https://dx.doi.org/10.1007/s12571-010-0058-3
The output can be accessed at:
https://repository.rothamsted.ac.uk/item/8q820/erratum-the-impact-of-climate-change-on-disease-constraints-on-production-of-oilseed-rape.
© 11 January 2011, Springer.
ERRATUM
Erratum: The impact of climate change on disease
constraints on production of oilseed rape
Neal Evans
&Michael H. Butterworth
&Andreas Baierl
&Mikhail A. Semenov
&Jon S. West
&Andrew Barnes
&Dominic Moran
&Bruce D. L. Fitt
Published online: 11 January 2011
#Springer Science+Business Media B.V. & International Society for Plant Pathology 2011
Erratum to: Food Security (2010) 2:143
–
156
DOI 10.1007/s12571-010-0058-3
The authors would like to correct a series of errors printed in
the above paper. Due to a mistake in a table of official figures
with respect to land use in the UK, the figure used for the
acreage of oilseed rape produced for Scotland should have
been
‘
35 780 ha
’
and not
‘
398 720 ha
’
(Table
4
). Thus data
quoted in the
“
Results
”
section of this paper that include this
erroneous data (i.e. any
“
Scottish data
”
or
“
total UK
”
data)
are also erroneous by an order of magnitude. Data in the last
three lines of the following tables should now read as follows.
Overall, this does not affect the main conclusions of the
paper. However, the
“
Abstract
”
should now state that the
value of the crop (if stem canker and light leaf spot were
effectively controlled) was predicted to increase by £2.5 M in
Scotland (rather than £28 M) by 2050 under a high emissions
scenario and that under the same scenario, UK disease losses
were predicted to increase by £30 M (rather than £50 M).
The online version of the original article can be found at http://dx.doi. org/10.1007/s12571-010-0058-3.
N. Evans (*)
:
M. H. Butterworth:
M. A. Semenov:
J. S. West:
B. D. L. FittRothamsted Research, Harpenden AL5 2JQ, UK e-mail: neal.evans@bbsrc.ac.uk A. Baierl
Department of Statistics and Decision Support Systems, University of Vienna,
Universitaetsstrasse 5/9, 1010 Vienna, Austria A. Barnes
:
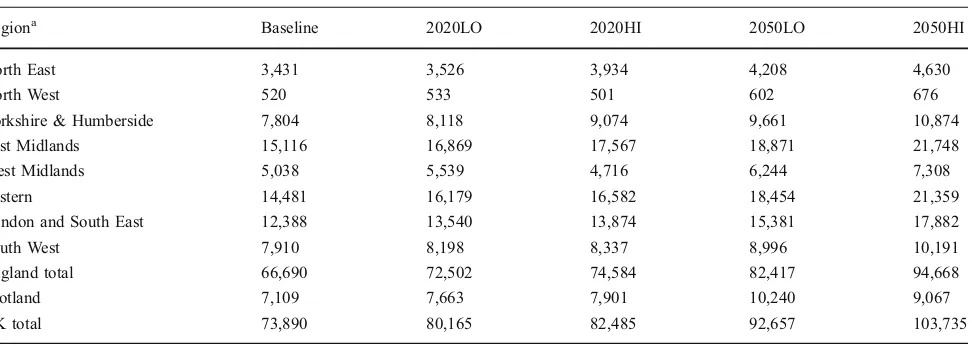
D. Moran Scottish Agricultural College, West Mains Road,Table 3 Effects of climate change on the losses from phoma stem canker and light leaf spot (for cultivars with average resistance) in winter oilseed rape crops not treated with fungicide. The values are given for the baseline (1960–1990), 2020LO (low CO2emissions), 2020HI (high
emissions), 2050LO and 2050HI climate scenarios and presented in thousands of pounds (£000 s). The figures were calculated after interpolating the results from the stem canker and the light leaf spot yield loss predictions according to UK government region and then multiplied by an average price of £195.60 t−1
Value of losses caused by phoma stem canker and light leaf spot (£000s)b
Regiona Baseline 2020LO 2020HI 2050LO 2050HI
North East 3,431 3,526 3,934 4,208 4,630 North West 520 533 501 602 676 Yorkshire & Humberside 7,804 8,118 9,074 9,661 10,874 East Midlands 15,116 16,869 17,567 18,871 21,748 West Midlands 5,038 5,539 4,716 6,244 7,308 Eastern 14,481 16,179 16,582 18,454 21,359 London and South East 12,388 13,540 13,874 15,381 17,882 South West 7,910 8,198 8,337 8,996 10,191 England total 66,690 72,502 74,584 82,417 94,668 Scotland 7,109 7,663 7,901 10,240 9,067 UK total 73,890 80,165 82,485 92,657 103,735
aGovernment regions can be found athttp://www.statistics.gov.uk/geography/downloads/uk_gor_cty.pdf
bThe stem canker and light leaf spot loss predictions depend on the crop yield predictions in Table2
Table 2 Effects of climate change on the output of winter oilseed rape (treated with fungicide), calculated by region. The area grown per region (2006) and the predicted regional output are given for the baseline (1960–1990), 2020LO (low CO2emissions), 2020HI (high emissions), 2050LO
and 2050HI climate scenarios and presented in thousands of pounds (£000 s). The yield figures were calculated after interpolating the results from the oilseed rape yield predictions according to UK government region and then multiplied by an average price of £195.60 t−1
Regiona Value of [fungicide treated] oilseed rape crop (£000s)
Baseline 2020LO 2020HI 2050LO 2050HI North East 14,098 13,168 14,536 14,646 14,812 North West 2,097 2,024 1,861 2,115 2,169 Yorkshire & Humberside 37,220 35,342 38,251 38,126 38,358 East Midlands 69,007 69,480 69,277 69,744 70,874 West Midlands 20,194 20,121 16,839 20,900 21,726 Eastern 63,885 63,854 63,661 65,792 66,907 London and South East 46,508 46,867 46,939 48,216 49,700 South West 26,742 26,831 26,873 27,570 28,538 England total 279,749 277,688 278,237 287,110 293,085 Scotland 22,038 23,086 23,600 24,182 24,567 UK total 301,787 300,774 301,837 311,292 317,652
aGovernment regions can be found athttp://www.statistics.gov.uk/geography/downloads/uk_gor_cty.pdf
Table 4 Effects of climate change on the yield of untreated oilseed rape after phoma stem canker and light leaf spot losses, calculated by region. The area grown per region (2006) and the predicted total regional yield are given for the baseline (1960–1990) scenario. The total regional yield as a percentage of the baseline scenario is given for the 2020LO (low CO2emissions), 2020HI (high emissions), 2050LO and 2050HI climate
scenarios. The figures were calculated after interpolating the results from the treated oilseed rape yield predictions, the stem canker yield loss predictions and the light leaf spot loss predictions according to UK government region
Regiona Area of oilseed rape grown (ha)b Baseline total yield (t) Yield (% of baseline yield)
2020LO 2020HI 2050LO 2050HI North East 22,787 72,649 90.4 99.4 97.9 95.5 North West 3,601 10,769 94.5 86.2 96.0 94.7 Yorkshire & Humberside 61,068 189,125 92.6 99.2 96.8 93.4 East Midlands 113,479 342,630 97.6 96.0 94.4 91.2 West Midlands 34,419 97,510 96.2 80.0 96.7 95.1 Eastern 103,488 309,496 96.5 95.3 95.8 92.2 London and South East 79,063 219,128 97.7 96.9 96.2 93.3 South West 44,858 127,461 98.9 98.4 98.6 97.4 England total 462,764 1,368,770 96.3 95.6 96.1 93.1 Scotland 35,780 76,324 103.3 105.2 93.4 103.8 UK total 498,544 1,445,094 99.4 99.8 94.9 97.8
aGovernment regions can be found athttp://www.statistics.gov.uk/geography/downloads/uk_gor_cty.pdf
bArea of winter oilseed rape grown in each region in harvest year 2006 (www.defra.gov.uk)
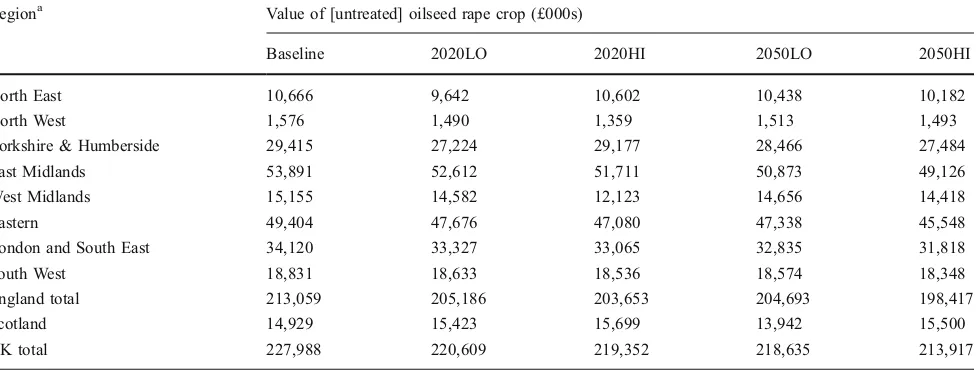
Table 5 Effects of climate change on the output of untreated winter oilseed rape (for cultivars with average resistance) after phoma stem canker and light leaf spot losses, calculated by region. The area grown per region (2006) and the predicted regional output are given for the baseline (1960–1990), 2020LO (low emissions), 2020HI (high emissions), 2050LO and 2050HI climate scenarios and presented in thousands of pounds (£000 s). The figures were calculated after interpolating the results from the treated oilseed rape yield predictions, the stem canker yield loss predictions and the light leaf spot loss predictions according to UK government region and then multiplied by an average price of £195.60 t−1 Regiona Value of [untreated] oilseed rape crop (£000s)
Baseline 2020LO 2020HI 2050LO 2050HI North East 10,666 9,642 10,602 10,438 10,182 North West 1,576 1,490 1,359 1,513 1,493 Yorkshire & Humberside 29,415 27,224 29,177 28,466 27,484 East Midlands 53,891 52,612 51,711 50,873 49,126 West Midlands 15,155 14,582 12,123 14,656 14,418 Eastern 49,404 47,676 47,080 47,338 45,548 London and South East 34,120 33,327 33,065 32,835 31,818 South West 18,831 18,633 18,536 18,574 18,348 England total 213,059 205,186 203,653 204,693 198,417 Scotland 14,929 15,423 15,699 13,942 15,500 UK total 227,988 220,609 219,352 218,635 213,917
aGovernment regions can be found athttp://www.statistics.gov.uk/geography/downloads/uk_gor_cty.pdf
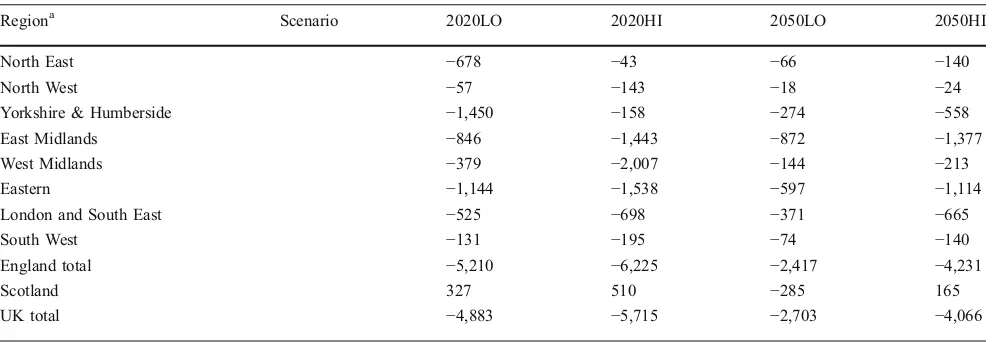
Table 6 Present value of the effects of climate change (£000s) Present value of the effects of climate change (£000 s)
Regiona Scenario 2020LO 2020HI 2050LO 2050HI
North East −678 −43 −66 −140 North West −57 −143 −18 −24 Yorkshire & Humberside −1,450 −158 −274 −558 East Midlands −846 −1,443 −872 −1,377 West Midlands −379 −2,007 −144 −213 Eastern −1,144 −1,538 −597 −1,114 London and South East −525 −698 −371 −665 South West −131 −195 −74 −140 England total −5,210 −6,225 −2,417 −4,231
Scotland 327 510 −285 165
UK total −4,883 −5,715 −2,703 −4,066
aGovernment regions can be found athttp://www.statistics.gov.uk/geography/downloads/uk_gor_cty.pdf