RESEARCH
Dose-dependent artificial prolongation
of prothrombin time by interaction
between daptomycin and test reagents
in patients receiving warfarin: a prospective
in vivo clinical study
Makoto Saito
1, Shuji Hatakeyama
1,2*, Hideki Hashimoto
1, Takumitsu Suzuki
1, Daisuke Jubishi
1,
Makoto Kaneko
3, Yukio Kume
3, Takehito Yamamoto
4, Hiroshi Suzuki
4and Hiroshi Yotsuyanagi
1Abstract
Background: Daptomycin has been reported to cause artificial prolongation of prothrombin time (PT) by interacting with some test reagents of PT. This prolongation was particularly prominent with high concentrations of daptomy-cin in vitro. However, whether this prolongation is important in clinical settings and the optimal timing to assess PT remain unclear.
Methods: A prospective clinical study was conducted with patients who received daptomycin for confirmed or suspected drug-resistant, gram-positive bacterial infection at a university hospital in Japan. PT at the peak and trough of daptomycin was tested using nine PT reagents. Linear regression analyses were used to examine the difference in daptomycin concentration and the relative change of PT-international normalized ratios (PT-INR).
Results: Thirty-five patients received daptomycin (6 mg/kg). The mean ± standard deviation of the trough and peak concentrations of daptomycin were 13.5 ± 6.3 and 55.1 ± 16.9 μg/mL, respectively. Twelve patients (34%) received warfarin. With five PT reagents, a significant proportion of participants experienced prolongation of PT-INR at the daptomycin peak concentration compared to the PT-INR at the trough, although the mean relative change was less than 10%. None of the participants clinically showed any signs of bleeding. A linear, dose-dependent prolonga-tion of PT was observed for one reagent [unadjusted coefficient β 3.1 × 10⁻³/μg/mL; 95% confidence interval (CI) 2.3 × 10⁻⁵–6.3
× 10−3; p
= 0.048]. When patients were stratified based on warfarin use, this significant linear relation-ship was observed in warfarin users for two PT reagents (adjusted coefficient β, 6.4 × 10⁻³/μg/mL; 95% CI 3.5
× 10−3– 9.3 × 10⁻³; p < 0.001; and adjusted coefficient β, 8.3
× 10−3/μg/mL; 95% CI 4.4
× 10−3–1.2
× 10−2; p < 0.001). In non-warfarin users, this linear relationship was not observed for any PT reagents.
Conclusions: We found that a higher concentration of daptomycin could lead to artificial prolongation of PT-INR by interacting with some PT reagents. This change may not be clinically negligible, especially in warfarin users receiv-ing a high dose of daptomycin. It may be better to measure PT at the trough rather than at the peak daptomycin concentration.
Keywords: Daptomycin, Prothrombin time, Warfarin, Drug resistance, Gram-positive infections, High dose
© The Author(s) 2017. This article is distributed under the terms of the Creative Commons Attribution 4.0 International License (http://creativecommons.org/licenses/by/4.0/), which permits unrestricted use, distribution, and reproduction in any medium, provided you give appropriate credit to the original author(s) and the source, provide a link to the Creative Commons license, and indicate if changes were made. The Creative Commons Public Domain Dedication waiver (http://creativecommons.org/ publicdomain/zero/1.0/) applies to the data made available in this article, unless otherwise stated.
Open Access
*Correspondence: [email protected]
2 Division of General Internal Medicine, Division of Infectious Diseases,
Jichi Medical University Hospital, 3311-1 Yakushiji, Shimotsuke-shi, Tochigi 329-0498, Japan
Background
Daptomycin is a cyclic lipopeptide antimicrobial agent, which exerts its bactericidal effects against gram-positive bacteria by decreasing the integrity of bacterial phos-pholipid cell membranes in the presence of Ca2+ [1]. It is licensed for use against skin and soft tissue infections and bloodstream infection by gram-positive pathogens. Since its use was first approved in the USA in 2003, sev-eral reports have shown that prothrombin time (PT) was prolonged in daptomycin users, especially those who were on warfarin [2, 3]. This prolongation was consid-ered artificial because those patients did not show evi-dence of bleeding [3]. In addition, daptomycin does not interfere with cytochrome P450 and thus it is unlikely to interact with warfarin in vivo [4]. It is possible that some PT reagents may interfere with daptomycin, resulting in an artificial increase in PT. Indeed, this prolongation was confirmed for some PT reagents in vitro by adding dapto-mycin to the blood samples, and this effect was particu-larly prominent in samples with elevated baseline PT due to warfarin use [3, 5, 6]. This finding is critical as a finer control of PT is needed for those treated with warfarin to prevent bleeding and intravascular clotting. In addition, patients who require warfarin and patients who need daptomycin frequently overlap. For example, anticoagu-lants are used in patients with intravascular devices, who are also at risk for bloodstream infection by gram-posi-tive bacteria. The prolongation effect by daptomycin has been reported to depend on the daptomycin concentra-tion [3, 5, 6], and some have suggested that PT should be measured at the trough rather than at the peak of the daptomycin concentration [3]. However, this suggestion has not been assessed in clinical settings. In addition, the effect of some PT reagents used in Japan on daptomycin has not been evaluated.
In this study, we compared for the first time PT at the trough and the peak concentrations of daptomycin using clinical samples prospectively collected from patients treated with daptomycin. The objective of this study was to assess whether there were any PT reagents affected by daptomycin and whether there was any difference in this effect depending on concomitant use of warfarin.
Methods
This prospective study was conducted at the University of Tokyo Hospital, Japan between February 2013 and October 2014. Participants were patients treated with daptomycin for confirmed or suspected drug-resist-ant, gram-positive bacterial infections (i.e. infections caused by methicillin-resistant Staphylococcus aureus and vancomycin-resistant enterococci) after they gave full written consents. Children younger than 12 years
and anaemic patients with a haemoglobin concentra-tion <9.0 mg/dL were excluded.
We examined the impact of daptomycin on PT meas-urement by comparing PT-international normalised ratio (PT-INR) at the trough and peak blood concentrations of daptomycin. Daptomycin was administered intrave-nously at a 6 mg/kg/dose over 30 min every 24 h (clear-ance of creatinine ≥30 mL/min) or 48 h (<30 mL/min) [4]. Blood samples (one 4.5 mL 3.2% sodium citrate tube for PT and one 2.0 mL ethylenediamine tetraacetic acid anticoagulant tube for daptomycin concentration) were taken at ≤30 min before (trough) and 30–60 min after (peak) the ≥3rd daptomycin administration. Blood sam-ples were also taken for PT measurement at enrolment before the initiation of daptomycin. Within 1 h after col-lection, plasma was isolated by centrifugation (3000 rpm, room temperature, 10 min; 1500g, 4 °C, 15 min) and stored at −80 or −70 °C until assay of PT and daptomy-cin, respectively. We measured PTs using nine commer-cial reagents that are commonly used in Japan (Table 1). Samples were examined up to three times for each sam-ple using each reagent, and median values were used for the statistical analyses. Plasma concentrations of dapto-mycin were measured using ultra-performance liquid chromatography with tandem mass spectrometric detec-tion (UPLC-MS/MS) according to a previous report with some modifications [7]. Briefly, 50 µL of plasma speci-mens spiked with an internal standard (4-hydroxychal-cone, 10 mg/L) was deproteinated by addition of 200 µL of methanol and centrifuged for 15 min at 15,000 rpm, 4 °C. Then, the clear supernatant was diluted 10 times with 80% methanol, and 5 µL aliquots were analysed with a UPLC-MS/MS system consisting of an ACQUITY UPLC® instrument coupled with a Quattro Premier XE triple-quadrupole MS/MS system (Waters Corp., Milford, MA, USA) operated under electrospray ioni-zation (ESI) mode. Chromatographic separation was per-formed on ACUITY UPLC® BEH C18 column (1.7 µm, 2.1 × 100 mm, Waters Corp.) in isocratic separation mode. The mobile phase was 50/50 (v/v) milliQ water/ acetonitrile containing 0.1% formic acid, and the flow rate was set at 0.3 mL/min. Analytes were monitored in multiple reaction monitoring (MRM) mode, and the m/z of precursor and product ions was 811.33 > 313.26 and 223.15 > 117.00 (ESI-) for daptomycin and 4-hydroxy-chalcone, respectively. The calibration ranges were 0.25– 100 mg/L. Samples were anonymised with unique patient identifiers, and laboratories were blinded to the patients’ information.
categorical variables, respectively. For continuous vari-ables, t test and linear regression model were used. The Huber-White sandwich estimator was used to measure the standard errors for linear regression analyses. Outli-ers that lay outside the 95% confidence interval (95% CI) based on the standard error of forecast were excluded from the linear regression model. Effect modification by warfarin use was our a priori interest. More than 10% relative change of PT-INR was regarded as clinically sig-nificant [8].
This study was approved by the Ethics Committee of the University of Tokyo Hospital (10026).
Results
Patient characteristics
Of the 36 participants recruited for this study, one with-drew because of the cessation of daptomycin before the third administration. Among the remaining 35 patients, 25 (71%) were men, and the median age was 61 years (Table 2). Twelve patients received warfarin. The median baseline PT-INR at trough was 2.62 [interquartile range (IQR) 1.63–3.29] in warfarin users and 1.19 (IQR 1.06– 1.42) in non-warfarin users using our routine reagent (Reagent 1). The median time interval between trough and peak blood sample collections was 105 min (IQR
Table 1 Characteristics of prothrombin time test reagents used in the study
ISI international sensitivity index, PG phosphatidylglycerol
No Brand name Manufacturer Laboratory ISI Thromboplastin Phospholipid
1 HemosIL Recombi
PlasTin 2G Instrumental Laboratories University of Tokyo Hospital 1.01 Recombinant human tissue factor Synthetic phospho-lipid 2 Neoplastin plus Roche Diagnostics Roche Diagnostics 1.33 Rabbit brain Confidential 3 STA Neoplastin R Roche Diagnostics Roche Diagnostics 0.96 Recombinant human tissue factor Confidential 4 Dade Innovin Dade Behring (Sysmex) Sysmex 1.0 Recombinant human tissue factor No data 5 Thromborel S Dade Behring (Sysmex) Sysmex 1.0 Human placenta No data 6 Thrombocheck PT Sysmex Sysmex 1.6 Rabbit brain No data 7 Simplastin Excel S BioMerieux Kyowa Medex 1.22 Rabbit brain No PG 8 Simplastin HTF BioMerieux Kyowa Medex 1.26 Cultured human lung cell No PG 9 Coagupia PT–N Sekisui Medical Sekisui Medical 1.09 Rabbit brain Confidential
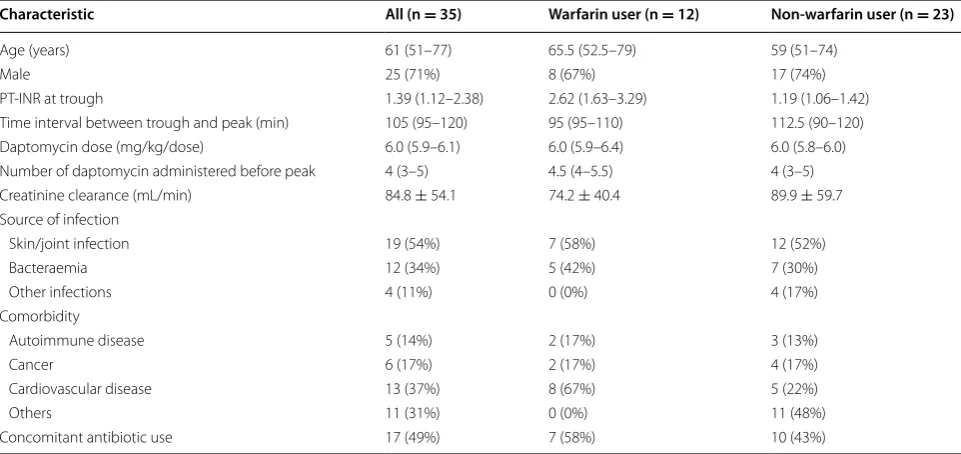
Table 2 Patient characteristics stratified by warfarin use
Data are shown as a number (%), mean ± standard deviation or median (interquartile range) PT-INR prothrombin time-international normalised ratio. PT-INR by Reagent 1 is shown
Characteristic All (n = 35) Warfarin user (n = 12) Non-warfarin user (n = 23)
Age (years) 61 (51–77) 65.5 (52.5–79) 59 (51–74)
Male 25 (71%) 8 (67%) 17 (74%)
PT-INR at trough 1.39 (1.12–2.38) 2.62 (1.63–3.29) 1.19 (1.06–1.42) Time interval between trough and peak (min) 105 (95–120) 95 (95–110) 112.5 (90–120) Daptomycin dose (mg/kg/dose) 6.0 (5.9–6.1) 6.0 (5.9–6.4) 6.0 (5.8–6.0) Number of daptomycin administered before peak 4 (3–5) 4.5 (4–5.5) 4 (3–5) Creatinine clearance (mL/min) 84.8 ± 54.1 74.2 ± 40.4 89.9 ± 59.7 Source of infection
Skin/joint infection 19 (54%) 7 (58%) 12 (52%)
Bacteraemia 12 (34%) 5 (42%) 7 (30%)
Other infections 4 (11%) 0 (0%) 4 (17%) Comorbidity
Autoimmune disease 5 (14%) 2 (17%) 3 (13%)
Cancer 6 (17%) 2 (17%) 4 (17%)
Cardiovascular disease 13 (37%) 8 (67%) 5 (22%)
Others 11 (31%) 0 (0%) 11 (48%)
95–120 min). Daptomycin treatment (results deter-mined according to administered dose per body weight and number of administrations before the PT measure-ment) was comparable between the two groups. Most of the patients were receiving treatment for skin/joint infec-tion (19/35; 54%) or bloodstream infecinfec-tion (12/35; 34%). There were more patients with cardiovascular disease in the warfarin group (8/12; 67%) than in the non-warfarin group (5/23; 22%). A total of 49% (17/35) patients were given concomitant antibiotics in addition to daptomycin. None of the patients showed any signs of bleeding during this study.
Comparison of PT-INRs between the trough and the peak concentrations of daptomycin
The average ± standard deviation of the trough and peak concentrations of daptomycin were 13.5 ± 6.3 and 55.1 ± 16.9 μg/mL, respectively. Both trough and peak concentrations were slightly higher in the warfarin group (16.6 ± 6.1, 57.6 ± 16.3) than in the non-warfarin group (11.9 ± 5.9, 53.8 ± 17.5), which could be due to the slightly impaired renal function in the warfarin group. The differences between the trough and peak concentra-tions were roughly equal (41.0 ± 14.0 in warfarin group and 41.9 ± 14.9 in non-warfarin group). The maximum peak concentration observed in this study cohort was 96.4 μg/mL.
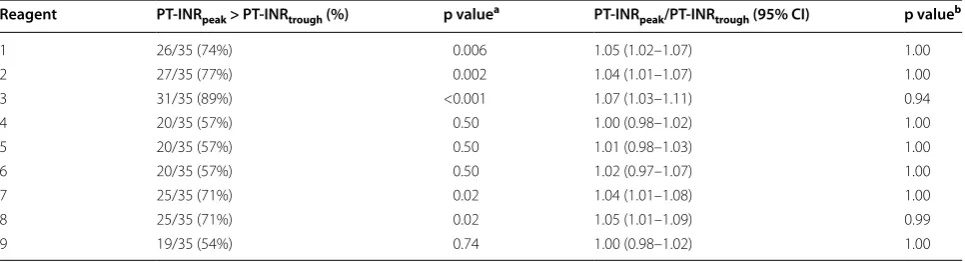
PT-INRs at the trough and the peak daptomycin con-centration were compared. Regarding Reagent 1, 2, 3, 7, and 8, more than 70% of patients had higher PT-INR at the peak than at the trough level (Table 3). This trend was not different between warfarin users and non-users for the same PT reagent (data not shown). Based on the PT-INR values, however, no reagents showed a clini-cally important relative change of >10%. The highest relative change of PT-INR was observed in the warfarin
group with Reagent 3 at 1.13 (95% CI 1.03–1.22). The absolute difference of PT-INRs was biggest in warfarin users at 0.26 (95% CI 0.02–0.50) with Reagent 3 and in non-warfarin users at 0.06 (95% CI 0.01–0.12) with Reagent 1.
Linear relationship between the relative change of PT-INR and the difference in daptomycin concentrations
between the trough and peak
The difference in daptomycin concentrations (Δ-daptomycin) between trough and peak was assessed as an explanatory variable for the relative change of PT-INR (Fig. 1). For Rea-gent 3, a significant linear association was observed between Δ-daptomycin and relative change of PT-INR: unadjusted coefficient β, 3.1 × 10⁻³/μg/mL; 95% CI 2.3 × 10⁻⁵–
6.3 × 10⁻³; p = 0.048; r2 = 0.19 (Table 4). This relationship
was unchanged after adjusting for warfarin use: adjusted coef-ficient β, 3.3 × 10⁻³/μg/mL; 95% CI 5.2 × 10⁻⁴–6.0 × 10⁻³;
p = 0.02; r2 = 0.34.
For Reagent 2 and 3, effect modification by warfarin use was indicated (p value for effect modification, 0.0003 and 0.001, respectively). When taking this effect modi-fication into account, only warfarin users showed a lin-ear association for both Reagent 2 (adjusted coefficient β, 6.4 × 10⁻³/μg/mL; 95% CI 3.5 × 10⁻³–9.3 × 10⁻³;
p < 0.001; r2 = 0.57) and Reagent 3 (adjusted coefficient
β, 8.3 × 10⁻³/μg/mL; 95% CI 4.4 × 10⁻³–1.2 × 10⁻²;
p < 0.001; r2 = 0.56). No linear association between
Δ-daptomycin and relative change of PT-INR was observed for other reagents (Table 5).
Discussion
PT-INR at the peak concentration increased compared to that at the trough concentration of daptomycin in 56% (5/9) of the reagents, although the difference was not clinically meaningful (<10%). The magnitude of PT
Table 3 Proportion of patients with prolonged PT-INR at peak daptomycin concentration and the relative change of PT-INR between trough and peak
PT-INR prothrombin time-international normalised ratio, CI confidence interval
a p values by binomial test compared to 0.50
b One-sided p value by t test to test whether the ratio is more than 1.10
Reagent PT-INRpeak > PT-INRtrough (%) p valuea PT-INRpeak/PT-INRtrough (95% CI) p valueb
1 26/35 (74%) 0.006 1.05 (1.02–1.07) 1.00
2 27/35 (77%) 0.002 1.04 (1.01–1.07) 1.00
3 31/35 (89%) <0.001 1.07 (1.03–1.11) 0.94
4 20/35 (57%) 0.50 1.00 (0.98–1.02) 1.00
5 20/35 (57%) 0.50 1.01 (0.98–1.03) 1.00
6 20/35 (57%) 0.50 1.02 (0.97–1.07) 1.00
7 25/35 (71%) 0.02 1.04 (1.01–1.08) 1.00
8 25/35 (71%) 0.02 1.05 (1.01–1.09) 0.99
prolongation, however, could depend on the concentra-tion of daptomycin. Based on the linear regression results in warfarin users, the PT-INR at a daptomycin peak concentration of 70 μg/mL is predicted to be 1.15 times (Reagent 2) and 1.20 times (Reagent 3) higher than the PT-INR at a trough concentration of 20 μg/mL. These estimates are in the similar range of effects previously reported by in vitro studies (ranging from 1.15 to more than three times higher at 100 μg/mL than at 0 μg/mL) [3, 5, 6, 9]. These magnitudes of elevation are clinically relevant, especially considering that higher daptomycin dosing (>6 mg/kg) was recently suggested and used for certain clinical situations [10, 11].
Susceptibility of PT reagents to the interaction with daptomycin has been reported to depend on two fac-tors: the type of thromboplastin reagents used and the condition of phospholipids [3, 5]. One common feature among the affected reagents was that they were derived from recombinant human or rabbit tissue factors [3, 5, 6]. Phosphatidylglycerol (PG) concentration is considered to be the other key factor for this interaction [5]. When PG was added, reagents containing recombinant rabbit or
0.8
1.0
1.2
1.4
20 30 40 50 60 70 20 30 40 50 60 70 20 30 40 50 60 70
20 30 40 50 60 70 20 30 40 50 60 70 20 30 40 50 60 70
20 30 40 50 60 70 20 30 40 50 60 70 20 30 40 50 60 70
Non-user Warfarin user
Relative
change
of PT
-INR (PT
-IN
Rpeak
trough
/PT
-IN
R)
Difference in daptomycin concentrations ([Dap]peak-[Dap]trough) ( g/mL)
0.
8
1.
01
.2
1.
4
0.
8
1.
0
1.
2
1.
4
3 2
1
6 5
4
9 8
7
Fig. 1 The relative change of PT-INR and the difference in daptomycin concentrations [Dap] between trough and peak. Linear regression lines with a 95% confidence interval for the predicted mean are shown separately for warfarin users and non-users. The reagent numbers are shown in the top
left. PT-INR prothrombin time international normalised ratio
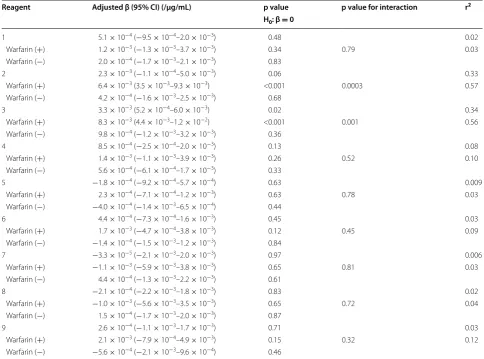
Table 4 Linear relationship between the relative change of PT-INR and the difference in daptomycin concentrations between the trough and peak
Reagent n Unadjusted β (95% CI) (/μg/mL) p value r2 H0: β = 0
1 34 5.1 × 10⁻⁴
(−9.2 × 10⁻⁴–1.9 × 10⁻³) 0.48 0.02
2 34 2.2 × 10⁻³
(−5.6 × 10⁻⁴–4.9 × 10⁻³) 0.12 0.15
3 34 3.1 × 10⁻³
(2.3 × 10⁻⁵–6.3 × 10⁻³) 0.048 0.19
4 34 8.5 × 10⁻⁴
(−2.2 × 10⁻⁴–1.9 × 10⁻³) 0.12 0.08
5 32 −1.8 × 10⁻⁴
(−9.2 × 10⁻⁴–5.6 × 10⁻⁴) 0.62 0.006
6 33 4.3 × 10⁻⁴
(−7.3 × 10⁻⁴–1.6 × 10⁻³) 0.45 0.02
7 33 −5.0 × 10⁻⁵
(−2.0 × 10⁻³–1.9 × 10⁻³) 0.96 <0.001
8 34 −2.3 × 10⁻⁴
(−2.1 × 10⁻³–1.6 × 10⁻³) 0.80 0.003
9 34 2.3 × 10⁻⁴
recombinant human tissue factor showed concentration-dependent prolongation of PT by daptomycin, whereas a reagent containing human placenta was less affected [5]. One of the two affected reagents in our study contained recombinant human tissue factor, whereas the other con-tained rabbit brain. All samples were centrifuged within 1 h after collection and then kept at −80 °C; therefore, the time between collection and measurement, and transportation were not likely to considerably affect our results [12].
Our comparison between trough and peak concentra-tions was based on the assumption that PT was otherwise unchanged between trough time and peak time, which were 1–3 h apart on the same day. Although factors other than increased daptomycin concentration might have caused true prolongation of PT between the trough and peak concentrations, such factors were not likely, and even if they played a role in the effect, they would
not explain why this prolongation was only observed for the two PT reagents. First, this trend was not attribut-able to increased warfarin concentration, as only one patient took warfarin between the two sample collec-tions, and all others took warfarin after blood collection at peak of daptomycin. Second, the circadian rhythm of PT, which is approximately 5–10% [13–15], did not likely to affect our results. If this circadian rhythm was affect-ing our results, all reagents should have shown the same pattern. Furthermore, although the PT seems to vary in a day, it is still controversial whether there is a certain circadian pattern of PT that is the same across patients on warfarin [13–15]. Third, the impact of the concomi-tant use of other antibiotics on the change of PT between the two time points could be limited. There are mainly three mechanisms by which antibiotics can affect PT: interaction between warfarin and antibiotics; reduced vitamin K production resulting from interference by the
Table 5 Adjusted linear relationship between the relative change of PT-INR and the difference in daptomycin concentra-tions between the trough and peak
For each PT reagent, the first row is based on the linear regression model adjusted for warfarin use, and the second and the third rows are strata-specific values based on the linear regression model with interaction by warfarin use
Reagent Adjusted β (95% CI) (/μg/mL) p value p value for interaction r2 H0: β = 0
1 5.1 × 10⁻⁴ (−9.5 × 10⁻⁴–2.0 × 10⁻³) 0.48 0.02
Warfarin (+) 1.2 × 10⁻³ (−1.3 × 10⁻³–3.7 × 10⁻³) 0.34 0.79 0.03
Warfarin (−) 2.0 × 10⁻⁴ (−1.7 × 10⁻³–2.1 × 10⁻³) 0.83
2 2.3 × 10⁻³ (−1.1 × 10⁻⁴–5.0 × 10⁻³) 0.06 0.33
Warfarin (+) 6.4 × 10⁻³ (3.5 × 10⁻³–9.3 × 10⁻³) <0.001 0.0003 0.57
Warfarin (−) 4.2 × 10⁻⁴ (−1.6 × 10⁻³–2.5 × 10⁻³) 0.68
3 3.3 × 10⁻³ (5.2 × 10⁻⁴–6.0 × 10⁻³) 0.02 0.34
Warfarin (+) 8.3 × 10⁻³ (4.4 × 10⁻³–1.2 × 10⁻²) <0.001 0.001 0.56
Warfarin (−) 9.8 × 10⁻⁴ (−1.2 × 10⁻³–3.2 × 10⁻³) 0.36
4 8.5 × 10⁻⁴ (−2.5 × 10⁻⁴–2.0 × 10⁻³) 0.13 0.08
Warfarin (+) 1.4 × 10⁻³ (−1.1 × 10⁻³–3.9 × 10⁻³) 0.26 0.52 0.10
Warfarin (−) 5.6 × 10⁻⁴ (−6.1 × 10⁻⁴–1.7 × 10⁻³) 0.33
5 −1.8 × 10⁻⁴ (−9.2 × 10⁻⁴–5.7 × 10⁻⁴) 0.63 0.009
Warfarin (+) 2.3 × 10⁻⁴ (−7.1 × 10⁻⁴–1.2 × 10⁻³) 0.63 0.78 0.03
Warfarin (−) −4.0 × 10⁻⁴ (−1.4 × 10⁻³–6.5 × 10⁻⁴) 0.44
6 4.4 × 10⁻⁴ (−7.3 × 10⁻⁴–1.6 × 10⁻³) 0.45 0.03
Warfarin (+) 1.7 × 10⁻³ (−4.7 × 10⁻⁴–3.8 × 10⁻³) 0.12 0.45 0.09
Warfarin (−) −1.4 × 10⁻⁴ (−1.5 × 10⁻³–1.2 × 10⁻³) 0.84
7 −3.3 × 10⁻⁵ (−2.1 × 10⁻³–2.0 × 10⁻³) 0.97 0.006
Warfarin (+) −1.1 × 10⁻³ (−5.9 × 10⁻³–3.8 × 10⁻³) 0.65 0.81 0.03
Warfarin (−) 4.4 × 10⁻⁴ (−1.3 × 10⁻³–2.2 × 10⁻³) 0.61
8 −2.1 × 10⁻⁴ (−2.2 × 10⁻³–1.8 × 10⁻³) 0.83 0.02
Warfarin (+) −1.0 × 10⁻³ (−5.6 × 10⁻³–3.5 × 10⁻³) 0.65 0.72 0.04
Warfarin (−) 1.5 × 10⁻⁴ (−1.7 × 10⁻³–2.0 × 10⁻³) 0.87
9 2.6 × 10⁻⁴ (−1.1 × 10⁻³–1.7 × 10⁻³) 0.71 0.03
Warfarin (+) 2.1 × 10⁻³ (−7.9 × 10⁻⁴–4.9 × 10⁻³) 0.15 0.32 0.12
N-methylthiotetrazole side chain of certain antibiotics; and the effect of antibiotics on normal gut flora produc-ing vitamin K. Only one patient took both warfarin and a concomitant antibiotic that was known to interact with warfarin. This patient took sulphamethoxazole-trimeth-oprim (ST) and he was the only person in the warfarin group who showed more than a 5% relative increase in PT-INR with all PT reagents. Nonetheless, Reagent 2 and 3 showed a greater relative increase in PT-INR (1.23 and 1.45, respectively) than the rest of the PT reagents (mean 1.11, 95% CI 1.07–1.15). Interaction between ST and test reagents was also unlikely, as this prolongation of PT by Reagent 2 and 3 was not observed in the other three patients who used ST. There was only one patient who took warfarin and an antibiotic with a N-methylthiotetra-zole side chain (i.e. cefmetaN-methylthiotetra-zole). Similar to the previous patient, only Reagents 2 and 3 showed an increase in PT-INR in this patient (relative increase of 1.36 and 1.40, respectively), and the mean value for the rest of the PT reagents did not increase (mean 0.98, 95% CI 0.92–1.03). Thus, true prolongation of PT by the N-methylthiotetra-zole side chain of cefmetaN-methylthiotetra-zole was unlikely. Additionally, artificial prolongation of PT resulting from the interac-tion between cefmetazole and the two PT test reagents was unlikely. This was because the blood level of cefmeta-zole was considered to decrease between the two time points of blood sample collection, as cefmetazole was administered 3 h before the first blood sample collection. The effect on normal gut flora was not likely to change PT dramatically in 1–3 h. Lastly, the prolongation of PT was not likely due to regression to the mean, as this trend of PT prolongation was unchanged even when patients with a lower initial PT-INR of <1.0 were excluded from the analyses (data not shown).
There were some differences between warfarin users and non-users. Both the absolute and relative increases in PT-INR between trough and peak were smaller in non-warfarin users compared to those in warfarin users. Similarly, the dose-dependent effect of daptomycin on PT prolongation was only observed in warfarin users in our study. In previous in vitro studies, normal plasma samples were less reactive to daptomycin than samples from patients with anti-vitamin K therapy [5], or with prolonged baseline PT (PT-INR > 2.0) [6]. Another study revealed that samples with normal PT were slightly less affected by daptomycin than that those obtained from warfarin users, whereas warfarin users with different PT levels showed a similar increase rate [3]. Another possibility is that the apparent discrepancy between the response in warfarin users and the response in non-users in our study might be due to the relatively low peak concentration of daptomycin in our patients rather than the warfarin effect. In all in vitro studies, changes of PT
in normal PT samples were small, particularly if the dap-tomycin concentration was low.
This study has some limitations. As we used clini-cal samples, we could not finely control the daptomycin concentration, which led to a relatively small difference between trough and peak daptomycin concentrations. Samples with a high peak concentration (e.g. >70 μg/mL) were also scarce in our study. Therefore, care is required when interpreting our results showing an increas-ing trend in the relative change of PT-INR caused by increased difference in the daptomycin concentrations for Reagents 2 and 3 because the prediction relied on a small number of samples with a high peak concentration. It is also possible that other tested agents are affected by daptomycin under a higher peak concentration. We can-not conclude whether the effect of daptomycin occurred in warfarin users or patients with high PT-INR for any reason because these patients largely overlapped in this study. Therefore, in the future, it is necessary to assess whether the measurement of PT from patients with ele-vated PT due to coagulopathy but not on warfarin will be affected by daptomycin.
Conclusion
In summary, we found that a higher concentration of daptomycin could lead to artificial prolongation of PT-INR by interacting with some PT reagents, particularly in patients on warfarin. Because we used clinical samples, the results of this study relied on a relatively small num-ber of samples, especially those with a high peak dapto-mycin concentration, which could have been influenced by many time-varying confounding factors in addition daptomycin concentration. Therefore, in vitro studies assessing the impact of daptomycin on some reagents may be warranted. In the meantime, we suggest that it may be better to measure PT near the trough concen-tration of daptomycin, especially when PT is elevated or warfarin is used.
Abbreviations
CI: confidence interval; ESI: electrospray ionization; IQR: interquartile range; MRM: multiple reaction monitoring; PG: phosphatidylglycerol; PT: prothrombin time; PT-INR: prothrombin time international normalised ratios; UPLC-MS/MS: ultra-performance liquid chromatography with tandem mass spectrometric detection; USA: United States of America.
Authors’ contributions
SH and HY conceived and conducted this study; MS, HH, DJ, and TS performed the clinical assessment and data collection; TS, MK, YK, TY and HS conducted laboratory work; MS and SH conducted statistical analysis and interpreted the data. MS, SH and TY drafted the manuscript; all the authors critically revised the manuscript for intellectual content. All authors read and approved the final manuscript.
Author details
1 Department of Infectious Diseases, University of Tokyo Hospital, 7-3-1
• We accept pre-submission inquiries
• Our selector tool helps you to find the most relevant journal • We provide round the clock customer support
• Convenient online submission • Thorough peer review
• Inclusion in PubMed and all major indexing services • Maximum visibility for your research
Submit your manuscript at www.biomedcentral.com/submit
Submit your next manuscript to BioMed Central
and we will help you at every step:
Medicine, Division of Infectious Diseases, Jichi Medical University Hospital, 3311-1 Yakushiji, Shimotsuke-shi, Tochigi 329-0498, Japan. 3 Department
of Clinical Laboratory, University of Tokyo Hospital, 7-3-1 Hongo, Bunkyo-ku, Tokyo 113-8655, Japan. 4 Department of Pharmacy, University of Tokyo
Hospi-tal, 7-3-1 Hongo, Bunkyo-ku, Tokyo 113-8655, Japan.
Acknowledgements
We would like to thank the patients who participated in this study and the staff who took care of them. We acknowledge the following diagnostics com-panies for technical support on PT reagents: Kyowa Medex Co., Ltd. (Tokyo, Japan), Roche Diagnostics K.K. (Tokyo, Japan), Sekisui Medical Co., Ltd. (Tokyo, Japan) and Sysmex Corporation (Hyogo, Japan).
Competing interests
MS received a scholarship from the GlaxoSmithKline International Scholarship Charitable Trust Fund and is receiving another scholarship from the University of Oxford Clarendon Fund. These funding sources had no roles in this study. All other authors declare that they have no competing interests.
Availability of data and materials
The dataset supporting the conclusions of this article is available from the corresponding author on request.
Consent for publication
Not applicable: all data are fully anonymised and do not include any identifi-able information.
Ethics approval and consent to participate
The patients in this study were enrolled after they gave full written consent. This study was conducted in accordance with the Declaration of Helsinki and approved by the Ethics Committee of the University of Tokyo Hospital (10026).
Funding
The authors declare that they did not have any funding source or grant to support their research work.
Publisher’s Note
Springer Nature remains neutral with regard to jurisdictional claims in pub-lished maps and institutional affiliations.
Received: 10 December 2016 Accepted: 5 April 2017
References
1. Steenbergen JN, Alder J, Thorne GM, Tally FP. Daptomycin: a lipopeptide antibiotic for the treatment of serious Gram-positive infections. J Antimi-crob Chemother. 2005;55(3):283–8.
2. Drug information: CUBICIN® (daptomycin for injection). 2016. https://
www.merck.com/product/usa/pi_circulars/c/cubicin/cubicin_pi.pdf. Accessed 25 Oct 2016.
3. Webster PS, Oleson FB Jr, Paterson DL, Arkin CF, Mangili A, Craven DE, Adcock DM, Lindfield KC, Knapp AG, Martone WJ. Interaction of dapto-mycin with two recombinant thromboplastin reagents leads to falsely prolonged patient prothrombin time/International Normalized Ratio results. Blood Coagul Fibrinolysis. 2008;19(1):32–8.
4. Kosmidis C, Levine DP. Daptomycin: pharmacology and clinical use. Expert Opin Pharmacother. 2010;11(4):615–25.
5. van den Besselaar AM, Breukink E, Koorengevel MC. Phosphatidylglycerol and daptomycin synergistically inhibit tissue factor-induced coagulation in the prothrombin time test. J Thromb Haemost. 2010;8(6):1429–30. 6. Yamada T, Kato R, Oda K, Tanaka H, Suzuki K, Ijiri Y, Ikemoto T, Nishihara
M, Hayashi T, Tanaka K, et al. False prolongation of prothrombin time in the presence of a high blood concentration of daptomycin. Basic Clin Pharmacol Toxicol. 2016;119(4):353–9.
7. Verdier MC, Bentue-Ferrer D, Tribut O, Collet N, Revest M, Bellissant E. Determination of daptomycin in human plasma by liquid chromatogra-phy-tandem mass spectrometry. Clinical application. Clin Chem Lab Med. 2011;49(1):69–75.
8. Poller L. Screening INR deviation of local prothrombin time systems. J Clin Pathol. 1998;51(5):356–9.
9. van den Besselaar AM, Tripodi A. Effect of daptomycin on prothrom-bin time and the requirement for outlier exclusion in International Sensitivity Index calibration of thromboplastin. J Thromb Haemost. 2007;5(9):1975–6.
10. Baddour LM, Wilson WR, Bayer AS, Fowler VG Jr, Tleyjeh IM, Rybak MJ, Barsic B, Lockhart PB, Gewitz MH, Levison ME, et al. Infective endocarditis in adults: diagnosis, antimicrobial therapy, and management of com-plications: a Scientific Statement for Healthcare Professionals From the American Heart Association. Circulation. 2015;132(15):1435–86. 11. Seaton RA, Gonzalez-Ruiz A, Cleveland KO, Couch KA, Pathan R, Hamed
K. Real-world daptomycin use across wide geographical regions: results from a pooled analysis of CORE and EU-CORE. Ann Clin Microbiol Antimi-crob. 2016;15:18.
12. van Geest-Daalderop JH, Mulder AB. Boonman-de Winter LJ, Hoekstra MM, van den Besselaar AM: Preanalytical variables and off-site blood col-lection: influences on the results of the prothrombin time/international normalized ratio test and implications for monitoring of oral anticoagu-lant therapy. Clin Chem. 2005;51(3):561–8.
13. Bleske BE, Welage LS, Warren EW, Brown MB, Shea MJ. Variations in prothrombin time and international normalized ratio over 24 hours in warfarin-treated patients. Pharmacotherapy. 1995;15(6):709–12. 14. García A, Marín F, Sánchez B, Roldán V, Marco P. Diurnal variation in the
intensity of anticoagulation in atrial fibrillation. Stroke. 2002;33(1):322–4. 15. Ho C-H, Lin M-W, You J-Y, Chen C-C, Yu T-J. Variations of prothrombin
![Fig. 1 The relative change of PT-INR and the difference in daptomycin concentrations [Dap] between trough and peak](https://thumb-us.123doks.com/thumbv2/123dok_us/8911409.1836836/5.595.55.291.501.725/fig-relative-change-inr-difference-daptomycin-concentrations-trough.webp)