DEMOGRAPHIC RESEARCH
VOLUME 34, ARTICLE 19, PAGES 525
−
562
PUBLISHED 22 MARCH 2016
http://www.demographic-research.org/Volumes/Vol34/19/ DOI: 10.4054/DemRes.2016.34.19
Research Article
Forgotten marriages? Measuring the reliability
of marriage histories
Sophia Chae
©2016 Sophia Chae.
This open-access work is published under the terms of the Creative Commons Attribution NonCommercial License 2.0 Germany, which permits use, reproduction & distribution in any medium for non-commercial purposes, provided the original author(s) and source are given credit.
1 Introduction 526
1.1 Theories of misreporting 526
1.2 Marriage in Malawi 528
1.3 Predictors of misreporting 530
1.3.1 Marriage characteristics 530
1.3.2 Individual characteristics 532
1.3.3 Survey characteristics 533
1.3.4 Interviewer characteristics 534
2. Data 535
2.1 Reconstructed marriage histories 536
2.2 Reporting errors 537
2.3 Sources of reporting error 538
3 Results 540
3.1 Descriptive statistics 540
3.2 Characteristics associated with omitted marriages 543 3.3 Characteristics associated with marriage date inconsistencies 545
3.4 Marriage indicators: MLSFH vs. RMH 548
4 Discussion 549
5 Conclusion 552
6 Acknowledgements 553
References 554
Forgotten marriages? Measuring the reliability of marriage histories
Sophia Chae1
Abstract
BACKGROUND
Marriage histories are a valuable data source for investigating nuptiality. While researchers typically acknowledge the problems associated with their use, it is unknown to what extent these problems occur and how marriage analyses are affected.
OBJECTIVE
This paper seeks to investigate the quality of marriage histories by measuring levels of misreporting, examining the characteristics associated with misreporting, and assessing whether misreporting biases marriage indicators.
METHODS
Using data from the Malawi Longitudinal Study of Families and Health (MLSFH), I compare marriage histories reported by the same respondents at two different points in time. I investigate whether respondents consistently report their spouses (by name), status of marriage, and dates of marriage. I use multivariate regression models to investigate the characteristics associated with misreporting. Finally, I examine whether misreporting marriages and marriage dates affects marriage indicators.
RESULTS
Results indicate that 28.3% of men and 17.9% of women omitted at least one marriage in one of the survey waves. Multivariate regression models show that misreporting is not random: marriage, individual, interviewer, and survey characteristics are associated with marriage omission and marriage date inconsistencies. Misreporting also affects marriage indicators.
CONCLUSIONS
This is the first study of its kind to examine the reliability of marriage histories collected in the context of Sub-Saharan Africa. Although marriage histories are frequently used to study marriage dynamics, until now no knowledge has existed on the degree of misreporting. Misreporting in marriage histories is shown to be non-negligent and could potentially affect analyses.
1. Introduction
Retrospective marriage histories collected in surveys are a valuable source of information on nuptiality. They usually contain information on respondents’ reported marriages, including marriage dates and how unions ended. Researchers have previously used survey-based marriage histories to calculate the probabilities of divorce and remarriage, examine the sociodemographic factors associated with these events, and identify respondents who divorced and/or remarried between survey waves (Amoateng and Heaton 1989; Anglewicz and Reniers 2014; Boileau et al. 2009; Brandon 1990; Fedor, Kohler, and Behrman 2015; Gage-Brandon 1992; Grant and Yeatman 2014; Hampshire and Randall 2000; Locoh and Thiriat 1995; Reniers 2003, 2008; Reniers and Tfaily 2008; Takyi and Gyimah 2007; Tilson and Larsen 2000). Despite their value, retrospective marriage histories, like other forms of survey data, may be incomplete or contain incorrect information. While researchers typically acknowledge problems with retrospective marriage histories, such as respondents omitting unsuccessful or short unions and misreporting dates (Boileau et al. 2009; Reniers 2008), it is unknown to what extent these problems occur and, more importantly, how marriage analyses are affected. Ideally, the validity of marriage histories would be measured by comparing them against public records: however, this is not feasible in many parts of Africa because civil marriages are not the norm (Enel, Pison and Lefebvre 1994; van de Walle and Meekers 1994).
An alternative method is to measure their reliability by comparing marriage histories reported by the same respondent at two or more points in time. Using data from the Malawi Longitudinal Study of Families and Health (MLSFH), this study investigates whether respondents consistently report their spouses (by name), status of marriage, and dates of marriage across two survey waves. This study also investigates the characteristics associated with marriage omission and marriage date inconsistencies and examines whether misreporting biases marriage indicators. Results indicate that a considerable amount of misreporting exists and that misreporting does not appear to be random. Several marriage, individual, survey, and interviewer characteristics are associated with misreporting and marriage indicators are shown to be affected by misreporting.
1.1 Theories of misreporting
underreport and/or overreport events such as unemployment, migration, births, pregnancy, cohabitation, and sexual behavior (Courgeau 1992; Dare and Cleland 1994; Hayford and Morgan 2008; Hertrich 1998; Mathiowetz and Duncan 1988; Ratcliffe et al. 2002; Smith and Thomas 2003). Overreporting or underreporting events can lead to calculated rates, such as birth rates and divorce rates, being over- or underestimated. It can also result in biased population-level indicators. Furthermore, regression estimates can be biased if individuals are incorrectly coded as having experienced certain events, such as sexual debut.
The second type of misreporting occurs when respondents misreport event dates such as migration, marriage, and divorce, as well as the ages at which events occur, including age at first sex or marriage (Auriat 1993; Hertrich 1998; Mitchell 2010; Smith and Thomas 2003; Wringe et al. 2009; Zaba et al. 2009). Misreporting event dates can affect calculated rates by simultaneously increasing and decreasing the number of events occurring in two adjacent time periods, leading to both over- and under- estimates of rates during a particular time period. By changing the temporal ordering of events, misreporting event dates can also affect analyses attempting to assign causality. Lastly, misreporting event dates can lead to the misrepresentation of trends, such as age at first sex or marriage.
The survey response model proposes a framework for understanding how respondents answer survey questions that can help us diagnose misreporting (Sudman, Bradburn and Schwarz 1996; Tourangeau, Rips and Rasinski 2000). The ideal respondent provides accurate and complete answers by carefully and comprehensively following the four steps outlined in this model: comprehension, retrieval, judgment, and response formatting. Misreporting occurs when the respondent cannot or does not fully carry out each step of the process.
Comprehension refers to the ability of respondents to understand the question in the same manner as the researcher who designed the question intended. In Sub-Saharan Africa a variety of marriage forms exist, including free unions, consensual unions, customary marriages, and religious and civil marriages (Arnaldo 2004; Budlender, Chobokoane and Simelane 2004). Although surveys and censuses typically categorize all of these unions as marriages (van de Walle 1968), respondents may not define marriages in the same manner. Consequently, miscomprehending the question could result in respondents underreporting marriages.
necessary information, the respondent judges whether the retrieved information answers the interview question. If it does not fulfill the objective of the question, then the retrieval stage is repeated. Alternatively, the respondent may decide that it is not worth the effort to repeat the judgment step, resulting in marriages being misreported.
Finally, the respondent evaluates the retrieved information and decides on the appropriate response format. If the respondent finds that the response would be embarrassing or portray the respondent in an unfavorable light, then he or she might edit the information in order to produce a socially desirable response (Tourangeau and Yan 2007). For example, a respondent may be embarrassed to admit that he or she has been divorced and, as a result, not report marriages that ended in divorce.
1.2 Marriage in Malawi
of women enter into polygynous first marriages. The central region, where the Chewa are the dominant ethnic group, observes a mixture of patrilineal and matrilineal kinship structures, and residence can be either virilocal or uxorilocal after marriage. Statistics for the central region lie between those of the north and south.
Table 1: Ethnic group, religion, and marriage patterns by region among women, 1998 and 2001 MLSFH
Characteristic North South Central
Ethnic Group (dominant)a Tumbuka (90%) Yao (67%) Chewa (79%)
Religiona
Catholic 12% 13% 25%
Protestant 86% 18% 71%
Muslim 0% 69% 0%
Other 2% 0% 3%
Polygynous husband (1st marriage)b 41% 23% 28%
Type of Lineagec
Matrilineal 0% 85% -
Patrilineal 100% 6% -
Bi-lateral/Chief 0% 9% -
Virilocal residence after 1st marriage b 73% 24% 83%
Marriage Customs
Level of formality Formal Informal Formal or
informal
Bridewealth paid Yes No In some cases
Ended in divorce (1st marriage) b
After 5 years 14% 33% 20%
After 25 years 40% 65% 43%
a
Author’s own calculations using data from the 2001 MLSFH.
b
Reniers (2003) calculated statistics using data from the 2001 MLSFH.
c
Schatz (2002) calculated statistics using data from the 1998 MLSFH. Schatz did not provide statistics for type of lineage in the central region.
details of marriages from their memory. Due to the saliency of first marriages as an important milestone, second and higher order marriages are more likely to be misreported. Because many individuals have experienced more than one marriage, there is a greater chance that they will confuse marriage details such as start and end dates. For the same reason, polygamous men may have greater difficulty than monogamous men in keeping track of and remembering details of specific marriages.
1.3 Predictors of misreporting
Long-standing interest in how the survey response process affects data quality (e.g., Neter and Waksberg 1964) has culminated in a large body of literature examining the characteristics associated with misreporting. Marriage, individual, survey, and interviewer characteristics lead to marriage omission and marriage date inconsistencies when the four steps of the survey response process are not carried out fully and completely (Table 2).
1.3.1 Marriage characteristics
Marriage characteristics can affect the first three steps of the survey response process. Where marriages are casual and informal, respondents may not know whether they should report a union as a marriage. The lack of a wedding event makes it less clear when a marriage started. Longer duration states tend to be more memorable than those of a shorter duration (Auriat 1991; Cannell, Miller and Oksenberg 1981; Smith and Thomas 2003). Similarly, salient events, defined as events that induce emotions at the time of the event or mark a turning point or transition in one’s life, are more likely to be remembered than those of lesser importance (Mathiowetz and Duncan 1988; Neisser and Winograd 1995; Sudman et al. 1996; Thompson et al. 1996). As in many cultures, first marriages tend to be salient events, marking an important milestone in a person’s life: thus they are more likely to be remembered than later marriages.
Table 2: Hypotheses predicting marriage omission and marriage date inconsistency
Characteristics Marriage omission
Start date inconsistency
End date inconsistency
Marriage Characteristics
Southern residence (vs. Central and
Northern) - H1 (+) -
Marriage order H2 (+)a H2 (+) H2 (+)
Short duration marriage H3 (+) H3 (+)b H3 (+)
Time since marriage began - H4 (+) H4 (+)
Polygamous marriage (men only) H5 (+) H5 (+) -
Terminated marriage (vs. continuous
marriage) - H6 (+) -
Widowed marriage (vs. divorced
marriage) - - H7(-)
Individual Characteristics
Age H8 (+)b H8 (+) H8 (+)
Male H9 (+) H9 (+) H9 (+)
Education - H10 (-) H10 (-)
Survey Characteristics
Length of survey time H11a (+); H11b
(-)
H11a (+); H11b
(-)a
H11a (+); H11b (-)
Degree of cooperation H12 (-) H12 (-)b H12 (-)
Interviewer Characteristics
Female H13 (+) H13 (+) H13 (+)
Ever-married H14 (-) H14 (-) H14 (-)
Prior interviewing experience H15 (-)a H15 (-)a H15 (-)
Note: Direction of association is noted in parentheses. Hypotheses in bold are supported by the data. a Hypothesis is supported for men only.
b Hypothesis is supported for women only.
The following hypotheses can be offered for effects of marriage characteristics on marriage misreporting:
H1: In southern Malawi, where many marriages are casual and informal, marriage start dates are more likely to be misreported than in other regions.
H2: Higher-order marriages are more likely to be misreported than first marriages. H3: Short-duration marriages are more likely to be misreported than long-duration
marriages.
H4: Time since marriage began is positively associated with misreported marriage dates.
H5: Polygamous marriages are more likely to be misreported by men than monogamous marriages.
H6: Start dates of terminated marriages are more likely to be misreported than those of continuous marriages.
H7: End dates of marriages that ended in widowhood are less likely to be misreported than those of marriages that ended in divorce.
1.3.2 Individual characteristics
and Thomas 2003). Schooling may increase a set of skills related to the ability to recall information. On the other hand, marriage is a relatively rare event and should therefore pose less difficulty in recall.
I hypothesize that the following individual characteristics influence marriage misreporting:
H8: Older respondents are more likely than younger respondents to misreport marriages.
H9: Men are more likely then women to misreport marriages.
H10: Education is associated with lower levels of marriage date misreporting.
1.3.3 Survey characteristics
Survey characteristics can reflect difficulties that respondents experience in the retrieval and judgment steps of the survey response process. Some respondents may become fatigued and deliberately underreport events as a way to shorten the interview (Murphy 2009). Misreporting occurs because fatigued respondents skip the retrieval and/or judgment steps of the survey response process. On the other hand, longer survey times may reflect respondents spending more time thinking about survey questions, resulting in a more thorough retrieval and judgment process. Respondent cooperation could also be associated with misreporting. In a study of married couples in Detroit, Michigan, respondents rated as being more difficult underreported events more often than respondents who attempted to remember events (Kessler and Wethington 1991). Uncooperative respondents may forgo the retrieval and judgment steps of the survey response process. I propose that the following survey characteristics predict marriage misreporting:
H11a: Longer survey times are more likely to be associated with misreported marriages than shorter survey times.
H11b: Longer survey times are less likely to be associated with misreported marriages than shorter survey times.
1.3.4 Interviewer characteristics
The interviewer plays an important role in the survey response process, serving as the conduit from which the attitudes, experiences, and perceptions of the respondent are transmitted and processed into data. Interviewer quality could affect how well respondents complete the first three steps of the survey response process. During the first step, interviewer quality can affect whether respondents comprehend the question as the researcher intended. For instance, higher quality interviewers may be better at explaining questions and/or providing clarification to respondents. During the second and third steps, higher quality interviewers can provide retrieval cues to help respondents retrieve and judge the relevant information from their memory. Interviewers can also affect responses during the final stage, response formatting. Outward characteristics of the interviewer such as gender or non-measurable characteristics such as the demeanor of interviewers could influence misreporting. For example, some interviewers may be better at creating a rapport with respondents and making them feel comfortable when answering questions. Prior studies have shown an inconsistent relationship between interviewer’s gender and survey responses. A study in Nepal found that female respondents were more likely to underreport current pregnancies to male interviewers (Axinn 1991): however, in Nigeria the interviewer’s gender did not matter for responses to sensitive questions about family planning (Becker, Feyisetan and Makinwa-Adebusoye 1995).
The present study defines higher quality interviewers as being male, ever-married, and having prior interviewing experience. Based on knowledge of the interviewer selection process, I assume that female interviewers are, on average, of lower quality than male interviewers. The research team set lower cutoff scores for selecting female interviewers than male interviewers in order to fulfill gender quotas. I classify ever-married interviewers as being of higher quality because they are more likely to establish a rapport with respondents and encourage respondents to open up about past and current marriages. Interviewers with prior interviewing experience likely are better skilled at probing for responses than those with no prior experience. I hypothesize that the following interviewer characteristics predict misreporting in marriage histories:
H13: Female interviewers produce more marriage misreporting than male interviewers. H14: Ever-married interviewers produce less marriage misreporting than never-married
H15: Interviewers with prior experience produce less marriage misreporting than inexperienced interviewers.
2. Data
This study uses data from the Malawi Longitudinal Study of Families and Health (MLSFH), formerly known as the Malawi Diffusion and Ideational Change Project (MDICP). The MLSFH is a panel survey that interviewed ever-married men and women in three rural districts of Malawi: Rumphi (northern), Mchinji (central), and Balaka (southern). The first wave of data collection occurred in 1998 and interviewed 1,541 ever-married women, ages 15-49, and 1,065 of their husbands. Since 1998 five additional rounds of data collection have taken place (2001, 2004, 2006, 2008, 2010). See Kohler et al. (2014) for more details on the study sample and data collection procedures in the MLSFH. The quality of data collected in the MLSFH has been the subject of investigation in a number of studies: however, none of these studies directly examined the quality of marriage histories (Appendix 1).
The present study uses data from the 2006 and 2010 waves of the MLSFH. These waves were chosen because of the nature of the marriage histories collected and the availability of data on the interviewers. Seventy-four percent of the respondents interviewed in 2006 were re-interviewed in 2010. In general, refusal to participate in the survey was relatively rare: fewer than 5% of respondents who were successfully contacted refused to participate (Kohler et al. 2014). Furthermore, the principal reason for not being re-interviewed was migration out of the survey area (Anglewicz et al. 2009), primarily due to marital instability (Anglewicz 2012). Thus, this study will likely underestimate misreporting in marriage histories.
Data collection procedures in the 2006 and 2010 MLSFH differed in two ways. In 2006 three survey teams, ‘family listing’, ‘main survey’, and ‘biomarker collection’, interviewed respondents. Three separate visits were required to complete all sections of the survey. In 2010 biomarker collection did not occur and the family listing and main survey questionnaires were combined into a single questionnaire, resulting in only one visit. Consequently, respondents answered questions about marriage after a substantial amount of time had passed, increasing the likelihood of survey fatigue. In 2010 the MLSFH introduced a system of incentives to the survey teams for the first time. If a survey team completed a minimum number of interviews per day, then all members of the team (supervisors, interviewers, and driver) received a financial bonus. This system could have motivated some interviewers to rush through interviews to increase their team’s chances of receiving a bonus.
2.1 Reconstructed marriage histories
A dataset of reconstructed marriage histories (RMH) was created using data from the 2006 and 2010 waves of the MLSFH. Only marriages that began before the 2006 survey and were reported in either 2006 or 2010 were included in this dataset. To create the RMH, I first matched marriages across surveys for all respondents who reported marriage histories in both survey waves. Because names tend to be spelled differently across survey waves, mostly due to the interpretation of the interviewer, marriages were visually matched on a case-by-case basis. Spouse name was the primary criteria used to verify that a marriage listed in 2006 corresponded to a marriage listed in 2010. With few exceptions, spouse names were similar enough to match without difficulty. I also used marriage dates to verify matches. If a marriage began before the 2006 wave and was not reported in both 2006 and 2010, then it was coded as an “unmatched” marriage. If a marriage began before the 2006 wave and was reported in both survey waves, then it was coded as a “matched” marriage. I dropped 74 respondents for whom I could not match any marriages. That is, these respondents did not report any of the same spouses in 2010 as in 2006, raising suspicions as to whether the MLSFH interviewed the same respondent in both waves.
question would have happened closer in time to the earlier survey. If a respondent reported “don’t know”, then data from the later survey were used (if this information was reported). The reconstructed marriage histories produced the following indicators for each marriage: marriage order (first, second, third, etc.), year marriage began, status of marriage at interview (still married, separated/divorced2, widowed), and year marriage ended.
2.2 Reporting errors
The unit of analysis for this study is a marriage. The present study focuses on three types of reporting error: marriage omission (as measured by match status), start date inconsistency, and end date inconsistency. Match status coding was determined by whether a marriage was reported in only one survey year or both years: marriages that were reported in both survey waves are coded as “matched” marriages. Marriages that occurred before 2006 and were reported in only one survey year are coded as “unmatched” (or omitted) marriages. Marriages that had ended by 2010 were divided into two groups: matched-terminated and unmatched-terminated.3 Because respondents should be reporting continuous marriages (married to the same spouse in 2006 and 2010), I did not expect to observe unmatched marriages among these marriages.4 Thus all continuous marriages are considered to be “matched” marriages. Match status is coded in the following manner: unmatched-terminated (omitted), matched-terminated, and matched-continuous.
For the sub-sample of marriages that were reported in both survey waves, I constructed a variable measuring start date inconsistency. If a respondent reported different years for the marriage start date in 2006 and 2010, then the variable is coded as being inconsistently reported. If the same year is reported in both survey waves, then the variable is coded as being consistently reported. The same process was used to code end date inconsistency, except the sub-sample was further limited to marriages that ended before the 2006 survey.
2 Because most separations are soon followed by divorce, I combined divorced and separated into the same
category. From this point forward, I refer to this category as “divorced”. 3
Among matched−terminated marriages, 26.4% ended between 2006 and 2010. Among unmatched− terminat-ed marriages, 6.8% endterminat-ed between 2006 and 2010.
4 There are, however, four cases where unmatched marriages were found among continuous marriages. In all
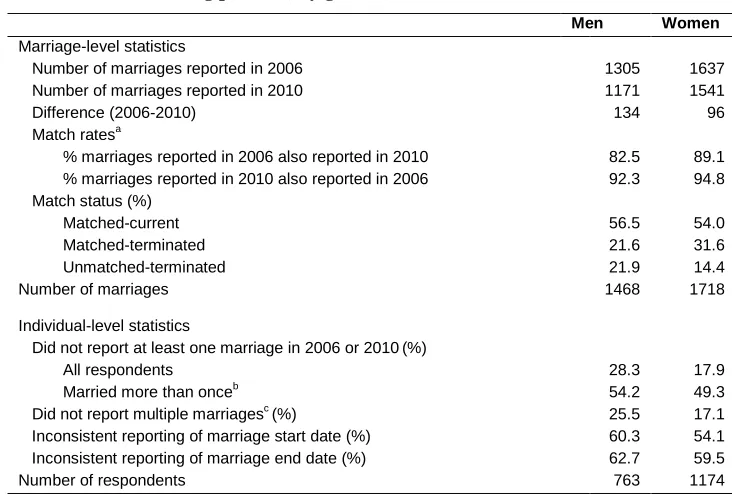
In Table 3 I present descriptive statistics of the matching process. Only marriages that began before 2006 are included. A greater number of marriages are reported in 2006 than in 2010 and match rates indicate that the majority of unmatched marriages are reported in 2006 but not in 2010. Whereas 92.3% of men’s marriages and 94.8% of women’s marriages reported in 2010 are also reported in 2006, only 82.5% of men’s marriages and 89.1% of women’s marriages reported in 2006 are reported in 2010. In total, 1,468 men’s marriages and 1,718 women’s marriages were reported in at least one survey wave. Of these, approximately one in five marriages are unmatched. Since it is unknown whether respondents reported all of their marriages in 2006 and 2010, these numbers mark the lower bound of the true number of marriages. In terms of individual-level statistics, 28.3% of men and 17.9% of women omitted at least one marriage from one of the survey waves. Among respondents married multiple times, around 50% omitted one or more marriages. Of respondents omitting at least one marriage, approximately 20% failed to report two or more marriages in either 2006 or 2010. Roughly 60% of respondents who reported at least one marriage in both survey waves inconsistently reported marriage start and end dates.
2.3 Sources of reporting error
Four potential sources of reporting error were observed in the data: marriage, individual, survey, and interviewer characteristics.
Table 3: Matching processa, by gender, 2006 and 2010 MLSFH
Men Women
Marriage-level statistics
Number of marriages reported in 2006 1305 1637
Number of marriages reported in 2010 1171 1541
Difference (2006-2010) 134 96
Match ratesa
% marriages reported in 2006 also reported in 2010 82.5 89.1
% marriages reported in 2010 also reported in 2006 92.3 94.8
Match status (%)
Matched-current 56.5 54.0
Matched-terminated 21.6 31.6
Unmatched-terminated 21.9 14.4
Number of marriages 1468 1718
Individual-level statistics
Did not report at least one marriage in 2006 or 2010(%)
All respondents 28.3 17.9
Married more than onceb 54.2 49.3
Did not report multiple marriagesc (%) 25.5 17.1
Inconsistent reporting of marriage start date (%) 60.3 54.1
Inconsistent reporting of marriage end date (%) 62.7 59.5
Number of respondents 763 1174
a
Restricted to marriages that began before the 2006 wave.
b
Refers to respondents married more than once by the 2006 wave.
c
Among respondents who did not report at least one marriage in both survey waves.
Individual characteristics. Age is measured as a continuous variable and all models also include a term for age squared to allow for a non-linear relationship between age and misreporting. Educational attainment is coded as none, some primary, completed primary, and secondary. Age and educational attainment are taken from the 2006 survey. The inconsistency score, coded continuously from 0 to 3, measures the number of items (educational attainment, number of children ever born, and number of lifetime sexual partners) for which respondents provided inconsistent responses in the 2006 and 2010 survey waves. Inconsistency score is included in models as a potential mediator between individual characteristics and misreporting.
combined “bad” and “average” responses into the same category. The other categories are coded as “good” and “very good”.
Interviewer characteristics. At the end of data collection, interviewers answered questions about their background and work history. This information was merged with the survey responses. While the 2010 interviewer data are, for the most part, complete, a significant proportion of the 2006 interviewer data was found to be missing: 30.4% of respondents in the analytic sample lack 2006 interviewer data. This problem is not random and disproportionately affects respondents in the central region, where 47.7% have missing data. As a result, only 2010 interviewer characteristics were included in regression analyses. These characteristics include gender, ever-married, and prior interviewing experience.
3. Results
3.1 Descriptive statistics
In Table 4, I present the number of marriages men and women reported in marriage histories in 2006 and 2010. For reports to appear consistent, the number of reported marriages should remain constant or increase over time. The left side of the table corresponds to the reported number of marriages in 2006 and the top row corresponds to the same figure in 2010. Shaded areas denote declines in the reported number of marriages. Approximately 17% and 10% of men and women, respectively, reported fewer marriages in 2010.
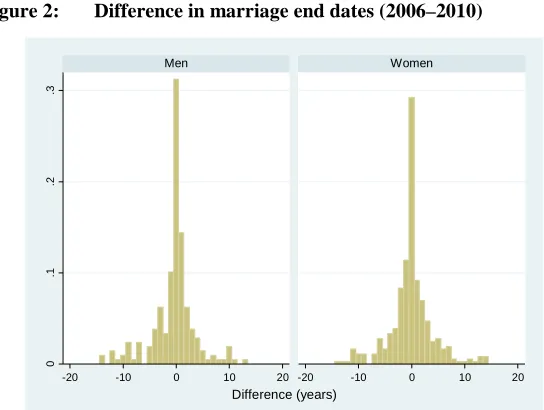
Two other types of misreporting of marriages may occur: 1) an increase in the number of marriages even though a new marriage did not occur in the inter-survey period and 2) the same number of marriages reported even though a new marriage (i.e., a different spouse) took place between survey waves. To provide information on these processes I turn to analysis of marriages rather than respondents. I examine whether respondents consistently report status of marriage, marriage start dates, and marriage end dates across survey waves. Minimal discrepancy exists on marriage status: fewer than 2% of men’s marriages and 4% of women’s marriages had discrepancies. Approximately half of all marriages had discrepancies in marriage dates (Figures 1 and 2).5 Mean discrepancies in marriage dates are approximately the same for men and women, 1.3 to 1.4 years (not shown).
5 I removed outliers from the graphs because they affect the overall presentation of data. For marriage start
Table 4: Number of marriages reported in marriage histories for men and women, 2006 and 2010 MLSFH
Men 2010
1 2 3 4 5 6 7 Total
2006
1 341 53 7 0 1 0 0 402
2 65 141 22 5 2 0 0 235
3 16 25 38 9 1 1 1 91
4 8 5 3 6 1 1 0 24
5 1 1 3 1 2 0 0 8
6 0 0 0 0 0 1 0 1
7 0 0 0 0 0 0 0 0
8 0 0 0 0 0 0 0 0
9 0 1 0 0 0 0 0 1
10 1 0 0 0 0 0 0 1
Total 432 226 73 21 7 3 1 763
Women
2010
1 2 3 4 5 6 7 Total
2006
1 743 58 9 0 1 0 0 811
2 76 167 32 2 1 0 0 278
3 13 21 31 5 0 0 0 70
4 1 2 4 3 0 0 0 10
5 2 0 0 0 0 0 1 3
6 0 0 0 1 0 0 0 1
Total 835 248 76 11 2 0 1 1173
Figure 1: Difference in marriage start dates (2006–2010)
Note: Restricted to marriages where marriage start dates were reported in 2006 and 2010.
Figure 2: Difference in marriage end dates (2006–2010)
Note: Restricted to terminated marriages where marriage end dates were reported in 2006 and 2010.
0
.5
-10 -5 0 5 10 -10 -5 0 5 10
Men Women
Difference (years)
0
.1
.2
.3
-20 -10 0 10 20 -20 -10 0 10 20
Men Women
3.2 Characteristics associated with omitted marriages
I use multinomial logistic regression to model match status: unmatched-terminated, matched-terminated, and matched-continuous. This method permits the inclusion of both continuous and terminated marriages in regression models.6 Keeping matched-continuous marriages in the analysis allows for the full range of covariation among marriage, individual, survey, and interviewer indicators.7 Because this analysis is concerned with characteristics associated with unmatched marriages, matched-terminated is chosen as the base outcome. All independent variables except status of marriage are included in regression models. Status of marriage is not included because continuous marriages predict continuous marriages perfectly. For men, I built two sets of models. Model 1 includes all variables except polygamous marriage and Model 2 includes all variables except marriage order. Due to collinearity I did not include the two measures in the same model. By definition, if a male respondent entered into a polygamous marriage it is a second or higher order marriage. Standard errors are adjusted to take into account clustering at the individual level because some individuals contribute multiple marriages to regression analyses.
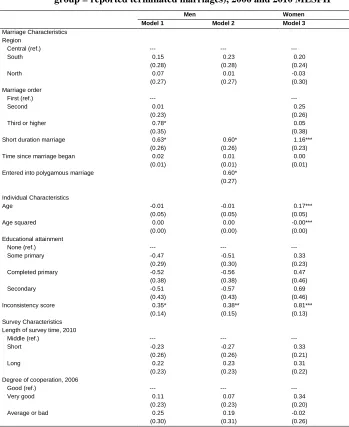
Table 5 presents multinomial logistic regression results contrasting unmatched-terminated marriages (or marriages that have been omitted from one of two survey waves) to matched-terminated marriages. Due to space constraints and lack of theoretical significance, I do not present regression results contrasting matched-continuous marriages to matched-terminated marriages (available upon request). Almost all marriage characteristics are associated with men’s failure to report a terminated marriage at both interviews. Marriages of order three or higher and those of short duration are more likely to be omitted, consistent with Hypotheses 2 and 3. Men’s polygamous marriages are also more likely to be unmatched (Hypothesis 5). Among women, only short duration reduced the likelihood of reporting a terminated marriage at both interviews, consistent with Hypothesis 3.
Older women are more likely to omit marriages (Hypothesis 8). The direction of the age-squared term indicates that the relationship is non-linear, increasing at a decreasing rate and eventually plateauing at around age 70. Age is not associated with omitted marriages among men. Furthermore, a positive association between inconsistency score and marriage omission is observed for both men and women.
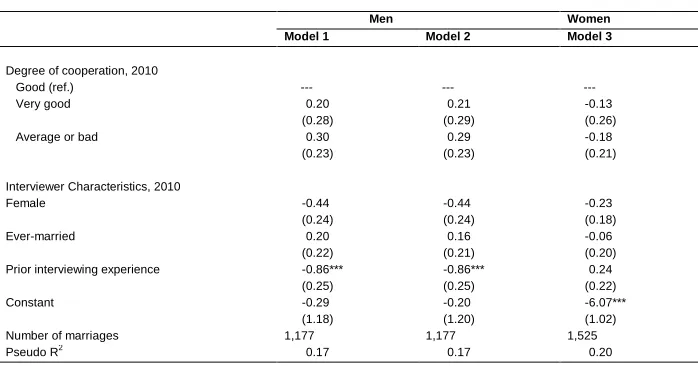
None of the survey characteristics were found to be associated with unmatched marriages for either men or women. Prior interviewing experience is negatively associated with marriage omission among men, consistent with Hypothesis 15.
6 Marriages that ended between 2006 and 2010 are treated as terminated marriages.
7 I obtained similar results when I restricted the sample to terminated marriages and estimated a logistic
Table 5: Multinomial logistic regression results predicting marriage omission from one of two survey waves among men and women (reference group = reported terminated marriages), 2006 and 2010 MLSFH
Men Women
Model 1 Model 2 Model 3
Marriage Characteristics Region
Central (ref.) --- --- ---
South 0.15 0.23 0.20
(0.28) (0.28) (0.24)
North 0.07 0.01 -0.03
(0.27) (0.27) (0.30)
Marriage order
First (ref.) --- ---
Second 0.01 0.25
(0.23) (0.26)
Third or higher 0.78* 0.05
(0.35) (0.38)
Short duration marriage 0.63* 0.60* 1.16***
(0.26) (0.26) (0.23)
Time since marriage began 0.02 0.01 0.00
(0.01) (0.01) (0.01)
Entered into polygamous marriage 0.60*
(0.27)
Individual Characteristics
Age -0.01 -0.01 0.17***
(0.05) (0.05) (0.05)
Age squared 0.00 0.00 -0.00***
(0.00) (0.00) (0.00)
Educational attainment
None (ref.) --- --- ---
Some primary -0.47 -0.51 0.33
(0.29) (0.30) (0.23)
Completed primary -0.52 -0.56 0.47
(0.38) (0.38) (0.46)
Secondary -0.51 -0.57 0.69
(0.43) (0.43) (0.46)
Inconsistency score 0.35* 0.38** 0.81***
(0.14) (0.15) (0.13)
Survey Characteristics Length of survey time, 2010
Middle (ref.) --- --- ---
Short -0.23 -0.27 0.33
(0.26) (0.26) (0.21)
Long 0.22 0.23 0.31
(0.23) (0.23) (0.22)
Degree of cooperation, 2006
Good (ref.) --- --- ---
Very good 0.11 0.07 0.34
(0.23) (0.23) (0.20)
Average or bad 0.25 0.19 -0.02
Table 5: (Continued)
Men Women
Model 1 Model 2 Model 3
Degree of cooperation, 2010
Good (ref.) --- --- ---
Very good 0.20 0.21 -0.13
(0.28) (0.29) (0.26)
Average or bad 0.30 0.29 -0.18
(0.23) (0.23) (0.21)
Interviewer Characteristics, 2010
Female -0.44 -0.44 -0.23
(0.24) (0.24) (0.18)
Ever-married 0.20 0.16 -0.06
(0.22) (0.21) (0.20)
Prior interviewing experience -0.86*** -0.86*** 0.24
(0.25) (0.25) (0.22)
Constant -0.29 -0.20 -6.07***
(1.18) (1.20) (1.02)
Number of marriages 1,177 1,177 1,525
Pseudo R2
0.17 0.17 0.20
Note: Robust standard errors are in parentheses. Omitted category = matched-current marriages. Analysis is restricted to marriages that began before 2006.
* p<0.05; ** p<0.01; *** p<0.001.
3.3 Characteristics associated with marriage date inconsistencies
Logistic regression is used to examine the characteristics associated with inconsistent reporting of marriage start and end dates. Because analyses are restricted to marriages reported in both survey waves, respondents whose marriages are included may be selected for better reporting. Logistic regression models are estimated separately for each outcome. All characteristics of the marriage, the respondent, the interview, and the interviewer are included in models of start date inconsistency. Again, I estimated two separate models for male respondents, one with marriage order and the other with polygamous marriage. For end date inconsistency, only terminated-matched marriages are included and, due to a substantial decline in sample size, men’s and women’s marriages are pooled.8 All independent variables are included except polygynous marriage, because it does not apply to women. In all models I adjust standard errors to take into account clustering at the individual level because some individuals contribute multiple marriages.
8 I tested interactions between gender and all other sources of reporting inconsistency. Only one statistically
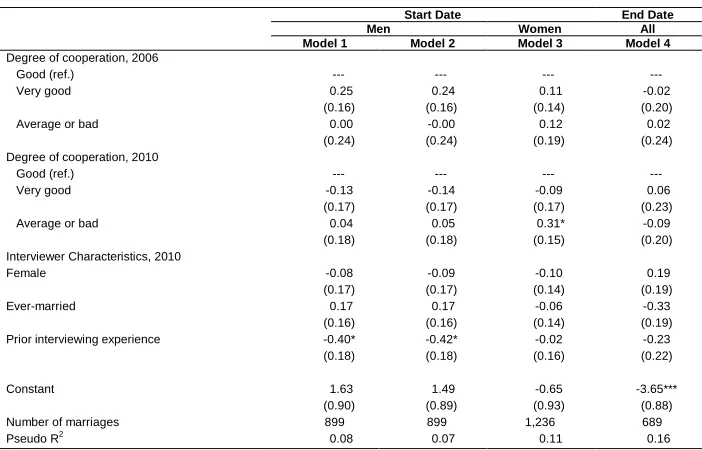
Table 6 presents logistic regression results for marriage start and end date inconsistencies. Southern marriages are significantly more likely to have inconsistently reported start dates than those in the central region (Hypothesis 1). Start dates of higher-order marriages, specifically second marriages, are more likely to be inconsistently reported, as hypothesized (H2). Although the coefficient is large and positive for third or higher order marriages it is not statistically significant, possibly due to low statistical power resulting from the small number of marriages in this category. When marriage order is not in the model (Model 2), time since marriage began is negatively associated with inconsistency for men, but the coefficient is small and is not significant when taking into account marriage order (Model 1). Start dates for short duration marriages are more likely to be inconsistently reported by women, but not by men, providing mixed results for Hypothesis 3. Widowhood increases inconsistency in reporting start dates, consistent with Hypothesis 6. Women are also more likely to report inconsistent start dates when the marriage ended in divorce.
As hypothesized (Hypothesis 10), educational attainment is negatively associated with inconsistent reporting of marriage start dates. Inconsistency scores also predict inconsistent reporting of marriage start dates among women but not men.
Among men but not women, shorter interview times are positively associated with misreporting start dates (Hypothesis 11b). Women reported by the interviewer to be less cooperative were more likely to inconsistently report start dates (Hypothesis 12), but no such differences were found for men. Prior interviewer experience is associated with greater consistency in reporting start dates, but only for men (Hypothesis 15).
Table 6: Logistic regression results predicting marriage date inconsistencies among men and women, 2006 and 2010 MLSFH
Start Date End Date
Men Women All
Model 1 Model 2 Model 3 Model 4
Marriage Characteristics Region
Central (ref.) --- --- --- ---
South 0.60** 0.64** 0.79*** 0.17
(0.21) (0.21) (0.17) (0.23)
North 0.36 0.32 0.00 -0.22
(0.19) (0.19) (0.18) (0.25)
Marriage order
First (ref.) --- --- ---
Second 0.52** 0.39* -0.20
(0.19) (0.19) (0.23)
Third or higher 0.50 0.36 -0.32
(0.28) (0.35) (0.38)
Short duration marriage 0.13 0.14 0.47* 1.49***
(0.21) (0.21) (0.19) (0.23)
Time since marriage began -0.02 -0.03* -0.01 0.06***
(0.01) (0.01) (0.01) (0.02)
Entered into polygamous marriage 0.35
(0.21) Status of marriage
Still married (ref.a
) --- --- ---
Divorced (ref.b
) 0.26 0.28 0.37* ---
(0.20) (0.19) (0.17)
Widowed 1.02* 0.96* 0.51* -0.51*
(0.43) (0.42) (0.25) (0.21)
Individual Characteristics
Age -0.04 -0.03 0.03 0.13***
(0.04) (0.03) (0.05) (0.04)
Age squared 0.00 0.00 -0.00 -0.00***
(0.00) (0.00) (0.00) (0.00)
Male -0.12
(0.20) Educational attainment
None (ref.) --- --- --- ---
Some primary -0.98*** -1.02*** -0.66*** -0.29
(0.27) (0.28) (0.18) (0.25)
Completed primary -1.28*** -1.32*** -0.81** -0.62
(0.31) (0.31) (0.28) (0.37)
Secondary -1.00** -1.06** -0.74* -1.16*
(0.34) (0.34) (0.32) (0.46)
Inconsistency score -0.11 -0.11 0.26* 0.18
(0.12) (0.12) (0.11) (0.13)
Survey Characteristics Length of survey time, 2010
Middle (ref.) --- --- --- ---
Short 0.51** 0.51** -0.16 -0.09
(0.19) (0.19) (0.16) (0.22)
Long 0.05 0.07 -0.08 0.03
Table 6: (Continued)
Start Date End Date
Men Women All
Model 1 Model 2 Model 3 Model 4
Degree of cooperation, 2006
Good (ref.) --- --- --- ---
Very good 0.25 0.24 0.11 -0.02
(0.16) (0.16) (0.14) (0.20)
Average or bad 0.00 -0.00 0.12 0.02
(0.24) (0.24) (0.19) (0.24)
Degree of cooperation, 2010
Good (ref.) --- --- --- ---
Very good -0.13 -0.14 -0.09 0.06
(0.17) (0.17) (0.17) (0.23)
Average or bad 0.04 0.05 0.31* -0.09
(0.18) (0.18) (0.15) (0.20)
Interviewer Characteristics, 2010
Female -0.08 -0.09 -0.10 0.19
(0.17) (0.17) (0.14) (0.19)
Ever-married 0.17 0.17 -0.06 -0.33
(0.16) (0.16) (0.14) (0.19)
Prior interviewing experience -0.40* -0.42* -0.02 -0.23
(0.18) (0.18) (0.16) (0.22)
Constant 1.63 1.49 -0.65 -3.65***
(0.90) (0.89) (0.93) (0.88)
Number of marriages 899 899 1,236 689
Pseudo R2
0.08 0.07 0.11 0.16
Note: Robust standard errors are in parentheses. Analysis is restricted to marriages that began before 2006.
a
Reference group for models of marriage start date inconsistencies.
b
Reference group for model of marriage end date inconsistencies. * p<0.05; ** p<0.01; *** p<0.001.
3.4 Marriage indicators: MLSFH vs. RMH
Table 7: Marriage indicators for men and women, 2006 MLSFH and RMH
Men Women
Variables 2006 RMH 2006 RMH
Age at first marriagea 22.2 22.0 17.8 17.7
(4.1) (4.2) (3.5) (3.3)
Number of times married
One 52.5 48.8 67.6 65.9
Two 30.6 31.4 24.4 24.5
Three or more 16.9 19.8 8.0 9.6
Number of times divorced
Zero 66.2 62.8 68.0 66.5
One 22.9 24.3 24.8 25.0
Two or more 10.9 13.0 7.2 8.4
Total 763 763 1174 1174
Note: Standard deviations are in parentheses.
a
The number of men and women with data on age at first marriage is 711 and 1,174, respectively.
4. Discussion
The present study examines the reliability of marriage histories collected as part of the Malawi Longitudinal Study of Families and Health. This study demonstrates that a substantial proportion of marriages are underreported and that marriage dates are often reported inconsistently. Regression analyses indicate that misreporting is not random. Several marriage, individual, survey, and interviewer characteristics are significantly associated with misreporting. Marriage indicators are also affected by misreporting.
interviewer characteristics affect misreporting by influencing how well respondents carry out the four steps of the survey response model.
Of the two types of misreporting, marriage omission has more serious implications for marriage analyses. As shown in previous studies, respondents are more likely to omit short or unsuccessful marriages than longer and continuing marriages (Boileau et al. 2009; Reniers 2008). Given that fewer marriages were reported in 2010 than in 2006, some respondents may have retrospectively altered their perceptions of previous unions, viewing them as relationships rather than marriages. In many parts of Sub-Saharan Africa marriage is perceived as a process composed of multiple stages, including the exchange of gifts, initiation of sexual relations, provision of bridewealth, and birth of the first child (Meekers 1992; van de Walle 1993). These stages differ greatly across and within countries (Dekker and Hoogeveen 2002). Whether certain unions are perceived as marriages may change over time, especially for unions that have ended (van de Walle 1993), and may occur more frequently in cases where bridewealth has not been fully paid or a child has not been produced.
The ‘fuzziness’ of marriage points to the need for interviewers to provide respondents with context-appropriate definitions of marriage so that the first step of the survey response model, comprehension, is carried out optimally. Many African societies recognize a variety of marriage forms, including free unions, consensual unions, customary marriages, and religious and civil marriages (Arnaldo 2004; Budlender et al. 2004). In the case of Malawi, marriage could be defined as any union that was perceived, at any point during its duration, as a marriage by the couple and members of the community, even if traditional or formal ceremonies were not completed. Marriages would include unions that ended before full payment of bridewealth (if part of the local custom) and those that did not produce any children.
about individuals with whom they have discussed HIV/AIDS. For each of these modules, respondents are to answer a series of questions about each individual. Furthermore, in the 2004, 2006, and 2008 waves, multiple survey teams visited respondents, resulting in more time spent being interviewed. Considering the time requirement for participating in the MLSFH, some respondents, especially those who have been interviewed in multiple waves, may conclude that there is little or no benefit to providing accurate responses. I assessed the possibility of panel conditioning by comparing the percentage of respondents who provided inconsistent reports of the number of times married across survey waves (Appendix Table A1). Results show that the percentage of respondents with inconsistent responses increased over time, evidence that panel conditioning might exist.
In order to increase the likelihood that respondents complete the retrieval and judgment steps in an optimal manner, survey designers should implement strategies that increase respondent motivation and reduce cognitive burden. For example, instructing interviewers to encourage respondents to remember events and praising them when they do have been shown to improve the quality of data collected (Cannell et al. 1981). Interviewers can also stress the importance of respondents in the data collection and research process. If respondents realize their potential influence, they may be more motivated to provide complete and accurate responses. In surveys where multiple kinds of histories (i.e., fertility, sexual partners, marriage) are collected, survey designers should consider utilizing event history calendars to collect this data. This format of data collection is less repetitive and makes it more difficult for respondents to intentionally omit events. Event history calendars have been used to capture major life events across various domains, including marriage, births, deaths, migration, employment, schooling, contraceptive use, and sexual relationships, and have been implemented in a wide range of contexts, including urban Kenya, Nepal, and the United States (Axinn, Pearce and Ghimire 1999; Freedman et al. 1988; Luke, Clark and Zulu 2011). Studies have shown that event history calendars result in more accurate reporting of events than standardized conventional survey instruments (Belli et al. 2007; Caspi et al. 1996; Glasner and van der Vaart 2009) and are useful for gathering event history information in populations who do not utilize calendar time, such as some ethnic groups in Nepal (Axinn, Pearce and Ghimire 1999).
surveys should focus on strengthening interviewing skills, especially those of first time interviewers, by improving the quality of interviewer training.
A side-by-side comparison of marriage indicators calculated using data from the 2006 MLSFH and RMH indicate that differences are small. The implications of misreporting likely differ depending on how researchers use marriage history data. Misreporting has the potential to affect regression analyses. For example, a study examining the relationship between ever being divorced and HIV status could lead to erroneous conclusions if marriages and, hence, divorces are underreported. Misreporting may not affect marriage indicators at the population level to a considerable degree, depending on the size and direction of individual misreports and the distribution of misreports in the population. This finding is consistent with previous studies demonstrating that inconsistent reporting of age at first sex and marriage does not always bias population-level indicators (Cremin et al. 2009; Wringe et al. 2009; Zaba et al. 2009).
This study contains several limitations. The process of matching marriages across survey waves may contain some error. As described in the Data section, spouse name was the primary criteria used to identify matches. Because respondents do not always report the same names across surveys (Adams et al. 2013), some marriages may not have been matched, resulting in overestimates of underreporting. Moreover, this study is only able to observe a subset of marriages that are misreported in marriage histories, specifically marriages that occurred before 2006 and were reported in only one of two survey waves. Some marriages may be consistently underreported, a type of misreporting that this study cannot capture. This type of misreporting could also bias marriage indicators. In all likelihood both the true number of marriages and divorces and the proportions ever divorced and widowed are higher. The effect on age at first marriage, however, depends on whether first marriages are consistently underreported. If this is the case, then age at first marriage is likely lower. All other marriages would not affect age at first marriage.
5. Conclusion
where marriage is more formal and stable, changing perceptions of marriage would probably result in the omission of some marriages. The proportion of marriages omitted, however, would likely be lower, as marital instability would be less common. Moreover, problems related to determining when marriages begin and end would probably still lead to misreporting. Levels of misreporting would likely be lower because respondents would have experienced fewer marriages, and would thus have fewer dates to recall. Finally, the results of this study could be applicable to other types of retrospectively collected data, such as sexual partner histories and cohabitation histories. In both cases, respondents may be more likely to omit short-lived relationships and misreport start and end dates of relationships.
6. Acknowledgements
References
Adams, J., Anglewicz, P., Helleringer, S., Manyamba, C., Mwera, J., Reniers, G., and Watkins, S.C. (2013). Identifying elusive and eager respondents in longitudinal data collection. [unpublished manuscript].
Amoateng, A.Y. and Heaton, T.B. (1989). The sociodemographic correlates of the timing of divorce in Ghana. Journal of Comparative Family Studies 20(1): 79– 96.
Anglewicz, P. (2012). Migration, marital change, and HIV infection in Malawi. Demography 49(1): 239–265. doi:10.1007/s13524-011-0072-x.
Anglewicz, P., Adams, J., Obare, F., Kohler, H.-P., and Watkins, S. (2009). The Malawi Diffusion and Ideational Change Project 2004-06: Data collection, data quality, and analysis of attrition. Demographic Research 20(21): 503–539.
doi:10.4054/DemRes.2009.20.21.
Anglewicz, P. and Reniers, G. (2014). HIV status, gender, and marriage dynamics among adults in rural Malawi. Studies in Family Planning 45(4): 415–428.
doi:10.1111/j.1728-4465.2014.00005.x.
Arnaldo, C. (2004). Ethnicity and marriage patterns in Mozambique. African Population Studies 19(1): 143–164.
Auriat, N. (1991). Who forgets? An analysis of memory effects in a retrospective survey on migration history. European Journal of Population 7(4): 311–342.
doi:10.1007/BF01796872.
Auriat, N. (1993). “My wife knows best" A comparison of event dating accuracy between the wife, the husband, the couple, and the Belgium population register. Public Opinion Quarterly 57(2): 165. doi:10.1086/269364.
Axinn, W.G. (1991). The influence of interviewer sex on responses to sensitive questions in Nepal. Social Science Research 20(3): 303–318. doi:10.1016/0049-089X(91)90009-R.
Becker, S., Feyisetan, K., and Makinwa-Adebusoye, P. (1995). The effect of the sex of interviewers on the quality of data in a Nigerian family planning questionnaire. Studies in Family Planning 26(4): 233–240. doi:10.2307/2137848.
Belli, R.F., Smith, L.M., Andreski, P.M., and Agrawal, S. (2007). Methodological comparisons between CATI event history calendar and standardized conventional questionnaire instruments. Public Opinion Quarterly 71(4): 603– 622. doi:10.1093/poq/nfm045.
Bignami-Van, S. (2003). Are we measuring what we want to measure? Individual consistency in survey response in rural Malawi. Demographic Research S1(3): 77−108. doi:10.4054/DemRes.2003.S1.3.
Boileau, C., Clark, S., Bignami-Van Assche, S., Poulin, M., Reniers, G., Watkins, S.C., Kohler, H.P., and Heymann, S.J. (2009). Sexual and marital trajectories and HIV infection among ever-married women in rural Malawi. Sexually Transmitted Infections 85: i27–i33. doi:10.1136/sti.2008.033969.
Borrini, G., Dallora, P., Dellasala, S., Marinelli, L., and Spinnler, H. (1989). Autobiographical memory: Sensitivity to age and education of a standardized inquiry. Psychological Medicine 19(1): 215–224. doi:10.1017/S0033291700 011181.
Brandon, A. (1990). Marriage dissolution, remarriage and childbearing in West Africa: A comparative study of Cote d'Ivoire, Ghana and Nigeria. [PhD Thesis]. Philadelphia: University of Pennsylvania, Graduate Group in Demography. Budlender, D., Chobokoane, N., and Simelane, S. (2004). Marriage patterns in South
Africa: methodological and substantive issues. Southern African Journal of Demography 9(1): 1–26.
Cannell, C.F., Miller, P.V., and Oksenberg, L. (1981). Research on interviewing techniques. Sociological Methodology 12: 389–437. doi:10.2307/270748.
Caspi, A., Moffitt, T.E., Thornton, A., Freedman, D., Amell, J.W., Harrington, H., Smeijers, J., and Silva, P.A. (1996). The life history calendar: A research and clinical assessment method for collecting retrospective event-history data. International Journal of Methods in Psychiatric Research 6(2): 101–114.
doi:10.1002/(SICI)1234-988X(199607)6:2<101::AID-MPR156>3.3.CO;2-E.
Clark, S. and Brauner-Otto, S. (2015). Divorce in sub-Saharan Africa: Are unions becoming less stable? Population and Development Review 41(4): 583–605.
doi:10.1111/j.1728-4457.2015.00086.x.
Courgeau, D. (1992). Impact of response errors on event history analysis. Population: An English Selection 4: 97–110.
Cremin, I., Mushati, P., Hallett, T., Mupambireyi, Z., Nyamukapa, C., Garnett, G., and Gregson, S. (2009). Measuring trends in age at first sex and age at marriage in Manicaland, Zimbabwe. Sexually Transmitted Infections 85(Suppl 1): i34–i40.
doi:10.1136/sti.2008.033431.
Crowder, R.G. (1976). Principles of learning and memory. New York: Psycology Press Dare, O. and Cleland, J.G. (1994). Reliability and validity of survey data on sexual
behaviour. Health transition review: the cultural, social, and behavioural determinants of health 4: 93.
Dekker, M. and Hoogeveen, H. (2002). Bride wealth and household security in rural Zimbabwe. Journal of African Economies 11(1): 114–145. doi:10.1093/jae/ 11.1.114.
Dykema, J. and Schaeffer, N.C. (2000). Events, instruments, and reporting errors. American Sociological Review 65(4): 619–629. doi:10.2307/2657386.
Enel, C., Pison, G., and Lefebvre, M. (1994). Migration and marriage change: A case study of Mlomp, Joola village in southern Senegal. In: Bledsoe, C. and Pison, G. (eds.). Nuptiality in Sub-Saharan Africa: Contemporary anthropological and demographic perspectives. Oxford: Clarendon Press: 92–116.
Fedor, T.M., Kohler, H.P., and Behrman, J.R. (2015). The impact of married individuals learning HIV status in Malawi: Divorce, number of sexual partners, condom use with spouses. Demography 52: 259–280. doi:10.1007/s13524-014-0364-z.
Freedman, D., Arland, T., Camburn, D., Alwin, D., and Young-DeMarco, L. (1988). The life history calendar: A technique for collecting retrospective data. Sociological Methodology 18: 37–68. doi:10.2307/271044.
Gage-Brandon, A.J. (1992). The polygyny-divorce relationship: A case study of Nigeria. Journal of Marriage and the Family 52(2): 285–292. doi:10.2307/ 353060.
Glasner, T. and van der Vaart, W. (2009). Applications of calendar instruments in social surveys: a review. Quality & Quantity 43(3): 333–349. doi:10.1007/s11135-007-9129-8.
Glisky, E. (2007). Changes in Cognitive Function in Human Agin. In: Riddle, D. (ed.). Brain Aging: Models, Methods, and Mechanisms. Boca Raton (FL): CRC Press.
doi:10.1201/9781420005523.sec1.
Grant, M. and Yeatman, S. (2014). The impact of family transitions on child fostering in rural Malawi. Demography 51(1). doi:10.1007/s13524-013-0239-8.
Grysman, A. and Hudson, J.A. (2013). Gender differences in autobiographical memory: Developmental and methodological considerations. Developmental Review 33(3): 239–272. doi:10.1016/j.dr.2013.07.004.
Halpern-Manners, A., Warren, J.R., and Torche, F. (2014). Panel conditioning in the General Social Survey. Sociological Methods & Research: doi:10.1177/004912 4114532445.
Hampshire, K. and Randall, S. (2000). Pastoralists, agropastoralists and migrants: Interactions between fertility and mobility in northern Burkina Faso. Population Studies 54(3): 247–261. doi:10.1080/713779098.
Hayford, S.R. and Morgan, S.P. (2008). The quality of retrospective data on cohabitation. Demography 45(1): 129–141. doi:10.1353/dem.2008.0005.
Hertrich, V. (1998). Are men's and women's answers to be equally trusted? A dual collection of birth and marriage histories in a population in Mali. Population: An English Selection 10(2): 303–318.
Isiugo-Abanihe, U.C. (1998). Stability of marital unions and fertility in Nigeria. Journal of Biosocial Science 30(1): 33–41. doi:10.1017/S0021932098000339. Kaler, A. (2001). "Many divorces and many spinsters": Marriage as an invented
tradition in southern Malawi, 1946–1999. Journal of Family History 26(4): 529– 556. doi:10.1177/036319900102600405.
Kessler, R.C. and Wethington, E. (1991). The reliability of life event reports in a community survey. Psychological Medicine 21(3): 723–738. doi:10.1017/ S0033291700022364.
Krosnick, J.A. (1991). Response strategies for coping with the cognitive demands of attitude measures in surveys. Applied Cognitive Psychology 5(3): 213–236.
doi:10.1002/acp.2350050305.
Locoh, T. and Thiriat, M.-P. (1995). Divorce et remariage des femmes en Afrique de l'Ouest - Le cas du Togo. Population 50(1): 61–93.
Luke, N., Clark, S., and Zulu, E.M. (2011). The relationship history calendar: Improving the scope and quality of data on youth sexual behavior. Demography 48(3): 1151–1176. doi:10.1007/s13524-011-0051-2.
Mathiowetz, N.A. and Duncan, G.J. (1988). Out of work, out of mind: response errors in retrospective reports of unemployment. Journal of Business & Economic Statistics 6(2): 221–229.
Meekers, D. (1992). The process of marriage in African societies: A multiple indicator approach. Population and Development Review 18(1): 61–78. doi:10.2307/197 1859.
Mitchell, C. (2010). Are divorce studies trustworthy? The effects of survey nonresponse and response errors. Journal of Marriage and Family 72(4): 893–905.
doi:10.1111/j.1741-3737.2010.00737.x.
Mitchell, J.C. (1956). The Yao village: A study in the social structure of a Nyasaland tribe. Manchester: Manchester University Press.
Murphy, M. (2009). Where have all the children gone? Women's reports of more childlessness at older ages than when they were younger in a large-scale continuous household survey in Britain. Population Studies 63(2): 115–133.
doi:10.1080/00324720902917238.
Neisser, U. and Winograd, E. (1995). Remembering reconsidered: Ecological and traditional approaches to the study of memory. Cambridge :Cambridge University Press.
Neter, J. and Waksberg, J. (1964). A study of response errors in expenditures data from household interviews. Journal of the American Statistical Association 59(305): 18–55. doi:10.1080/01621459.1964.10480699.
Peters, H.E. (1988). Retrospective versus panel data in analyzing lifecycle events. Journal of Human Resources 23(4): 488–513. doi:10.2307/145810.
Ratcliffe, A.A., Hill, A.G., Harrington, D.P., and Walraven, G. (2002). Reporting of fertility events by men and women in rural Gambia. Demography 39(3): 573– 586. doi:10.1353/dem.2002.0031.
Reniers, G. (2003). Divorce and remarriage in rural Malawi. Demographic Research S1(Article 6): 175–206.
Reniers, G. (2008). Marital strategies for regulating exposure to HIV. Demography 45(2): 417–438. doi:10.1353/dem.0.0002.
Reniers, G. and Tfaily, R. (2008). Polygyny and HIV in Malawi. Demographic Research 19 (53): 1811–1830. doi:10.4054/DemRes.2008.19.53.
Schatz, E. (2002). Numbers and narratives: Making sense of gender and context in rural Malawi. [PhD Thesis]. Philadelphia: University of Pennsylvania, Graduate Group in Demography and Sociology.
Schwarz, N., Sudman, S., Brewer, W.F., Herrmann, D.J., Back, K.W., Ross, M., Buehler, R., Banaji, M.R., Hardin, C., and Salovey, P. (1994). Autobiographical memory and the validity of retrospective reports. New York: Springer-Verlag.
doi:10.1007/978-1-4612-2624-6.
Smith, J.P. and Thomas, D. (2003). Remembrances of things past: test-retest reliability of retrospective migration histories. Journal of the Royal Statistical Society Series a-Statistics in Society 166: 23–49.
Sudman, S., Bradburn, N.M., and Schwarz, N. (1996). Thinking about answers: The application of cognitive processes to survey methodology. San Francisco: Jossey-Bass Publishers.
Takyi, B.K. and Gyimah, S.O. (2007). Matrilineal family ties and marital dissolution in Ghana. Journal of Family Issues 28(5): 682–705. doi:10.1177/0192513X070 280050401.
Tew, M. (1950). Peoples of the Lake Nyasa region. London: International African Institute.
Thompson, C.P., Skowronski, J.J., Larsen, S.F., and Betz, A.L. (1996). Autobiographical memory: Remembering what and remembering when. Mahwah, NJ: Erlbaum Associates.
Tourangeau, R., Rips, L.J., and Rasinski, K. (2000). The psychology of survey response Cambridge: Cambridge University Press. doi:10.1017/CBO9780511819322. Tourangeau, R. and Yan, T. (2007). Sensitive questions in surveys. Psychological
Bulletin 133(5): 859–883. doi:10.1037/0033-2909.133.5.859.
van de Walle, E. (1968). Marriage in African censuses and inquiries. In: Brass, W., Coale, A.J., Demeny, P., Heisel, D.F., Lorimer, F., Romaniul, A., and Walle, E.V.D. (eds.). The Demography of tropical Africa. Princeton, New Jersey: Princeton University Press: 183–238.
van de Walle, E. (1993). Recent trends in marriage ages. In: Foote, K.A., Hill, K.H., and Martin, L.G. (eds.). Demographic change in sub-Saharan Africa. Washington, D.C.: National Academy Press: 117–152.
van de Walle, E. and Meekers, D. (1994). Marriage drinks and kola nuts. In: Bledsoe, C. and Pison, G. (eds.). Nuptiality in Sub-Saharan Africa: Contemporary anthropological and demographic perspectives. Oxford: Clarendon Press: 57– 73.
Warren, J.R. and Halpern-Manners, A. (2012). Panel conditioning in longitudinal social science surveys. Sociological Methods & Research 41(4): 491–534. doi:10.1177/ 0049124112460374.
Wringe, A., Cremin, I., Todd, J., McGrath, N., Kasamba, I., Herbst, K., Mushore, P., Żaba, B., and Slaymaker, E. (2009). Comparative assessment of the quality of age-at-event reporting in three HIV cohort studies in sub-Saharan Africa. Sexually Transmitted Infections 85(Suppl 1): i56–i63. doi:10.1136/sti.2008. 033423.
Appendix
1. Summary of data quality studies on the MLSFH
Table A1: Percentage of respondents who had inconsistent reports of number of times married across survey waves, 2001-2010 MLSFH
Men
Later Survey
2004 2006 2008 2010 Total
Earlier Survey
2001 7.9 7.9 14.6*** 15.5*** 342
2004 - 11.3 15.8** 17.7*** 469
2006 - - 14.3 15.7 642
2008 - - - 11.4 642
Women
Later Survey
2004 2006 2008 2010 Total
Earlier Survey
2001 10.0 10.4 15.5*** 15.5*** 653
2004 - 7.6 11.2*** 12.0*** 792
2006 - - 11.1 10.6 1010
2008 - - - 9.4 1011
Note: Inconsistent reports of number of times married refers to instances where a higher number of marriages were reported in the earlier survey than in the later survey. Significance levels are relative to the earliest survey wave in which the respondent participated.