Chapter
4
Fair Game Review
Evaluate the expression when x = 1
2 and y = −5.
1. −2xy 2. 4x2 − 3y
3. 10
12 + 4
y
x 4. 11x − 8
(
x − y)
Evaluate the expression when a = −9 and b = −4.
5. 3ab 6. a2 − 2
(
b +12)
7.
2
4
3 − 7
b
b 8.
(
)
2
7b + 5 ab − 6
Chapter
4
Fair Game Review
(continued)Use the graph to answer the question.
10. Write the ordered pair that corresponds to Point D.
11. Write the ordered pair that corresponds to Point H.
12. Which point is located at
(
−2, 4 ?)
13. Which point is located at
( )
0, 3 ?14. Which point(s) are located in Quadrant IV?
15. Which point(s) are located in Quadrant III?
Plot the point.
16.
(
3, 1−)
17.
( )
0, 218.
(
− −5, 4)
19.
(
−1, 0)
20.
(
−2, 3)
x y
3 4 5
2 1
−3
−4
−5
−2
4 5 3 2 1 O
−2
−3
−4
−5
A
B C
D
E F
G
H
x y
3 4 5
2 1
−3
−4
−5
−2
4 5 3 2 1 O
−2
−3
−4
4.1
Graphing Linear Equations
For use with Activity 4.1Essential Question
How can you recognize a linear equation? How can you draw its graph?Work with a partner.
a. Use the equation 1 1
2
= +
y x
to complete the table. (Choose any two x-values and find the y-values).
b. Write the two ordered pairs given by the table. These are called
solution points of the equation.
c. PRECISION Plot the two solution points. Draw a line exactly through the two points.
d. Find a different point on the line. Check that this point is a solution
point of the equation 1 1
2
= +
y x .
e. LOGIC Do you think it is true that any point on the line is a solution point
of the equation 1 1
2
= +
y x ? Explain.
1 ACTIVITY: Graphing a Linear Equation
Solution Points
x
y = 1x + 1 2
x y
3 4 5 6
2 1
−3
−4
−5
−6
−2
4 5 6 3
2 1 O
−2
−3
−4
−5
4.1 Graphing Linear Equations(continued)
f. Choose five additional x-values for the table. (Choose positive and negative
x-values.) Plot the five corresponding solution points on the previous page. Does each point lie on the line?
g. LOGIC Do you think it is true that any solution point of the equation 1
1 2
= +
y x is a point on the line? Explain.
h. Why do you think y = ax + b is called a linear equation?
Use a graphing calculator to graph y = 2x + 5.
a. Enter the equation = 2 + 5y x into your calculator.
b. Check the settings of the viewing window. The boundaries of the graph are set by the minimum and maximum x- and y-values. The numbers of units between the tick marks are set by the x- and
y-scales.
2 ACTIVITY: Using a Graphing Calculator
Solution Points
x
y = 1x + 1 2
4.1 Graphing Linear Equations(continued)
c. Graph = 2 + 5y x on your calculator.
d. Change the settings of the viewing window to match those shown. Compare the two graphs.
What Is Your Answer?
3. IN YOUR OWN WORDS How can you recognize a linear equation? How can you draw its graph? Write an equation that is linear. Write an equation that is not linear.
4. Use a graphing calculator to graph y=5x−12 in the standard viewing window.
a. Can you tell where the line crosses the x-axis? Can you tell where the line crosses the y-axis?
b. How can you adjust the viewing window so that you can determine where the line crosses the x- and y-axes?
5. CHOOSE TOOLS You want to graph y = 2.5x − 3.8. Would you graph it by hand or by using a graphing calculator? Why?
−10 10
−10 10
y= 2x+ 5
−6 2
−4 8
4.1
Practice
For use after Lesson 4.1Graph the linear equation. Use a graphing calculator to check your graph, if possible.
1. y = 4 2. 1
3
= −
y x
Solve for y. Then graph the equation. Use a graphing calculator to check your graph.
3. y + 2x = 3 4. 2y − 3x = 1
5. The equation y = 2x + 4 represents the cost y (in dollars) of renting a movie after x days of late charges.
a. Graph the equation.
b. Use the graph to determine how much it costs after 3 days of late charges. x
y
O x
y
O
x y
O x
y
O
x y
4.2
Slope of a Line
For use with Activity 4.2Essential Question
How can the slope of a line be used to describe the line?Slope is the rate of change between any two points on a line. It is the measure of the steepness of the line.
To find the slope of a line, find the ratio of the change in
y (vertical change) to the change in x (horizontal change).
change in slope
change in
= y
x
Work with a partner. Find the slope of each line using two methods.
Method 1: Use the two black points.
Method 2: Use the two gray points.
Do you get the same slope using each method? Why do you think this happens?
a. b.
c. d.
1 ACTIVITY: Finding the Slope of a Line
x y 3 4 5 6 7 2 1
4 5 6 7 3
2 1
2
Slope =
3 3 2 x y 3 4 2 1 −3 −4 −2 4 2
−2−1
−3
−4 2
1 x y 3 1 −3 −4 −2 2 1 3
−2−1
−3 −4 6 −6 x y 3 4 2 −3 −4 −5 −2 3 2 1
−3 −1
−4
−5
−6 x
y 3 4 2 1 −3 −4 −5 −2
3 4 5 2
1
−3−2−1
4.2 Slope of a Line (continued)
Work with a partner. Use the figure shown.
a. ΔABCis a right triangle formed by drawing a horizontal line segment from point A and a vertical line segment from point B. Use this method to draw another right triangle,
.
DEF
Δ
b. What can you conclude about ΔABC and ΔDEF? Justify your conclusion.
c. For each triangle, find the ratio of the length of the vertical side to the length of the horizontal side. What do these ratios represent?
d. What can you conclude about the slope between any two points on the line?
Work with a partner.
a. Draw two lines with slope 3.
4 One line passes through
(
−4, 1 ,)
and the other line passes through( )
4, 0 . What do you notice about the two lines?2 ACTIVITY: Using Similar Triangles
3 ACTIVITY: Drawing Lines with Given Slopes
x y
3 4 5 6 7 8 9 10 11
2 1
4 5 6 7 8 9 10 11 12 13 14 15 16 3
2 1
A(3, 2)
B(6, 4)
D(9, 6)
E(15, 10)
C(6, 2)
x y
3 4
2 1
−3
−4
−5
−2
3 4 5 2
1
−3−2−1
4.2 Slope of a Line (continued)
b. Draw two lines with slope 4. 3
− One line
passes through
( )
2, 1 , and the other line passes through(
− −1, 1 .)
What do you notice about the two lines?c. CONJECTURE Make a conjecture about two different nonvertical lines in the same plane that have the same slope.
d. Graph one line from part (a) and one line from part (b) in the same coordinate plane. Describe the angle formed by the two lines. What do you notice about the product of the slopes of the two lines?
e. REPEATED REASONING Repeat part (d) for the two lines you did not choose. Based on your results, make a conjecture about two lines in the same plane whose slopes have a product of 1.−
What Is Your Answer?
4. IN YOUR OWN WORDS How can you use the slope of a line to describe the line? x y 3 4 2 1 −3 −4 −5 −2
3 4 5 2
1
−3−2−1
−4 x y 3 4 2 1 −3 −4 −5 −2
3 4 5 2
1
−3−2−1
−4 x y 3 4 2 1 −3 −4 −5 −2
3 4 5 2
1
−3−2−1
4.2
Practice
For use after Lesson 4.2Find the slope of the line.
1. 2.
3. 4.
5. Which set of stairs is more difficult to climb? Explain. x
y
1
−2 O 2 3
−6 3 6 9
−9
(−1, 3)
(2, 9) x
y
1
−2
−3 O 2 3
−5
−6
−3
−2
−4
(−3, −2)
(3, −6)
x y
3 5
2 1
3 2 1
−3−2−1
(−2, 4) (2, 4)
x y
3 2 1
3 2 1
−3−2
(−1, 2)
(−1, −3)
6 in. 10 in.
8 in. 12 in.
Practice
For use after Extension 4.2
Extension
4.2
Which lines are parallel? How do you know?
1. 2.
Are the given lines parallel? Explain your reasoning.
3. y = 2, 4y = − 4. x = 3, 3y = −
5. Is the quadrilateral a parallelogram? Justify your answer.
x y 3 4 1 −2 4 5 2 1
−3 −1
−4
R
B
G
(−1, 1)
(−4, −4)
(2, 1)
(0, −4)
(2, −2)
(5, 3) x y 3 4 5 2 1 −3 −4 −5 −6 −2
3 4 5 2
1
−3−2
−5
B
R
G
(−4, 5)
(−1, 3)
(−5, −4)
(−2, −6)
(4, −5)
(5, 5) x y 3 4 1 −3 −4 −2 3 4 2 1
−3 −1
−4
−5
−6
A B
E x t e n si o n
4.2 Practice (continued)
Which lines are perpendicular? How do you know?
6. 7.
Are the given lines perpendicular? Explain your reasoning.
8. x = 0, 3y = 9. 2, 1
2
y = y = −
10. Is the parallelogram a rectangle? Justify your answer.
x y 3 4 2 1 −3 −2 3 4 2 −3 −4 B R G
(−2, 1)
(−2, −2)
(−4, −1)
(4, 4)
(3, 0)
(1, −2) x
y 3 4 5 2 1
3 4 5 2
1
−3−2−1
−4
B R
G
(−1, −5)
(−2, −2)
(1, 5) (3, 5)
(2, 1)
(2, −3)
x y 3 4 1 −4 3 4 2 1
−3 −1
−4
M
L
J
4.3
Graphing Proportional Relationships
For use with Activity 4.3Essential Question
How can you describe the graph of the equation y = mx?Work with a partner. Tell whether x and y are in a proportional relationship. Explain your reasoning.
a. b.
c. d.
e. f.
1 ACTIVITY: Identifying Proportional Relationships
0 0 20 40 60 30 10 50 70 2 4 Hours worked Money Ear nings (dollars) 6
1 3 5 7 x
y 0 0 10 20 30 15 5 25 35 2 4 Time (seconds) Helicopter H eight (meters) 6
1 3 5 7 x
y 0 0 40 80 120 60 20 100 140 2 4
Number of tickets
Tickets
C
ost (dollars)
6
1 3 5 7 x
y 0 0 10 20 30 15 5 25 35 2 4
Number of pizzas
Pizzas
C
ost (dollars)
6
1 3 5 7 x
y
Laps, x 1 2 3 4
Time
(seconds), y 90 200 325 480
Cups of Sugar, x 1
2 1 1 1
2 2
4.3 Graphing Proportional Relationships (continued)
Work with a partner. Use only the proportional relationships in Activity 1 to do the following.
• Find the slope of the line.
• Find the value of y for the ordered pair
( )
1, .yWhat do you notice? What does the value of y represent?
Work with a partner. Let
(
x y,)
represent anypoint on the graph of a proportional relationship.
a. Explain why the two triangles are similar.
b. Because the triangles are similar, the corresponding side lengths are proportional. Use the vertical and horizontal side lengths to complete the steps below.
1
m
= Ratios of side lengths
m
= Simplify.
m
= • Multiplication Property of Equality
What does the final equation represent?
2 ACTIVITY: Analyzing Proportional Relationships
3 ACTIVITY: Deriving an Equation
y
x (0, 0)
(1, m)
4.3 Graphing Proportional Relationships (continued)
c. Use your result in part (b) to write an equation that represents each proportional relationship in Activity 1.
What Is Your Answer?
4. IN YOUR OWN WORDS How can you describe the graph of the equation ?
y = mx How does the value of m affect the graph of the equation?
5. Give a real-life example of two quantities that are in a proportional relationship. Write an equation that represents the relationship and sketch its graph.
x y
3 4
2 1
−3
−4
−5
−2
3 4 5 2
1
−3−2−1
4.3
Practice
For use after Lesson 4.31. The amount p (in dollars) that you earn by working h hours is represented by the equation p = 9 .h Graph the equation and interpret the slope.
2. The cost c (in dollars) to rent a bicycle is proportional to the number h of hours that you rent the bicycle. It costs $20 to rent the bicycle for 4 hours.
a. Write an equation that represents the situation.
b. Interpret the slope.
c. How much does it cost to rent the bicycle for 6 hours? 1 2 3 4 5 6
0 7 8 9 x
y
40 50 60 70 80 90
4.4
Graphing Linear Equations in Slope-Intercept Form
For use with Activity 4.4Essential Question
How can you describe the graph of the equation= +
y mx b?
Work with a partner.
• Graph each equation.
• Find the slope of each line.
• Find the point where each line crosses the y-axis.
• Complete the table.
1 ACTIVITY: Analyzing Graphs of Lines
Equation Slope of Graph Point of Intersection with y-axis
a. 1 1
2
= − +
y x
b. y = − +x 2
c. y = − −x 2
d. 1 1
2
= +
y x
e. y = x + 2
f. y = x − 2
g. 1 1
2
= −
y x
h. 1 1
2
= − −
y x
4.4 Graphing Linear Equations in Slope-Intercept Form(continued)
Work with a partner.
a. Look at the graph of each equation in Activity 1. Do any of the graphs represent a proportional relationship? Explain.
b. For a nonproportional linear relationship, the graph crosses the y-axis at some point
( )
0, ,b where b does not equal 0. Let( )
x y, represent any other point on the graph. You can use the formula for slope to write the equation for a nonproportional linear relationship.Use the graph to complete the steps.
2 1
2 1
y y m x x
− =
− Slope formula
y
m x
− =
− Substitute values.
m
= Simplify.
m
• = • Multiplication Property of Equality
y − = m • Simplify.
y = m + Addition Property of Equality
Equation Slope of Graph Point of Intersection with y-axis
j. y = 3x − 2
k. Do you notice any relationship between the slope of the graph and its equation? Between the point of intersection with the y-axis and its equation? Compare the results with those of other students in your class.
y
x
(0, b)
(x, y)
4.4 Graphing Linear Equations in Slope-Intercept Form (continued)
c. What do m and b represent in the equation?
What Is Your Answer?
3. IN YOUR OWN WORDS How can you describe the graph of the equation ?
= +
y mx b
a. How does the value of m affect the graph of the equation?
b. How does the value of b affect the graph of the equation?
c. Check your answers to parts (a) and (b) with three equations that are not in Activity 1.
4. LOGIC Why do you think y = mx + b is called the slope-intercept form
4.4
Practice
For use after Lesson 4.4Find the slope and y-intercept of the graph of the linear equation.
1. y = −3x + 9 2. 4 2
5
= −
y x 3. 6 + y = 8x
Graph the linear equation. Identify the x-intercept. Use a graphing calculator to check your answer.
4. 2 6
3
= +
y x 5. y −10 = −5x
6. The equation y = −90x +1440 represents the time (in minutes) left after
x games of a tournament.
a. Graph the equation.
b. Interpret the x-intercept and slope. x
y
O x
y
O
4.5
Graphing Linear Equations in Standard Form
For use with Activity 4.5Essential Question
How can you describe the graph of the equation + =ax by c?
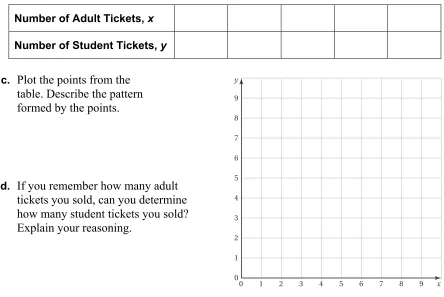
Work with a partner. You sold a total of $16 worth of tickets to a school concert. You lost track of how many of each type of ticket you sold.
adult • + student • =
a. Let x represent the number of adult tickets. Let y represent the number of student tickets. Write an equation that relates x and y.
b. Complete the table showing the different combinations of tickets you might have sold.
c. Plot the points from the table. Describe the pattern formed by the points.
d. If you remember how many adult tickets you sold, can you determine how many student tickets you sold? Explain your reasoning.
1 ACTIVITY: Using a Table to Plot Points
Number of Adult Tickets, x
Number of Student Tickets, y
y
3 4 5
2
1 8 9
7
6 Number of
adult tickets
4.5 Graphing Linear Equations in Standard Form(continued)
Work with a partner. You sold a total of $16 worth of cheese. You forgot how many pounds of each type of cheese you sold.
lb • + lb • =
a. Let x represent the number of pounds of swiss cheese. Let y represent the number of pounds of cheddar cheese. Write an equation that relates x and y.
b. Rewrite the equation in slope-intercept form. Then graph the equation.
2 ACTIVITY: Rewriting an Equation
Pounds of swiss
Pound of cheddar
x y
3 4 5
2
1
0 8 9
7
6
4 5
3 2 1
4.5 Graphing Linear Equations in Standard Form(continued)
c. You sold 2 pounds of cheddar cheese. How many pounds of swiss cheese did you sell?
d. Does the value x = 2.5make sense in the context of the problem? Explain.
What Is Your Answer?
3. IN YOUR OWN WORDS How can you describe the graph of the equation ?
+ = ax by c
4. Activities 1 and 2 show two different methods for graphing ax + by = c. Describe the two methods. Which method do you prefer? Explain.
5. Write a real-life problem that is similar to those shown in Activities 1 and 2.
4.5
Practice
For use after Lesson 4.5Write the linear equation in slope-intercept form.
1. 2x − y = 7 2. 1 2
4x + y = −7 3. 3x − 5y = −20
Graph the linear equation using intercepts. Use a graphing calculator to check your graph.
4. 2x − 3y = 12 5. x + 9y = −27
6. You go shopping and buy x shirts for $12 and y jeans for $28. The total spent is $84.
a. Write an equation in standard form that models how much money you spent.
b. Graph the equation and interpret the intercepts. x
y
O x
y
O
x y
4.6
Writing Equations in Slope-Intercept Form
For use with Activity 4.6Essential Question
How can you write an equation of a line when you are given the slope and y-intercept of the line?Work with a partner.
• Find the slope of each line.
• Find the y-intercept of each line.
• Write an equation for each line.
• What do the three lines have in common?
a. b.
c. d.
1 ACTIVITY: Writing Equations of Lines
2
1 4 5 6 x
y −1 −2 −4 −5 −6 2 3 5 6 7 −3 −4 −5 −1 3
1 4 5 6x
y −1 −3 −4 −5 −6 2 1 3 5 6 −2 −5 −6 −1 2 3
1 4 5 6 x
y −1 −4 −5 −6 2 1 4 5 6 7 8 −3 −4 −2 −1 3
1 2 4 5 6x
4.6 Writing Equations in Slope-Intercept Form (continued)
Work with a partner.
• Find the area of each parallelogram.
• Write an equation that represents each side of each parallelogram.
a. b.
Work with a partner. The graph shows a trip taken by a car, where t is the time (in hours) and y is the distance (in miles) from Phoenix.
a. Find the y-intercept of the graph. What does it represent?
2 ACTIVITY: Describing a Parallelogram
3 ACTIVITY: Interpreting the Slope and the y-Intercept
3
1 2 4 5 6x
y
−3−2−1
−4
−5
−6
2 1 3 5 6
−3
−4
−1 1 2 3 4 5 x
y
−3−2
−4
−6
−7
2 1 3 4 5 6
−3
−2
−4
−1
2 4 6
0 8 10 12t
200 300 400 500
100
0
Time (hours)
Distance (miles)
y
4.6 Writing Equations in Slope-Intercept Form (continued)
b. Find the slope of the graph. What does it represent?
c. How long did the trip last?
d. How far from Phoenix was the car at the end of the trip?
e. Write an equation that represents the graph.
What Is Your Answer?
4. IN YOUR OWN WORDS How can you write an equation of a line when you are given the slope and the y-intercept of the line? Give an example that is different from those in Activities 1, 2, and 3.
4.6
Practice
For use after Lesson 4.6Write an equation of the line in slope-intercept form.
1. 2.
3. 4.
Write an equation of the line that passes through the points.
5.
( ) (
3, 8 , −2, 8)
6.( ) (
4, 3 , 6, 3−)
7.(
−1, 0 ,) (
−5, 0)
8. You organize a garage sale. You have $30 at the beginning of the sale. You earn an average of $20 per hour. Write an equation that represents the amount of money y you have after x hours.
x y
1
−2
−3 O 2 3 8
10 12
2 4 (0, 7)
(1, 9)
x y
1
−2
−3 O 2 3 2
4 6 8
(2, 7)
(−1, −8)
x y
1
−2
−3
−4 2 3
−2
−4
−8
−10
−12
(−5, −1)
(3, −9)
x y
1 2 3 4 5
−2
−4
−6
−8
−10
−12
(4, −8)
4.7
Writing Equations in Point-Slope Form
For use with Activity 4.7Essential Question
How can you write an equation of a line when you are given the slope and a point on the line?Work with a partner.
• Sketch the line that has the given slope and passes through the given point.
• Find the y-intercept of the line.
• Write an equation of the line.
a. m = −2 b. 1
3 = m c. 2 3 = −
m d. 5
2
=
m
1 ACTIVITY: Writing Equations of Lines
2
1 4 5 6 x
y
−1
−2
−4−3 3
−5 −6 2 3 5 1 4 6 7 8 −3 −4 −2 −1 2
1 4 5 6 7x
y
−1
−2
−4−3 3
−5 2 3 5 1 4 6 −3 −4 −5 −6 −2 −1 2
1 4 5 6 7 x
y
−1
−2
−4−3 3
−5 2 3 5 1 4 6 −3 −4 −5 −2 −1 2
1 4 5 6x
y
−1
−2
−4−3 3
4.7 Writing Equations in Point-Slope Form (continued)
Work with a partner.
a. Draw a nonvertical line that passes through the point
(
x y1, .1)
b. Plot another point on your line. Label this point as
( )
x y, . This pointrepresents any other point on the line.
c. Label the rise and run of the line through the points
(
x y1, 1)
and( )
x y, .d. The rise can be written as y − y1. The run can be written as x − x1.
Explain why this is true.
e. Write an equation for the slope m of the line using the expressions from part (d).
f. Multiply each side of the equation by the expression in the denominator. Write your result. What does this result represent?
2 ACTIVITY: Deriving an Equation
y
x O
4.7 Writing Equations in Point-Slope Form (continued)
Work with a partner.
For 4 months, you saved $25 a month. You now have $175 in your savings account.
• Draw a graph that shows the balance in your account after t months.
• Use your result from Activity 2 to write an equation that represents the balance A after t months.
What Is Your Answer?
4. Redo Activity 1 using the equation you found in Activity 2. Compare the results. What do you notice?
5. Why do you think y − y1 = m x
(
− x1)
is called the point-slope form ofthe equation of a line? Why do you think this is important?
6. IN YOUR OWN WORDS How can you write an equation of a line when you are given the slope and a point on the line? Give an example that is different from those in Activity 1.
3 ACTIVITY: Writing an Equation
2 4 6
0 1 3 5 7 8 9 t
100 150 200 225 250
50 75 125 175
25 0
Time (months)
Balance (dollars)
A
4.7
Practice
For use after Lesson 4.7Write in point-slope form an equation of the line that passes through the given point that has the given slope.
1. m = −3; 4,
(
− 6)
2. 4; 3, 1(
)
3m = − −
Write in slope-intercept form an equation of the line that passes through the given points.
3.
(
−3, 0 , 2, 3) (
−)
4.(
−6, 10 , 6, 10) (
−)
5. The total cost for bowling includes the fee for shoe rental plus a fee per game. The cost of each game increases the price by $4. After 3 games, the total cost with shoe rental is $14.
a. Write an equation to represent the total cost y to rent shoes and bowl
x games.