O
RIGINAL
A
RTICLES
In South Africa HIV/AIDS is the top single cause of mortality,1-4 and
the Free State province (FS) has the third highest HIV prevalence of the nine provinces, estimated to be 12.6% in 2008.5 There are few data
on outcomes of patients from first contact with ART programmes, as most studies only report mortality from initiation of ART and ignore pre-treatment deaths.6 However, one study reported that 87%
of deaths occurred in patients not on treatment.7 The Comprehensive
HIV and AIDS Management (CHAM) Programme in the FS started in May 2004 as part of the scale-up of access to antiretroviral treatment (ART) in resource-limited settings.8
Information on factors that influence whether an enrolled patient starts ART or dies before treatment, and the time spent waiting for ART, should inform policy aimed at reducing overall programme mortality. Although treatment programmes aim to start as many eligible patients as possible on treatment as quickly as possible,9
shortages of staff and facilities, time taken for adherence training and diagnosis and treatment of opportunistic infections contribute to delays in initiating ART.10-12
We report on patient outcomes, including the proportion of patients who started treatment and deaths before and on treatment, at 1 year after enrolment in the FS public treatment programme to assess management of patients. We examined differences in outcomes according to facility and patient level characteristics.
Methods
Setting and patients
All patients enrolled in the FS CHAM programme between May 2004 and December 2007 were included if a CD4 value was available. After testing HIV positive in any FS clinic, patients were referred to nurse-run assessment facilities for initial assessment of eligibility for treatment, which includes a CD4 cell count measurement. Patients with CD4 cell counts >200 cells/µl were asked to return for another assessment after 6 - 12 months, or earlier if they experienced problems.13 Patients with a CD4 cell count of ≤200
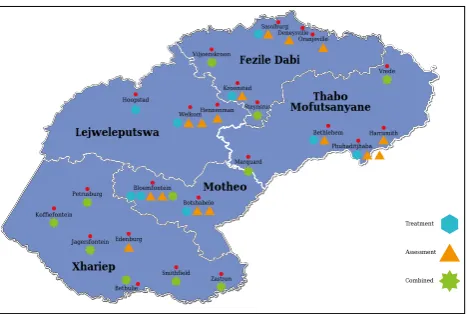
cells/µl, or with World Health Organization (WHO) disease stage IV (AIDS), were referred for treatment. Patients who start ART obtain monthly supplies of medication from assessment facilities and return to treatment facilities for review of their viral loads and repeat prescriptions 6-monthly. By the end of 2007, 30 clinics and 8 hospitals distributed over the 5 health districts of the FS were participating in the programme (Fig. 1). Two clinics were excluded because of delays in implementation of the electronic data collection system; of the remaining 28, 17 were assessment-only facilities and 11 were combined assessment and treatment facilities. Seven of the hospitals provide treatment for patients from assessment facilities, the 8th
Corresponding author: S M Ingle ([email protected]) Department of Social Medicine, University of Bristol, UK
Suzanne M Ingle, MSc Margaret May, PhD Jonathan A C Sterne, PhD
Knowledge Translation Unit, University of Cape Town Lung Institute, University of Cape Town
Kerry Uebel, MFamMed Venessa Timmerman, MSc
Knowledge Translation Unit, University of Cape Town Lung Institute, and Depart-ment of Medicine, University of Cape Town,
Lara Fairall, PhD
Free State Department of Health, Bloemfontein
Eduan Kotze, PhD
School of Medicine, Health Policy and Practice, University of East Anglia, Norwich, UK
Max Bachmann, PhD
Institute of Social and Preventive Medicine, University of Bern, Switzerland
Matthias Egger, MD
Differences in access and patient outcomes across antiretroviral
treatment clinics in the Free State province: A prospective
cohort study
Suzanne M Ingle, Margaret May, Kerry Uebel, Venessa Timmerman, Eduan Kotze, Max Bachmann, Jonathan A C Sterne, Matthias Egger, Lara Fairall, for the International epidemiologic Databases to Evaluate AIDS Southern Africa (IeDEA-SA)
Objective. To assess differences in access to antiretroviral treatment (ART) and patient outcomes across public sector treatment facilities in the Free State province, South Africa.
Design. Prospective cohort study with retrospective database linkage. We analysed data on patients enrolled in the treatment programme across 36 facilities between May 2004 and December 2007, and assessed percentage initiating ART and percentage dead at 1 year after enrolment. Multivariable logistic regression was used to estimate associations of facility-level and patient-level characteristics with both mortality and treatment status.
Results. Of 44 866 patients enrolled, 15 219 initiated treatment within 1 year; 8 778 died within 1 year, 7 286 before accessing ART. Outcomes at 1 year varied greatly across facilities and more variability was explained by facility-level factors than by patient-level factors. The odds of starting treatment within 1 year
improved over calendar time. Patients enrolled in facilities with treatment initiation available on site had higher odds of starting treatment and lower odds of death at 1 year compared with those enrolled in facilities that did not offer treatment initiation. Patients were less likely to start treatment if they were male, severely immunosuppressed (CD4 count ≤50 cells/µl), or underweight (<50 kg). Men were also more likely to die in the first year after enrolment.
Conclusions. Although increasing numbers of patients started ART between 2004 and 2007, many patients died before accessing ART. Patient outcomes could be improved by decentralisation of treatment services, fast-tracking the most immunodeficient patients and improving access, especially for men.
O
RIGINAL
A
RTICLES
Data collection
Routine clinical information on patients from clinician notes on standardised forms was entered into the FS electronic medical record (EMR) system by trained data capturers and downloaded and imported into a data warehouse weekly. During this time, Meditech SATM was gradually implemented as the EMR system across the
facilities.14 As each patient has a unique identifier within Meditech,
they can be tracked across facilities within the province. Mortality is ascertained by monthly linkage (using national identity numbers) with the national death register, which is estimated to capture more than 90% of adult deaths in South Africa.15 Patient demographic and
clinical characteristics extracted from Meditech included gender, age, weight and CD4 count nearest to enrolment and year of enrolment into the programme. The Meditech database was linked with the National Health Laboratory Services (NHLS) database to obtain CD4 measurements to ensure that data were as complete as possible. The FS Department of Health gave permission for the data to be analysed, and the Human Research Ethics Committee of the University of Cape Town approved the protocol. No individual patient consent was deemed necessary as data were collected routinely for the CHAM programme, and no patient identifiers were included in the extracts used for analyses.
Information was obtained from programme staff on the type of facility (assessment-only clinic, treatment hospital or combined assessment and treatment clinic), location (rural/peri-urban/urban), health district, and distance between the facility and the point of care for initiation of ART (in kilometres). Data on staffing levels were obtained from the FS Human Resources database and included patient load, number of staff per 1 000 patients and number of staff vacancies per 1 000 patients. Staff per patient was calculated as the mean number of staff in each clinic over the period April 2005 - September 2008 divided by total number of patients enrolled in that clinic.
Outcomes
Patients were followed up to 31 December 2008, and all patients therefore potentially had at least 1 year of follow-up time. The outcomes of interest were whether the patient had initiated treatment or died in the first year after enrolment.
Statistical analysis
We tabulated the characteristics of each facility and examined completeness of recording and variation in patient characteristics across facilities. We estimated median waiting times for treatment and mortality and assessed outcomes at 1 year after enrolment, by district, facility location, distance to ART initiation site and year of enrolment.
We used a mixed-effects logistic regression with random intercepts for facilities to estimate the odds of the patient starting treatment or dying within 1 year of enrolment, allowing for between-facility variability. Patient-level characteristics included in the model were gender, age, weight, CD4 count and year of enrolment. Year of enrolment was categorised as 2004/05, 2006 and 2007, as 2004 and 2005 were similar in terms of patient outcomes. Facility-level characteristics included in the model were staffing per 1 000 patients, location and distance to ART initiation site. Location was categorised as rural or urban/peri-urban and included in the model as a binary variable. We fitted a sequence of four models to the data to assess the variation explained by facility- and patient-level characteristics: (i) the null model with no covariates; (ii) including patient-level characteristics only; (iii) including facility-level characteristics only; and (iv) including both facility- and patient-level characteristics. We
examined the reduction in the standard deviation of the random effects distribution in each of these models.
Weight, age and CD4 count had missing values, which were imputed using the multivariate imputation by chained equations method in StataTM assuming that data were missing at random.16,17
The imputation model consisted of all variables in the analysis model, including outcomes of interest, time to outcomes and other recorded values of pre-treatment weight and CD4. Distributions of imputed data were comparable with observed data. Data were more likely to be missing in urban facilities and facilities where treatment was available on the same site. Given that we identified predictors of missingness, it is not plausible that data were missing completely at random (MCAR). It is not possible to distinguish whether data were missing at random (MAR) or missing not at random (MNAR), but the fact that predictors of missingness tended to be clinic rather than patient characteristics makes the MAR assumption underlying the multiple imputation analyses more plausible. We analysed 25 datasets in which missing values were replaced by imputed values. Point estimates and standard errors (SEs) were calculated using Rubin’s rules.18 Analyses
using imputed data are presented in the main paper and analyses restricted to complete case data are presented in Appendix 2.19 All
analyses were performed using Stata statistical software.20
Results
Table I shows the characteristics of each health district in the programme, and characteristics of each facility are given in Appendix 1 (Appendix 1 appears in the web version of this article only). The Motheo district includes mostly urban facilities and had the largest number of patients enrolled, while Xhariep had only rural facilities and had the smallest number of patients. Fig. 1 shows the location of each district within the province, together with the major towns in each district and locations of facilities.
Table II shows the variability in completeness of data according to district, location and distance from treatment site. Completeness of weight records was the most variable, ranging from 16.2% to 94.1% recorded; these records were most complete in urban facilities. Rural facilities had the most complete recording of CD4 counts and peri-urban facilities had the most complete ID recording. Facilities with ART initiation on site had the least complete CD4 records.
Between 2004 and 2007, 44 866 treatment-naïve patients aged 15 years or over were enrolled across the 36 facilities. As reported in Appendix 1, the median CD4 cell count at enrolment was 170 cells/ µl and ranged across facilities from 98 to 255 cells/µl. Sixty-seven per cent of patients were female (range 54 - 76% across facilities), mean age at enrolment was 36 years (range 33 - 38 years), and mean weight was 57.6 kg (range 54.7 - 59.7 kg). Data were missing for age in 22 patients (0.05%), for weight in 15 550 patients (34.7%) and for CD4 count in 11 650 patients (26.0%).
O
RIGINAL
A
RTICLES
Compared with assessment-only facilities, facilities where ART was available on site performed well in terms of proportion of patients who started treatment, except for those in Xhariep district, where there was no doctor for several months. Xhariep has only
Ta
[image:3.595.318.560.80.733.2]bl
e II. C
om pl et eness o f r ec or din g o f d
ata in the M
edi te ch d ata bas e o
f the F
re e S ta te AR T p ro gr amme b y dis tri ct , f aci lit y t yp e, a nd l oc at io n % of pa tien ts in eac h faci lit y w ith th e va ria ble re co rde d CD4 at enr olm en t W eig ht at enr olm en t S ou th A fr ic an na tio na l iden tit y num ber Va ria ble of in ter es t N M edi an IQ R R an ge M edi an I Q R Ra ng e M edi an IQ R Ra ng e O vera ll 44 866 72.1 62.5 - 87.6 37.1 - 98.2 71.1 58.4 - 81.8 16.2 - 94.1 81.1 69.6 - 87.9 39.5 - 94.2 Di str ic t (N o. of faci lit ies) Fe zi le D ab i (8) 5 644 69.2 53.2 - 85.8 37.1 - 98.2 66.4 59.4 - 73.7 49.5 - 88.9 86.8 78.0 - 89.7 67.7 - 92.4 Lejw elep utswa (5) 8 112 87.5 67.4 - 87.8 65.0 - 88.0 76.9 76.3 - 81.4 72.9 - 89.0 76.8 69.8 - 87.7 69.3 - 90.3 M ot he o (8) 15 477 70.5 54.7 - 74.5 48.7 - 79.1 42.0 23.4 - 78.0 16.2 - 85.9 82.8 65.1 - 91.1 39.5 - 92.2 Th ab o M of uts an ya ne (8) 12 108 66.9 57.7 - 80.1 46.1 - 90.0 61.5 57.8 - 79.1 40.7 - 85.2 81.9 70.8 - 84.7 39.8 - 94.2 Xh ar iep (7) 3 525 86.5 80.7 - 92.8 75.8 - 97.7 82.2 68.1 - 90.2 58.6 - 94.1 72.3 50.0 - 84.3 43.8 - 85.5 Lo ca tio n U rb an 3 394 55.0 46.1 - 65.0 37.1 - 71.4 79.6 76.3 - 85.2 58.2 - 85.9 81.9 76.8 - 88.6 76.3 - 92.2 Per i-urb an 31 477 71.7 67.0 - 79.1 48.7 - 90.0 59.6 31.3 - 77.0 16.2 - 89.0 86.2 79.0 - 90.5 39.5 - 94.2 Rura l 9 995 85.0 71.6 - 89.3 53.1 - 98.2 70.6 60.5 - 84.9 40.7 - 94.1 71.0 66.4 - 84.5 39.8 - 92.4 Di sta nce fro m tre at m en t si te Sa m e sit e 12 959 65.0 51.3 - 82.2 37.1 - 97.7 76.3 58.2 - 85.2 23.2 - 94.1 76.8 66.3 - 84.7 39.5 - 92.4 ≤ 8 km 12 653 76.9 69.5 - 87.8 67.0 - 90.0 69.3 23.6 - 78.5 16.2 - 89.0 88.2 79.0 - 90.5 75.2 - 90.9 9 - 15 km 13 558 72.1 71.6 - 79.9 71.2 - 87.5 69.7 59.6 - 77.2 56.7 - 77.5 89.7 86.2 - 93.0 84.7 - 94.2 >15 km 5 696 88.0 83.5 - 92.8 62.7 - 98.2 70.6 64.6 - 82.1 58.8 - 88.9 68.5 66.4 - 79.7 43.8 - 85.4 IQ
R = in
ter qu ar tile ra ng e. Ta bl
e I. H
ea lth dis tri ct cha rac te ris tics N o. of pa tien ts M edi an (ra ng e) of M edi an (ra ng e) of M edi an CD4 (ce lls/µl) enr ol le d by La rg e to w ns/ sta ff per 1 000 vac an cies per 1 000 at enr olm en t a nd ra ng e Di str ic t en d 2007 ci ties Faci lit ies pa tien ts enr ol le d pa tien ts enr ol le d ov er faci lit ies Fe zi le D ab i 5 644 Sa so lb ur g 2 tre at m en t faci lit ies (b ot h urb an) 10.89 (1.73 - 23.70) 5.00 (0.44 - 22.59) 154 (98.5 - 232) Kr oo ns tad 5 as ses sm en t faci lit ies (2 per i-urb an, 3 rura l) 1 co m bin ed faci lit y (r ura l) Lejw elep utswa 8 112 W el ko m 1 tre at m en t faci lit y (urb an) 2.04 (1.60 - 27.04) 0.51 (0.41 - 13.64) 166 (115 - 192) 3 as ses sm en t faci lit ies (2 urb an, 1 rura l) 1 co m bin ed faci lit y (r ura l) M ot he o 15 477 Blo emf on tein 1 sp eci ali st ref er ra l faci lit y (urb an) 6.59 (1.28 - 29.27) 1.46 (0.16 - 16.76) 188 (99 - 223) Bo tsh ab elo 2 tre at m en t faci lit ies (b ot h urb an) Th ab a N ch u 4 as ses sm en t faci lit ies (a ll urb an), 1 co m bin ed faci lit y (urb an) Th ab o 12 108 Ph ut hadi tjh ab a 2 tre at m en t faci lit ies (b ot h urb an) 6.37 (1.25 - 48.68) 1.95 (0.09 - 18.86) 151 (100 - 176) M of uts an ya ne H ar rismi th 4 as ses sm en t faci lit ies (a ll urb an) Bet hle hem 2 co m bin ed faci lit ies (b ot h rura l) Xh ar iep 3 525 Pr edo min an tly 6 rura l co m bin ed faci lit ies 8.27 (4.16 - 22.56) 9.96 (1.67 - 38.75) 211 (164.5 - 254.5) rura l a re a w ith 1 rura l a ss es sm en t faci lit y sm al l t ow ns A ss es sm en t faci lit
y = n
ur se-r un faci lit y p ro vidin g a ss es sm en t o f e lig ib ili ty f or AR T, p rep ara tio n f or t re at m en t a nd m on th ly co lle ct io n o f m edic at io n; t re at m en t faci lit
y = do
ct or -r un faci lit y p ro vidin g ini tia tio n o f t re at m en t, 6-m on th ly r ev ie w o f v ira l lo ad a
nd CD4 o
nce o n tre at m en t a nd r ep ea t p res cr ip tio ns; co m bin ed faci lit
y = n
[image:3.595.40.538.84.755.2]O
RIGINAL
A
RTICLES
rural clinics, and all but one of these were combined assessment and treatment facilities served by sessional doctors. Rural facilities had higher median CD4 counts at enrolment than peri-urban or urban facilities. Treatment hospitals had lower median CD4 counts, were mostly in urban areas and served sicker patients.
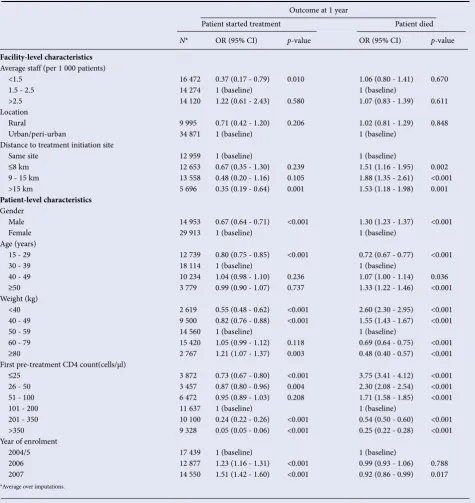
Table IV shows mutually adjusted odds ratios (ORs) for the association of facility- and patient-level characteristics with (i) starting treatment and (ii) death within 1 year of enrolment. As type of facility was strongly related to distance to ART initiation site, we were not able to assess the effect of both variables. Similarly, staffing levels, patient load and vacant posts were all strongly related to each other and independent effects of these variables cannot be assessed. We chose to include the distance to ART initiation site, and staffing levels, in our models. The odds of initiating treatment declined with increasing distance to ART initiation site (p-value for trend <0.001). Patients enrolled in facilities where ART was not available on the same site were more likely to die (OR 1.55, 95% confidence interval (CI) 1.28 - 1.89) compared with those enrolled in facilities where ART was available on site. Men were less likely to have started
treatment (OR 0.67, 95% CI 0.64 - 0.71) and were more likely to have died within 1 year of enrolment (OR 1.30, 95% CI 1.23 - 1.37). Compared with older patients, those aged 15 - 29 years had lower odds of starting treatment (OR 0.80, 95% CI 0.75 - 0.85). The odds of starting treatment increased with weight and with CD4 count up to the threshold of 200 cells/µl. The odds of dying within 1 year of enrolment increased with age and decreased with weight and CD4 count. Patients enrolled in 2007 were more likely to start treatment than those enrolling in earlier years.
[image:4.595.55.529.119.546.2]In the complete case analyses (N=24 510, reported in Appendix 2 – web version only), the association of staffing levels with the odds of starting treatment was attenuated and the associations of location, distance from ART initiation site and CD4 were strengthened. The association of year of enrolment with the odds of dying were strengthened. In the imputed data, weight had a median of 56.5 kg (interquartile range (IQR) 49.0 - 65.4), compared with 56 kg (IQR 49.0 - 64.0) in the complete case data. CD4 had a median of 173 cells/ µl (IQR 80 - 316) in imputed data compared with 170 cells/µl (IQR 76 - 318) in complete case data.
Table III. Patient outcomes at 1 year after enrolment by district, facility type, location and year of enrolment
N
Median
CD4 N (%) dead
N (%) dead before initiating
treatment
N (%) treated
Median waiting time to treatment
(mo.)
Median time to death for
those who died (mo.)
Overall 44 866 170 8 778 (19.6) 7 286 (16.2) 15 219 (33.9) 2.7 3.0
Patients who were eligible at enrolment
19 120 90 5 130 (26.8) 4 047 (21.2) 10 194 (53.3) 2.98 3.34
Patients who were not eligible at enrolment
14 096 350 878 (6.2) 799 (5.7) 1 704 (12.1) 3.54 5.55
Patients with unrecorded CD4
at enrolment 11 650 NA 2 770 (23.8) 2 440 (20.9) 3 321 (28.5) 1.49 1.79
District
Fezile Dabi 5 644 154 1 072 (19.0) 829 (14.7) 2 731 (48.4) 1.65 2.74
Lejweleputswa 8 112 166 1 642 (20.2) 1 287 (15.9) 3 210 (39.6) 2.74 3.27
Motheo 15 477 188 2 648 (17.1) 2 368 (15.3) 4 084 (26.4) 3.70 3.17
Thabo Mofutsanyane 12 108 151 2 813 (23.2) 2 322 (19.2) 4 191 (34.6) 2.38 2.94
Xhariep 3 525 211 603 (17.1) 480 (13.6) 1 003 (28.5) 2.84 3.17
Distance from treatment site
Same site 12 959 167 1 931 (14.9) 1 445 (11.2) 5 364 (41.4) 2.05 3.04
≤8 km 12 653 160 2 675 (21.1) 2 136 (16.9) 5 005 (39.6) 2.58 2.98
9 - 15 km 13 558 176 3 107 (22.9) 2 794 (20.6) 3 382 (24.9) 3.90 3.31
>15 km 5 696 186 1 065 (18.7) 911 (16.0) 1 468 (25.8) 2.61 2.61
Location
Urban 3 394 105 714 (21.0) 474 (14.0) 2 316 (68.2) 1.42 3.04
Peri-urban 31 477 173 6 338 (20.1) 5 431 (17.3) 9 702 (30.8) 3.07 3.17
Rural 9 995 188 1 726 (17.3) 1 381 (13.8) 3 201 (32.0) 2.28 2.74
Year of enrolment
2004 6 567 168 1 260 (19.2) 1 117 (17.0) 1 748 (26.6) 4.50 4.23
2005 10 872 184 2 273 (20.9) 2 005 (18.4) 2 708 (24.9) 3.83 3.47
2006 12 877 185 2 485 (19.3) 2 072 (16.1) 4 259 (33.1) 2.68 2.91
O
RIGINAL
A
RTICLES
Most of the variation across facilities in the odds of starting treatment was explained by facility- rather than patient-level characteristics. In the null model for starting treatment, facility level standard deviation (SD) was 1.58 (95% CI 1.33 - 2.08); this fell to 1.46 (95% CI 1.26 - 1.83) when patient-level characteristics were added and to 1.22 (95% CI 1.13 - 1.38) when facility-level characteristics were added. Including both patient- and facility-level variables resulted in an SD of 1.19 (95% CI 1.11 - 1.33).
Discussion
Main findings
We found a large amount of variation in odds of starting treatment across facilities and that differences in facility-level characteristics, rather than patient population, appear to drive this variation. Overall, by the end of 2008 around 34% of adults in the FS public sector programme received ART within 1 year of enrolment. The odds of starting treatment within 1 year increased between 2004 and 2007. However, large numbers of patients continue to die, most deaths (83%) occurring in patients not receiving ART. Patients who were eligible at enrolment and started ART waited a median of almost 3 months before starting treatment. Patients were less likely to start treatment within 1 year if they were male, severely immunosuppressed (CD4 ≤50 cells/µl), underweight (<50 kg), or sought care from a facility where ART initiation was more than 15 km away. Men and patients enrolled at facilities where treatment could not be initiated were also more likely to die in the first year after enrolment.
Strengths and limitations
This cohort is one of few studies to report on outcomes after enrolment in HIV care and not just from treatment initiation.9,21,22 A
strength is that it is a large cohort, representative of the HIV-infected population based on routinely collected data in the FS, where there is an established data capture system in place with mechanisms to follow up specific data queries in each clinic. National identity numbers have been documented for a large proportion of patients and regular linkage with the national death register means that ascertainment of death is fairly complete, even in those lost to the programme. In an earlier study using the FS data, only 20% of all deaths were recorded in the medical records,7 which emphasises the importance of linking
to the national death register.
A limitation is the large number of patients with missing weight and CD4 measurements. Although CD4 measurements were routinely taken on almost all patients, the database recorded them on only half of the patients in the cohort. This was improved to three-quarters of the patients by linkage using deterministic matching with records of blood results obtained from the NHLS.
Comparison with other studies
We are not aware of any studies that have been able to consider these outcomes across a range of facilities as we have done. Three South African studies showed high mortality rates in patients who had not initiated ART.9,21,23 Our finding that facilities with shorter
delays had lower mortality supports their conclusions that mortality could be reduced by minimising unnecessary in-programme delays in treatment initiation. A simulation exercise24 also concluded
that prioritising those with the lowest CD4 counts should improve outcomes. A cohort in Durban, which is well resourced by funding from non-governmental organisations,23 reported that 55% of
ART-eligible patients had started treatment within 1 year of diagnosis. The FS CHAM programme appears to perform similarly, as 53% of known ART-eligible patients started treatment within 1 year of enrolment. South Africa faces unique challenges in the roll-out of public sector ART.25 While most deaths were in untreated patients, our study
does not directly show the effect of ART in reducing mortality. A KwaZulu-Natal study estimates that standardised mortality rates declined with a rate ratio of 0.78 for women and 0.71 for men after scale-up of public sector ART.26
Generalisability
Our results may be generalisable to patients enrolling in care in similar settings, but cannot be applied to the population that is HIV-infected and not seeking care. We showed large differences in outcomes between facilities, which have implications for how HIV programmes are monitored. HIV prevalence is commonly monitored through sentinel surveillance, and specific research questions are often addressed using sentinel sites.27 However, sentinel sites may
over-represent urban settings and not be representative of the general population.28 Care should be taken when evaluating programmes
based on these data.
Policy implications
Patients who are assessed in one facility, but have to attend another to initiate ART, are disadvantaged compared with those who attend combined assessment and treatment facilities for all their care. This suggests that assessment-only facilities should be enabled to provide treatment or to ensure prompt referrals to treatment facilities. The referral process is one example of a barrier to accessing care. Drug-readiness training may be another barrier, as it can be protracted. Distance to appropriate facilities and transport costs may also be a barrier to access, particularly in rural locations. It is not always clinic practices that lead to delayed uptake of ART. In 2008, the FS had the lowest ART coverage of all South African provinces, estimated at 25.8%, which is probably due to the large proportion of eligible patients who are unaware of their HIV status.29 The 2005 Human
Sciences Research Council household survey found that only 36% of HIV-infected adults had ever been tested for HIV.30 Lack of
awareness of HIV status contributes to the delayed uptake of ART, and campaigns should continue to target people who are unaware of their status.
[image:5.595.66.300.97.254.2]Many of the sickest patients in our cohort died before they could initiate treatment, which demonstrates the need to fast-track the most at-risk patients. Fast-tracking would be easier to implement if treatment initiation were offered at assessment facilities, which is increasingly the case. This is being achieved through sessional visits by treatment facility doctors, and the STRETCH (Streamlining Tasks and Roles to Expand Treatment and Care for HIV) intervention currently under evaluation in a pragmatic randomised controlled trial in the FS. This intervention aims to optimise the use of scarce clinical skills by allowing designated nurses to re-prescribe and
Fig. 1. Map of the Free State province ART facilities
Kroonstad Viljoenskroon
Sasolburg Deneysville
Oranjeville
Hoopstad
WelkomHennenman
Botshabelo Bloemfontein
Marquard
Bethlehem Phuhaditjhaba
Harrismith Vrede
Koffiefontein
Jagersfontein Edenburg
Smithfield Zastron Petrusburg
Bethulie
Thabo Mofutsanyane
Motheo
Xhariep Lejweleputswa
Fezile Dabi
Treatment
Assessment
O
RIGINAL
A
RTICLES
initiate treatment in selected adults, thereby freeing up doctors to see sicker patients. The trial seeks to provide evidence that a triaged system, where nurses are supported to prescribe ART using clearly defined clinical protocols, will improve outcomes in this setting.31
Our findings support evidence that men are disadvantaged in terms of treatment access. Postulation that women may be disadvantaged in access to health care because of familial and child-rearing duties32
resulted in many services focusing on women. Services for women are more developed through the need for antenatal and child health clinics. However, health-seeking behaviours between genders are known to differ, with men less likely to access services they need.33
Stigma, work responsibilities and homophobia might also make it more difficult for men to accept an HIV diagnosis and to seek treatment.33 Studies from similar resource-poor settings emphasise
the need to encourage men to seek care earlier in HIV disease and to start ART, and suggest that health services to specifically address the needs of men should be developed.34-36
[image:6.595.54.530.134.638.2]This study was funded by the National Institute of Allergy and Infectious Diseases (NIAID, grant 1 U01 AI069924-01). Suzanne Ingle was funded by a UK Medical Research Council PhD Studentship and Margaret May was funded by UK Medical Research Council grant GO600599. The FS Table IV. Adjusted associations of facility- and patient-level characteristics with patient outcomes 1 year post enrolment, using 25 imputed datasets (odds ratios are from logistic regression analyses adjusted for all variables in the table and including facility as a random effect)
Outcome at 1 year
Patient started treatment Patient died
N* OR (95% CI) p-value OR (95% CI) p-value
Facility-level characteristics Average staff (per 1 000 patients)
<1.5 16 472 0.37 (0.17 - 0.79) 0.010 1.06 (0.80 - 1.41) 0.670
1.5 - 2.5 14 274 1 (baseline) 1 (baseline)
>2.5 14 120 1.22 (0.61 - 2.43) 0.580 1.07 (0.83 - 1.39) 0.611
Location
Rural 9 995 0.71 (0.42 - 1.20) 0.206 1.02 (0.81 - 1.29) 0.848
Urban/peri-urban 34 871 1 (baseline) 1 (baseline)
Distance to treatment initiation site
Same site 12 959 1 (baseline) 1 (baseline)
≤8 km 12 653 0.67 (0.35 - 1.30) 0.239 1.51 (1.16 - 1.95) 0.002
9 - 15 km 13 558 0.48 (0.20 - 1.16) 0.105 1.88 (1.35 - 2.61) <0.001
>15 km 5 696 0.35 (0.19 - 0.64) 0.001 1.53 (1.18 - 1.98) 0.001
Patient-level characteristics Gender
Male 14 953 0.67 (0.64 - 0.71) <0.001 1.30 (1.23 - 1.37) <0.001
Female 29 913 1 (baseline) 1 (baseline)
Age (years)
15 - 29 12 739 0.80 (0.75 - 0.85) <0.001 0.72 (0.67 - 0.77) <0.001
30 - 39 18 114 1 (baseline) 1 (baseline)
40 - 49 10 234 1.04 (0.98 - 1.10) 0.236 1.07 (1.00 - 1.14) 0.036
≥50 3 779 0.99 (0.90 - 1.07) 0.737 1.33 (1.22 - 1.46) <0.001
Weight (kg)
<40 2 619 0.55 (0.48 - 0.62) <0.001 2.60 (2.30 - 2.95) <0.001
40 - 49 9 500 0.82 (0.76 - 0.88) <0.001 1.55 (1.43 - 1.67) <0.001
50 - 59 14 560 1 (baseline) 1 (baseline)
60 - 79 15 420 1.05 (0.99 - 1.12) 0.118 0.69 (0.64 - 0.75) <0.001
≥80 2 767 1.21 (1.07 - 1.37) 0.003 0.48 (0.40 - 0.57) <0.001
First pre-treatment CD4 count(cells/μl)
≤25 3 872 0.73 (0.67 - 0.80) <0.001 3.75 (3.41 - 4.12) <0.001
26 - 50 3 457 0.87 (0.80 - 0.96) 0.004 2.30 (2.08 - 2.54) <0.001
51 - 100 6 472 0.95 (0.89 - 1.03) 0.208 1.71 (1.58 - 1.85) <0.001
101 - 200 11 637 1 (baseline) 1 (baseline)
201 - 350 10 100 0.24 (0.22 - 0.26) <0.001 0.54 (0.50 - 0.60) <0.001
>350 9 328 0.05 (0.05 - 0.06) <0.001 0.25 (0.22 - 0.28) <0.001
Year of enrolment
2004/5 17 439 1 (baseline) 1 (baseline)
2006 12 877 1.23 (1.16 - 1.31) <0.001 0.99 (0.93 - 1.06) 0.788
2007 14 550 1.51 (1.42 - 1.60) <0.001 0.92 (0.86 - 0.99) 0.017
O
RIGINAL
A
RTICLES
ART data warehouse was developed with the help of a research grant from the International Development Research Centre, Canada (IDRC-102411). The funders had no role in study design, data collection and analysis, decision to publish, or preparation of the manuscript. We also gratefully acknowledge the data capturers, nurses and doctors of the Free State programme, MediTech for assisting with data downloads to the warehouse, Terry Marshall and Sue Candy for assisting with the preparation of NHLS data, and Adrian Spoerri who helped with data linkage. We acknowledge all those who died without access to ART.
Conflict of interest. The authors declare that they have no conflict of
interest.
References
1. Bradshaw D, Groenewald P, Laubscher R, et al. Initial burden of disease estimates for South Africa, 2000. S Afr Med J 2003;93(9):682-688.
2. Bradshaw D, Schneider M, Dorrington R, Bourne DE, Laubscher R. South African cause-of-death profile in transition – 1996 and future trends. S Afr Med J 2002;92(8):618-623.
3. Bradshaw D, Nannan N, Laubscher R, et al. South African National Burden of Disease Study 2000: Estimates of Provincial Mortality. Cape Town: South African Medical Research Council, 2004.
4. Dorrington RE, Johnson LF, Bradshaw D, et al. The Demographic Impact of HIV/AIDS in South Africa. National and Provincial Indicators for 2006. Cape Town: Centre for Actuarial Research, South African Medical Research Council, and Actuarial Society of South Africa, 2006.
5. Shisana O, Rehle T, Simbayi LC, et al. South African National HIV Prevalence, Incidence, Behaviour and Communication Survey 2008: A Turning Tide among Teenagers? Cape Town: HSRC Press, 2009.
6. Lawn SD, Myer L, Wood R. Efficacy of antiretroviral therapy in resource-poor settings: are outcomes comparable to those in the developed world? Clin Infect Dis 2005;41(11):1683-1684.
7. Fairall LR, Bachmann MO, Louwagie GM, et al. Effectiveness of antiretroviral treatment in a South African program: a cohort study. Arch Intern Med 2008;168(1):86-93.
8. World Health Organization. Scaling Up Antiretroviral Therapy in Resource-Limited Settings: Treatment Guidelines for a Public Health Approach. Geneva: WHO, 2004. http://www.who.int/hiv/pub/prev_care/en/arvrevision2003en.pdf (accessed 8 September 2008).
9. Lawn SD, Myer L, Orrell C, Bekker LG, Wood R. Early mortality among adults accessing a community-based antiretroviral service in South Africa: implications for programme design. AIDS 2005;19(18):2141-2148.
10. Wouters E, Van DW, Van LF, van RD, Meulemans H. Public-sector ART in the Free State Province, South Africa: Community support as an important determinant of outcome. Soc Sci Med 2009;69(8):1177-1185.
11. Hirschhorn LR, Skolnik R. Making universal access a reality – what more do we need to know? J Infect Dis 2008;197(9):1223-1225.
12. Lawn SD, Harries AD, Anglaret X, Myer L, Wood R. Early mortality among adults accessing antiretroviral treatment programmes in sub-Saharan Africa. AIDS 2008;22(15):1897-1908.
13. South African National Department of Health. National Antiretroviral Treatment Guidelines. Cape Town: Jacana, 2004. http://www.doh.gov.za/docs/facts-f.html (accessed 12 October 2009).
14. Meditech Information Technology I. 2009. http://www.meditech.co.za/01000000. html (accessed 2 November 2009).
15. Statistics South Africa. Mortality and causes of death in South Africa, 2005: Findings from death notification. Statistical Release P0309 3 2007. http://www. statssa.gov.za/publications/P03093/P030932005.pdf (accessed 9 September 2008).
16. Royston P. Multiple imputation of missing values. The Stata Journal 2004;4(3): 227-241.
17. Royston P. Multiple imputation of missing values: update of ice. The Stata Journal 2005;5(4):527-536.
18. Rubin D. Multiple Imputation for Nonresponse in Surveys. New York: Wiley, 1987.
19. Sterne JA, White IR, Carlin JB, et al. Multiple imputation for missing data in epidemiological and clinical research: potential and pitfalls. BMJ 2009;338: b2393.
20. StataCorp LP. STATA Statistical Software: Release 11. College Station, TX: Stata Corp LP, 2009
21. Bassett IV, Wang B, Chetty S, et al. Loss to care and death before antiretroviral therapy in Durban, South Africa. J Acquir Immune Defic Syndr 2009;51(2):135-139.
22. Thai S, Koole O, Un P, et al. Five-year experience with scaling-up access to antiretroviral treatment in an HIV care programme in Cambodia. Trop Med Int Health 2009;14(9):1048-1058.
23. Bassett IV, Regan S, Chetty S, et al. Who starts ART in Durban, South Africa?... Not everyone who should. Presented at the 5th IAS Conference on HIV Pathogenesis, Treatment and Prevention, 19 - 22 July 2009, Cape Town. Abstract WEAD102.
24. Walensky RP, Wood R, Weinstein MC, et al. Scaling up antiretroviral therapy in South Africa: the impact of speed on survival. J Infect Dis 2008;197(9):1324-1332.
25. Ojikutu B, Jack C, Ramjee G. Provision of antiretroviral therapy in South Africa: unique challenges and remaining obstacles. J Infect Dis 2007;196(Suppl 3):S523-S527.
26. Herbst AJ, Cooke GS, Barnighausen T, KanyKany A, Tanser F, Newell ML. Adult mortality and antiretroviral treatment roll-out in rural KwaZulu-Natal, South Africa. Bull World Health Organ 2009;87(10):754-762.
27. Boulle A, Bock P, Osler M, et al. Antiretroviral therapy and early mortality in South Africa. Bull World Health Organ 2008;86(9):678-687.
28. World Health Organization. Towards Universal Access: Scaling up Priority HIV/AIDS Interventions in the Health Sector. Geneva: WHO, 2008. http:// www.who.int/hiv/pub/Towards_Universal_Access_Report_2008.pdf (accessed 2 June 2008).
29. Adam MA, Johnson LF. Estimation of adult antiretroviral treatment coverage in South Africa. S Afr Med J 2009;99(9):661-667.
30. Shisana O, Rehle T, Simbayi LC, et al. South African National HIV Prevalence, HIV Incidence, Behaviours and Communication Survey, 2005. Cape Town: HSRC Press, 2005.
31. Fairall LR, Bachmann MO, Zwarenstein MF, et al. Streamlining tasks and roles to expand treatment and care for HIV: randomised controlled trial protocol. Trials J Infect Dis 2007;196(Suppl 3):S523-S527.
32. Box TL, Olsen M, Oddone EZ, Keitz SA. Healthcare access and utilization by patients infected with human immunodeficiency virus: does gender matter? J Womens Health (Larchmt) 2003;12(4):391-397.
33. Mane P, Aggleton P. Gender and HIV/AIDS: What do men have to do with it? Current Sociology J Infect Dis 2007;196(Suppl 3):S523-S527.
34. Braitstein P, Boulle A, Nash D, et al. Gender and the use of antiretroviral treatment in resource-constrained settings: findings from a multicenter collaboration. J Womens Health (Larchmt) 2008;17(1):47-55.
35. Cornell M, Myer L, Kaplan R, Bekker LG, Wood R. The impact of gender and income on survival and retention in a South African antiretroviral therapy programme. Trop Med Int Health 2009;14(7):722-731.
36. Keiser O, Anastos K, Schechter M, et al. Antiretroviral therapy in resource-limited settings 1996 to 2006: patient characteristics, treatment regimens and monitoring in sub-Saharan Africa, Asia and Latin America. Trop Med Int Health 2008;13(7):870-879.
O
RIGINAL
A
RTICLES
Appendix 1. Facility characteristics
Clinic N Location
Distance to treatment site
(km)
Hospital or clinic
Staff per 1 000 patients
Vacancies per 1 000 patients
Median CD4 at enrolment
District: Fezile Dabi
Boitumelo Hospital 531 U 0 H 12.17 8.69 120
Lesedi CHC 781 P 4 C 5.32 1.08 146
Metsimaholo Clinic 342 R 70 C 9.61 5.64 173
Metsimaholo Hospital 568 U 0 H 16.22 4.40 98.5
PAX CHC 185 R 0 C 23.70 22.59 180
Refengkgotso Clinic 656 R 40 C 4.46 3.34 226
Steynsrus Clinic 217 R 70 C 17.69 5.60 232
Zamdela CHC 2 364 P 8 C 1.73 0.44 146
District: Lejweleputswa
Bongani Hospital 448 U 0 H 23.97 11.43 115
Matjhabeng Clinic 2 693 P 7 C 1.80 0.41 167
Mohau Hospital 328 R 0 H 27.04 13.64 118
Phomolong Clinic 2 035 R 30 C 2.04 0.46 192
Welkom Clinic 2 608 P 15 C 1.60 0.51 165
District: Motheo
Batho Clinic 3 383 P 8 C 1.38 0.16 211
Botshabelo Hospital 267 P 0 H 29.27 16.76 123
Heidedal CHC 4 722 P 0 C 1.34 0.24 223
Jazzman Clinic 394 P 8 C 10.82 1.87 121.5
MUCPP CHC 4 593 P 12 C 1.28 0.20 217
National Hospital 794 U 0 H 11.57 5.31 99
Pelonomi Hospital 277 P 0 C 9.46 10.74 173
Winnie Mandela Clinic 1 047 P 5 C 3.72 1.06 129
District: Thabo Mofutsanyane
Bohlokong Clinic 1 991 P 4 C 1.94 0.58 143
Bophelong Clinic 339 R 0 C 13.82 17.08 176
Mamello CHC 392 R 0 C 12.29 16.65 114.5
Manapo Hospital 873 U 0 H 10.15 3.33 104
Namahadi Clinic 3 774 P 15 C 1.25 0.09 157
PhekolongHospital 180 U 0 H 48.68 18.86 100
Tseki Clinic 2 583 P 12 C 1.98 0.12 165
Tsiame B Clinic 1 976 R 25 C 2.60 0.16 163
District: Xhariep
Bophelong P’burg CHC 682 R 0 C 8.27 3.18 254.5
Ethembeni Clinic 905 R 0 C 4.16 4.55 209
Itumeleng Clinic 703 R 0 C 7.04 9.96 181
Lephoi Clinic 236 R 0 C 15.61 22.64 238.5
Matlakeng Clinic 182 R 0 C 22.56 38.75 164.5
Nelson Mandela Clinic 470 R 80 C 7.09 1.67 184
Thembalethu Clinic 347 R 0 C 12.89 18.81 214.5
Total 44 866 4.27 2.26 170
O
RIGINAL
A
RTICLES
Appendix 2. Adjusted associations of facility- and patient-level characteristics with patient outcomes at 1 year post enrolment: complete case analysis (N=24 510)
Outcome at 1 year
Patient started treatment Patient died
N OR (95% CI) p-value OR (95% CI) p-value
Facility-level characteristics Average staff (per 1 000 patients)
<1.5 8 068 0.41 (0.17 - 0.97) 0.044 0.84 (0.55 - 1.29) 0.429
1.5 - 2.5 9 211 1 (baseline) 1 (baseline)
>2.5 7 231 1.24 (0.57 - 2.71) 0.589 1.04 (0.69 - 1.56) 0.853
Location
Rural 6 245 0.57 (0.30 - 1.08) 0.084 1.30 (0.90 - 1.86) 0.158
Urban/peri-urban 18 265 1 (baseline) 1 (baseline)
Distance to treatment initiation site 0.001* 0.007*
Same site 5 513 1 (baseline) 1 (baseline)
≤8 km 7 660 0.54 (0.25 - 1.16) 0.113 1.63 (1.07 - 2.49) 0.023
9 - 15 km 7 803 0.42 (0.15 - 1.14) 0.088 2.10 (1.26 - 3.52) 0.005
>15 km 3 534 0.35 (0.18 - 0.71) 0.004 1.50 (1.03 - 2.18) 0.035
Patient-level characteristics Gender
Male 7 869 0.70 (0.66 - 0.75) <0.001 1.36 (1.26 - 1.47) <0.001
Female 16 641 1 (baseline) 1 (baseline)
Age (yrs)
15 - 29 6 789 0.88 (0.81 - 0.95) 0.001 0.75 (0.68 - 0.83) <0.001
30 - 39 10 045 1 (baseline) 1 (baseline)
40 - 49 5 706 1.05 (0.97 - 1.14) 0.236 1.11 (1.01 - 1.21) 0.023
≥50 1 970 1.02 (0.91 - 1.15) 0.718 1.42 (1.25 - 1.61) <0.001
Weight (kg)
<40 1 116 0.58 (0.50 - 0.67) <0.001 3.18 (2.75 - 3.68) <0.001
40 - 49 5 484 0.80 (0.74 - 0.87) <0.001 1.61 (1.47 - 1.76) <0.001
50 - 59 8 533 1 (baseline) 1 (baseline)
60 - 79 7 737 1.11 (1.02 - 1.20) 0.010 0.68 (0.61 - 0.74) <0.001
≥80 1 640 1.11 (0.96 - 1.28) 0.173 0.53 (0.43 - 0.66) <0.001
First pre-treatment CD4 count(cells/μl)
≤25 2 279 0.57 (0.51 - 0.63) <0.001 4.29 (3.84 - 4.80) <0.001
26 - 50 1 913 0.71 (0.64 - 0.80) <0.001 2.34 (2.07 - 2.64) <0.001
51 - 100 3 451 0.88 (0.81 - 0.97) 0.007 1.75 (1.58 - 1.94) <0.001
101 - 200 6 255 1 (baseline) 1 (baseline)
201 - 350 5 356 0.15 (0.14 - 0.16) <0.001 0.52 (0.46 - 0.59) <0.001
>350 5 256 0.02 (0.02 - 0.03) <0.001 0.26 (0.22 - 0.30) <0.001
Year of enrolment
2004/5 12 026 1 (baseline) 1 (baseline)
2006 7 131 1.20 (1.11 - 1.30) <0.001 0.95 (0.87 - 1.04) 0.250
2007 5 353 1.76 (1.61 - 1.92) <0.001 0.85 (0.76 - 0.94) 0.002
*p for trend.