CNRS, UMR 5187, Toulouse, France
Received: 8 October 2008 – Revised: 15 June 2009 – Accepted: 30 July 2009 – Published: 5 October 2009
Abstract. This paper presents examples of magnetosheath cavities in Cluster spacecraft observations. The cavities are accompanied by high energy particles in the magnetosheath and characterized by depressed magnetic fields and densi-ties. Flow speeds decrease and temperatures increase within the cavities. All magnetosheath parameters show increased variability within the cavities when the energetic particle flux is high. We predict outward motion of the magnetopause boundary in response to the decreases in the magnetosheath ram pressure caused by the high energy particles within the magnetosheath cavities. For our events, the magnetopause distance is predicted to be 30% larger during the times of high energy particle flux in the magnetosheath than that pre-dicted using concurrent upstream solar wind pressure obser-vations. Our events show no preference to occur for a partic-ular IMF direction or solar wind plasma condition.
Keywords. Magnetospheric physics (Energetic particles, precipitating; Magnetosheath; Solar wind-magnetosphere in-teractions)
1 Introduction
Energetic particles are important in the heliosphere and plan-etary systems as they play an important role in mass, mo-mentum, and energy transfer processes occurring within the Sun-Earth system. The physical mechanisms governing their energization help us to understand the nature of processes operating in a wide variety of contexts, including solar wind-planetary and heliospheric interactions. While the source of the energetic particles in the magnetosheath remains con-troversial, two of the most commonly expressed views in-volve the transmission of particles accelerated at the bow
Correspondence to: F. T. Katırcıo˘glu
shock into the magnetosheath (Gosling, 1983; Scholer, 1985; Crooker et al., 1981; Fuselier et al., 1991; Chang et al., 2000; Hayosh et al., 2004) and the leakage of the energetic parti-cles from the magnetosphere (Scholar et al., 1981; Baker et al., 1988; Sibeck et al., 1987a, b; Sibeck and McEntire, 1988; Kudela et al., 1992). Many studies of energetic particles in the magnetosheath have focus on determining their source and the nature of the energization processes. The main pur-pose of this paper is to study the effects of the high energy particles on the ambient magnetosheath plasma and magnetic field, and the possible consequences of the perturbations that they generate for the magnetosphere.
One of the first studies of the energetic particles in the magnetosheath was carried out by Formisano et al. (1973). Using 63 HEOS 1 magnetosheath passes, they characterized the state of the magnetosheath for several solar wind condi-tions in the presence and absence of upstream particles. The solar wind and IMF determine most of the magnetosheath’s variability. When the solar wind has a low Mach number and low plasma beta, the magnetosheath is magnetically less turbulent, the plasma parameters fluctuate and the magne-tosheath velocity distribution is Maxwellian without a high energy tail. For a high Mach number and beta solar wind in the absence of upstream waves, the velocity distribution becomes non-Maxwellian with a high energy tail. The mag-netic field shows irregular fluctuations in both magnitude and direction across the bow shock in this case. In the presence of upstream waves for any Mach number and beta, the velocity distribution remains Maxwellian with a high-energy tail. The oscillations in the magnetic field are caused by the upstream waves convected through and modified at the bow shock.
3766 F. T. Katırcıo˘glu et al.: Magnetosheath cavities: case studies using Cluster observations interplanetary magnetic field (IMF) lines connected to the
bow shock. They are seen most frequently upstream from the pre-noon bow shock during the high speed solar wind streams and have durations that typically range from 1 to 10 min. Backstreaming suprathermal ions were thermalized and energized at the bow shock. They supply the pressure needed to inflate the cavities. As the cavities expand, the ex-cavated densities and magnetic field strengths appear as en-hancements bounding the foreshock cavities. Results from these IMP-8 observations confirmed the predictions of ki-netic simulations by Thomas and Brecht (1988).
In a later study employing Wind observations, Sibeck et al. (2002) compared characteristics of the foreshock cavities with those of hot flow anomalies. They found flow veloc-ities within the foreshock cavveloc-ities nearly identical to those of ambient solar wind, large amplitude plasma and magnetic field variations with increased fluxes of suprathermal ions, no associations with abrupt IMF discontinuities and modest in-creases in ion temperature. These distinguish foreshock cav-ities from hot flow anomalies. Although the ion temperature measured by the cold plasma portion of the plasma instru-ment decreases in the cavity, presumably as a result of near-adiabatic expansion, the overall temperature calculated by in-corporating the suprathermal ions actually increases. This helped explain the previous IMP-8 findings indicating tem-perature decreases in foreshock cavities. The IMP 8 instru-ment MIT plasma detector only measures ions with energies below 7 keV and therefore misses the suprathermal ions that can make a significant contribution to the temperature and pressure within the cavities.
Omidi (personal communication) and Sibeck et al. (2008) recently simulated the interaction of the energetic particles with the ambient solar wind in the foreshock region using 2.5D global hybrid simulations and found events with fore-shock cavity characteristics. Omidi (personal communica-tion) inspected the response of the magnetosheath plasma and magnetic field to the presence of energetic particles. He predicted that the magnetic field decreases while the density increases in the presence of energetic particles, a prediction that has not yet been confirmed or denied by magnetosheath observations, one of the purposes of this study.
Sibeck et al.’s study (2001) raises questions concerning how foreshock cavities evolve and whether they are swept antisunward into the magnetosheath with the solar wind flow. Turk et al. (2003) used two years of Interball observations at 2 min time resolution to address this question. They in-spected magnetic field (MFI), plasma (CORALL), and pro-ton energy flux (DOC) data in the energy range from 22 keV to 28 keV. Their search did not reveal a clear relationship between high energy particle fluxes and magnetosheath pa-rameters. DOC frequently recorded prolonged particle flux enhancements but not isolated particle flux bursts. Neverthe-less, they identified three types of magnetosheath behavior in response to energetic particles. Depressed magnetic field strengths and densities accompanied enhanced energetic
par-ticle fluxes in one type, similar to foreshock cavities. How-ever, a second type exhibited enhanced densities and de-pressed magnetic fields. They concluded that a clear, definite relationship between energetic particles and magnetosheath parameters is hard to detect in Interball-1 data.
The present study employs Cluster observations in the magnetosheath to demonstrate clear and repeatable magne-tosheath magnetic field and density signatures in association with≥30 keV energetic ions. Section 2 describes the data and the event selection procedure while Sect. 3 presents our case examples and analysis. Section 4 compares our findings with the results of the earlier studies, especially those of fore-shock cavities, and gives a brief discussion. Finally, Sect. 5 summarizes the results of our study.
2 Data and event selection
The Cluster spacecraft are a tetragonal multi spacecraft sys-tem designed to study micro-scale structures in the Earth’s magnetic environment. The spacecraft have highly ellipti-cal orbits with perigees of∼4REand apogees of∼19.7RE.
RAPID (RAP) measures energetic electron and proton fluxes from 28 to 1500 keV (Wilken et al., 1997). We use RAPID observations of protons with energies≥30 keV and
>100 keV to search for particle flux bursts. We use Cluster Ion Spectrometer (CIS) ion spectrometer (R`eme et al., 2001) and Fluxgate Magnetometer (FGM) (Balogh et al., 1997) observations to study the concurrent magnetosheath plasma (density, velocity and temperature) and magnetic field struc-ture. To investigate the solar wind and IMF connection, ACE magnetic field (MFI, Smith et al., 1998) and solar wind plasma (SWE, McComas et al., 1998) data corresponding to our magnetosheath events were used. All data sets were ob-tained from CDAWeb.
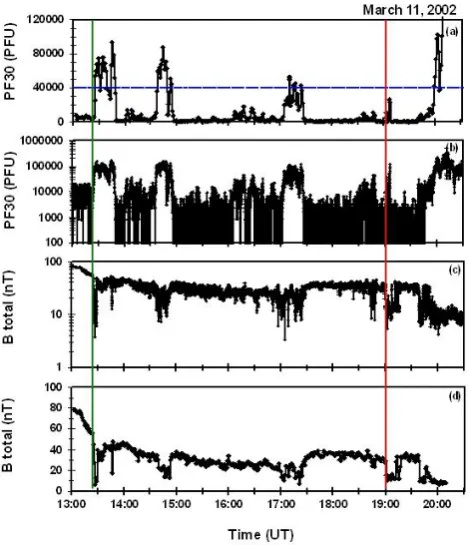
18 Figure 1 Fig. 1. Particle Flux (PF) and corresponding magnetic field
varia-tions in the magnetosheath for 11 March 2002 at different time res-olutions. The panels give (a) 1 min PF30 (particle flux for particles with energies≥30 keV), (b) 4 s PF30 in logarithmic scale, (c) 4 s magnetosheath magnetic field in logarithmic scale, and (d) 1 min magnetosheath magnetic field. Particle flux unit PFU stands for the Particle Flux Unit in #/cm2s str. Red and green lines show the bow shock and the magnetopause boundaries as Cluster travels the magnetosheath from the magnetosphere into the solar wind. The dashed blue line is the flux threshold level used in selecting flux burst events.
increases at energies above 100 keV (PF100). Since PF100 fluxes are usually much lower than those of PF30 and are also a part of those in PF30, we used PF30 at 1 min time resolution as our energetic particle flux indicator throughout this study.
Figure 1 shows flux bursts with different flux levels. Some of the flux bursts occur very close to or at the bow shock and magnetopause, and some are well within the magnetosheath. Based on our two year search, we established several criteria to identify flux burst events. We select an event as a flux burst event (FBE) if the flux increase within a time interval greater than 10 min is above 40 000 PFU. We constrain our analysis to flux bursts which are situated away from the bow shock and magnetopause boundary. Whether a flux burst event is near the bow shock or/and magnetopause was determined vi-sually by scanning and examining the magnetosheath cross-ings. The first in a series of flux bursts often occurs at the bow shock or magnetopause, and is therefore excluded. In panel (a), a dashed, black line at 40 000 PFU indicates the
19 Figure 2 Fig. 2. The expanded time interval from 14:20 UT to 15:10 in Fig. 1
for 11 March 2002 to illustrate large variations within the depressed magnetic field region. Panels show 4 s PF30 (a), and 4 s and 1 min magnetosheath magnetic field (b, c).
[image:3.595.50.285.62.335.2]3768 F. T. Katırcıo˘glu et al.: Magnetosheath cavities: case studies using Cluster observations
20
Figure 3
20
Figure 3
20
Figure 3
[image:4.595.127.470.62.408.2]20
Figure 3
Fig. 3. Trajectory of the Cluster spacecraft in magnetosheath in (a) xy-, (b) xz-, (c) yz-, and (d) xR- planes for (1) 2 January 2002, (2) 11
March 2002, and (3) 4 February 2003. The magnetopause and bow shock was drawn for average solar wind conditions.
data were missing. In 97 (26%) of the magnetosheath cross-ings, we saw neither a flux increase nor field or plasma sig-natures, i.e. mainly depressions in the magnetic field. The absence of flux bursts in Table 1 refers to the absence of flux burst events well within the magnetosheath, excluding those at the bow shock and/or magnetopause. Thus, this group also includes crossings in which flux burst events occurred at the bow shock and/or magnetopause if there was no flux burst event well within the magnetosheath. Take note that we did not find any flux burst event corresponding to group 2 in Ta-ble 1. In two years of data search, we always see either a depression and/or an increase in variability (especially in the magnetosheath magnetic field) corresponding to the high en-ergy particle bursts. One or the other, or both, of these sig-natures was present during each of 182 magnetosheath flux burst events.
Figure 2 illustrates the variability of the magnetic field is illustrated in detail. This figure shows an expanded view of the interval from 14:20 UT to 15:10 UT shown in Fig. 1. Fig-ure 2 represents a typical case. Panels in the figFig-ure show 4 s particle flux, 4 s and 1 min magnetic field data, Panels (b)
and (c) show highly variable magnetic field within a region in which the magnetic field strength was greatly depressed. Panel (a) shows that this region corresponds to enhanced en-ergetic particle fluxes. This example will be analyzed exten-sively in Sect. 3 along with two other cases but is briefly pre-sented here as part of the data selection procedure. To sum-marize, we identify two characteristic features in the mag-netosheath when high energy particles are present: (1) de-pressed magnetic field strengths and (2) the large amplitude variations. We call the regions of depressed magnetosheath magnetic field strength magnetosheath cavities.
3 Event description and analysis
21 Figure 4 Fig. 4. Plot of particle flux (PF30), magnetic field strength, density,
speed, and temperature data in the magnetosheath (from top to bot-tom) versus time for 2 January 2002. Red and green lines mark the bow shock, magnetopause and blue lines for the flux burst events studied.
solar wind conditions were added for reference (Roelof and Sibeck, 1993).
3.1 Case 1: 2 January 2002
Figure 4 presents observations for Case 1 on 2 January 2002. Panels from top to bottom show the particle flux (PF30), magnetic field, density, speed and temperature. For this case, the spacecraft was located atx=9.3RE,y=13RE and
z=−6.8RE. Multiple bow shock crossings and brief
magne-tosheath intervals are observed. Two vertical lines at 21:00 and 08:45 UT mark the magnetosheath boundaries between the last bow shock (red) and first magnetopause (green). One can easily identify 8 high energy flux events lasting from a few minutes (spikes) to several hours and with flux lev-els above 2×10⁴PFU within the magnetosheath. Although it varies from case to case, the background flux level in this case is seen to be 1×10⁴PFU. In Fig. 4, we selected
[image:5.595.309.544.68.296.2]22 Figure 5 Fig. 5. Plot of the expanded time interval for Burst 1 in Case 1.
Panels give (a) 4 s PF30, and (b, c) 4 s and 1 min magnetosheath magnetic field.
the three events with flux levels above 4×10⁴PFU starting at 00:20 UT, 01:48 UT and 04:00 UT as flux burst events. Dashed blue vertical lines indicate the time intervals for these flux burst events.
The first burst event from 00:20 UT to 01:10 UT is as-sociated with a well defined depression in magnetic field strength, density, and velocity and a slight increase in tem-perature. In this event, the magnetic field strength decreases by 70 % from its pre-event value. The density decreases by 50% and the speed decreases by 30%. The temperature rises by about 40%.
Fluctuation levels within the depressed magnetic field re-gion are another typical characteristic of magnetosheath cav-ities. We detected variations with relatively large amplitudes within all flux burst events. Figure 5 presents an expanded view of the time interval corresponding to Burst 1. Large amplitude fluctuations within the region of depressed mag-netic field strengths correspond to enhanced particle flux in-tervals. In this example, the magnetic field within the de-pressed region in panel (c) fluctuates with periods shorter than 10 s in panel (c). Although the fluctuations are smoothed in panel (d), the region of depressed magnetic field strengths and varying magnetic fields is still clear when compared with the pre- and post event magnetosheath fields.
3770 F. T. Katırcıo˘glu et al.: Magnetosheath cavities: case studies using Cluster observations
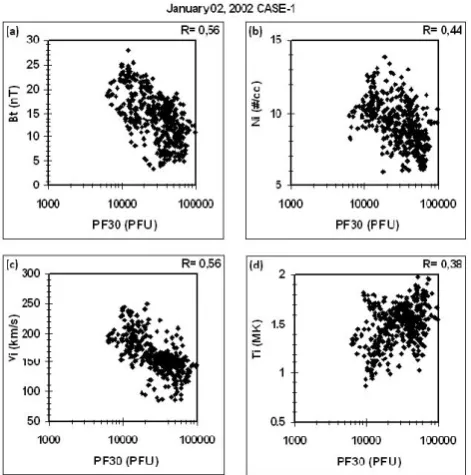
23 Figure 6 Fig. 6. Scatter plots of magnetosheath parameters from 00:00 UT
to 07:00 UT covering only the intervals for Bursts 1, 2, and 3. Horizontal axis is the energetic particle flux in PFU in logarithmic scale while vertical axis is (a) magnetic field strength, (b) density,
(c) speed, and (d) temperature.
less pronounced that magnetic field strength depressions. We have cases when we see the magnetic field depression with-out any significant decrease in density. In most cases, the density varies substantially within the event even if the den-sity depression is not very pronounced. These signatures are similar to those of foreshock cavity events reported by Sibeck et al. (2001). We can therefore consider them to be the mag-netosheath counterparts of foreshock cavities. Because of their similarities, we define regions of depressed magnetic field strength accompanied by high energetic particle flux levels as magnetosheath cavities.
The second and third burst events in Case 1 occurred from 01:48–02:17 and 04:00–07:00 UT, respectively. We found magnetic field and plasma signatures corresponding to these events too. Burst 3 differs from the first two bursts in that it lasts longer and contains several increases that can be con-sidered collectively as one flux burst event. The correspond-ing magnetic field depression is clear but not as sharp and pronounced as those for Bursts 1 and 2. High fluctuation lev-els again occur within the region of depressed magnetic field strengths. The magnetic field varies between 3 nT and 15 nT compared to the 20 nT pre-event magnetic field in the magne-tosheath. The density varies between 6 and 10 cm−3within the magnetosheath cavity, which is lower than the pre-event density of about 10 cm−3. The speed declines while temper-ature does not show an obvious increase.
24 Figure 7 Fig. 7. Plot of particle flux (PF30) and magnetosheath magnetic
field components,Bx,By, andBzand magnetic latitude (B2)from
top to bottom versus time for 2 January 2002. The vertical lines mark the bow shock (red) and magnetopause (green).
Figure 6 presents a scatter plot for the magnetic field, den-sity, speed, temperature versus PF30 ion flow over the time interval from 00:00 UT to 07:00 UT. The horizontal axis is the energetic particle flux in PFU on a logarithmic scale while the vertical axis is the magnetic field strength (a), den-sity (b), speed (c), and temperature (d). The correlation coef-ficients for these panels are found 0.56, 0.45, 0.56, and 0.38 for (a), (b), (c), and (d). The large scatter results from the highly fluctuating fields within the cavities. These scatter plots indicate that the magnetic field, density and speed de-crease while the temperature inde-creases as the energetic parti-cle flux increases.
Figure 7 presents the magnetic field components and the magnetic latitude in the magnetosheath to see if there is any specific feature corresponding to the depressed regions. PF30 is shown at the top of the figure for reference. Strong
BxandBycomponents downstream from the bow shock
[image:6.595.50.286.63.301.2] [image:6.595.310.543.67.373.2]25 Figure 8
Fig. 8. Scatter plots of magnetic latitude versus magnetic longitude (a) within Bursts 1 and 2, and (b) in the ambient magnetosheath
surrounding Burst 1 and Burst 2 for 2 January 2002.
between 0◦and 90◦, the field has a northward component and when it lies between 0◦and−90◦, the field has a southward component. It is hard to derive a meaningful clear pattern from these plots. Nevertheless, an examination of all burst events in all cases shows that the Bz component of the mag-netosheath field is predominantly northward within the de-pressed regions with lesserBy andBxcomponents on
aver-age. This is also clear in the magnetic latitude panel. Figure 8 is a scatter plot of magnetic longitude versus magnetic lati-tude for (a) the burst intervals and (b) the background mag-netosheath. Burst intervals include Bursts 1 and 2 while the magnetosheath intervals are the regions immediate neighbor-ing them. The plot shows that the magnetosheath field within the cavities is highly scattered while the background magne-tosheath appears to be more focused on specific directions.
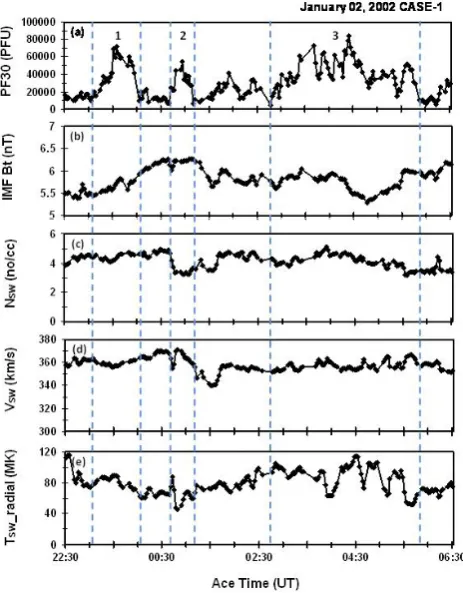
Figure 9 presents ACE IMF and solar wind plasma ob-servations for the interval from 23:30 UT to 07:30 UT corre-sponding to Fig. 4. Cluster data have been shifted to ACE times on a point-to-point basis using the ACE solar wind speed to account for convections time. ACE was located at
(x, y, z)=(241, 5, 19.5)REand the time delay between ACE
and Cluster in this example varies between 40 and 70 min. A plot of Cluster energetic particle flux data (PF30) was added to the top of each figure to guide inspection of features cor-responding to Cluster events. Times on the horizontal axis are those at ACE. From top to bottom, the panels in Fig. 9a shows PF30, IMF Btot, IMFBx, IMFBy, IMFBz, and IMF
clock angle while those panels in Fig. 9b give PF30, IMF Btot, solar wind density, speed, and radial temperature for ions. The IMF clock angle in Fig. 9a was calculated using
2=tan−1(By/Bz) and 0◦to +180◦indicates northward while
0◦to−180◦southward IMF.
In the panels of Fig. 9a, IMF does not show any particular feature that corresponds to the high energy particle flux in-creases in the magnetosheath. Within Burst 1, the solar wind speed, and density show a slight decrease. IMFBxand IMF
By do not change much at times corresponding to the
cav-ity intervals. IMFBzis either very close to zero or switches
to southward orientations. The IMFBxandBycomponents
corresponding to Burst 1 are about +5 nT and +2 nT, respec-tively while IMFBzdecreases to zero. The solar wind
den-sity and speed are∼5 cm−3and 360 km s−1. The solar wind temperature is ∼80 MK. Within Burst 2, IMF Bx is∼6 nT
and IMF By changes from−2 nT to +4 nT while IMF Bz
is southward with a maximum of 4 nT. Solar wind density, speed and temperature do not change much. The clock angle variation shows that the IMFBzis predominantly northward
within Burst 1 and southward in Burst 2. Within Burst 3, IMF
Bzswitches from north to south, staying southward on
aver-age. The solar wind density, speed and temperature change little at times corresponding to Burst 3. Considering that magnetosheath phenomena are controlled by the IMF and so-lar wind plasma, Fig. 9 does not reveal any particuso-lar feature or change in the IMF or solar wind plasma corresponding to the depressed regions in the magnetosheath. We have exam-ined scatter plots of IMF clock angle versus IMF longitude for (a) Bursts 1 and 2 excluding the magnetosheath intervals and (b) the magnetosheath intervals just around them (not shown here) but find that there is no specific field orienta-tion for this event. The field orientaorienta-tion when particles are present in (a) resembles that when they were absent.
To investigate the IMF dependence further, we calcu-lated the angle between the IMF and the bow shock nor-mal (2Bn)at the bow shock. To do this, we used the Kobel
and Fl¨uckiger (1994) model to trace magnetosheath magnetic field lines from the spacecraft position back to the parabolic bow shock location given by Cooling et al. (2001). We then calculated2Bnat this location. Figure 10 compares (a)
Clus-ter high energy particle flux observations with (b)2Bnversus
time. 2Bnvaries between 20◦and 45◦, suggesting a quasi
3772 F. T. Katırcıo˘glu et al.: Magnetosheath cavities: case studies using Cluster observations
26 Figure 9a Fig. 9a. ACE magnetic field data for 2 January 2002. From top
to bottom, panels give PF30, IMF strength, IMFBx, IMFBy, IMF
Bz, and IMF clock angle versus time. PF30 was added to guide
the features in Cluster data. Cluster data were shifted to the ACE times concurrently to account for the solar wind convection time from ACE to Cluster. Horizontal axis indicates the time at ACE spacecraft.
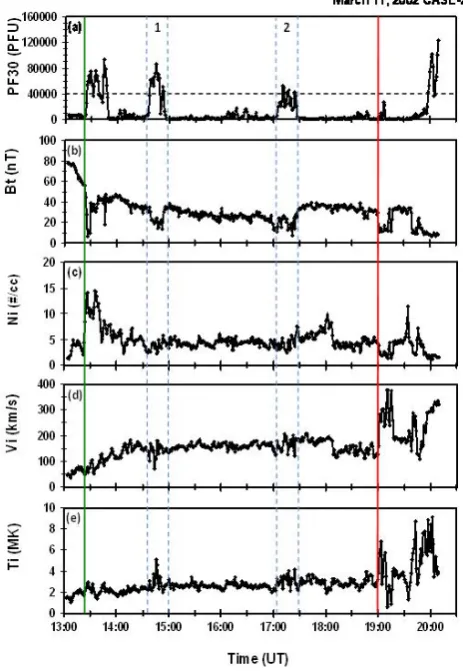
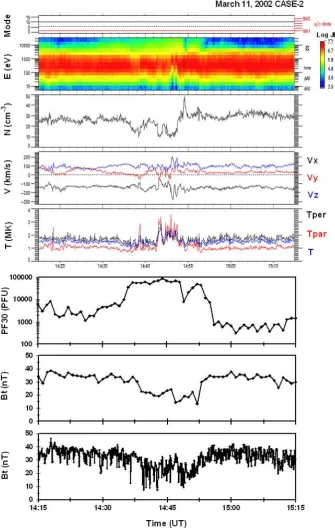
3.2 Case 2: 11 March 2002
Figure 11 presents Case 2, which occurred on 11 March 2002. The spacecraft crossed the magnetopause (green) at 13:25 UT and the bow shock (red) at 19:00 UT. As in Fig. 4, from top to bottom, the panels show 1 min energetic particle flux for PFU≥30 keV, the magnetic field, density, speed, and temperature. High flux levels around 90 000 PFU in PF30 are noticeable in this case. We selected the events lasting 30 min from 14:30 UT to 15:00 and from about 17:00 UT to 17:30 UT as our flux burst events, and excluded the burst event at 13:00 UT. This case was shown earlier in our dis-cussion of data selection.
When energetic particles occur, magnetic field strengths are depressed and variable. The magnetic field decreases from about 38 nT in the magnetosheath to 10 nT within
27 Figure 9b Fig. 9b. ACE solar wind plasma data for 2 January 2002. From
top to bottom, panels give (a) PF30, (b) IMF strength, (c) density,
(d) speed, and (e) proton temperature (radial) versus time. PF30
was added to guide the features in Cluster data. IMF strength was included for easy comparison. Cluster data were shifted to the ACE times concurrently to account for the solar wind convection time from ACE to Cluster. Horizontal axis indicates the time at ACE spacecraft.
Burst 1 and from 30 nT in the magnetosheath to 10 nT within Burst 2. Densities decrease from 5.5 to 2 cm−3 within Burst 1 and from 5 to 2 cm−3 in Burst 2. The speed de-creased from 150 to 70 km s−1 in Burst 1 and from about 150 to 100 km s−1 in Burst 2. The temperature increased from 2.2 to 5.5 MK in Burst 1 and from 2.8 to 5.1 MK in Burst 2. The magnetic field fluctuated greatly within the cav-ities (Fig. 3). High fluctuation levels are also seen in high resolution density, speed and temperature data (not shown). Figure 11 presents 1 min time resolution observations that also exhibit considerable variability. This is one of the clear-est cases showing decreases in the magnetic field strength, density, and speed, but increases in the temperature. The temperature increases within the cavities are particularly no-ticeable in Case 2.
[image:8.595.312.544.64.361.2] [image:8.595.52.284.66.417.2]28 Figure 10 Fig. 10. Theta Bn angle (2Bn) for Case 1 (2 January 2002)
includ-ing intervals for Bursts 1 and 2.
energy spectra for the interval from 14:15 UT to 15:15 UT covering Burst 1 in Fig. 11. From top to bottom, the pan-els show the instrument mode, energy (eV) (scale on left) – particle Flux (scale on right)-time ion spectrogram, den-sity (cm−3), speed (km s−1, left) and velocity components (right), and temperature (MK, in blue) versus time. At the bottom of this plot, we added our 1 min RAPID energetic particle, and 1 min and 4 s magnetic field data. The spec-tra indicate that most particles in the distribution have en-ergies from 40 to 2000 eV. Within the cavity from 14:38 to 14:52 UT, fluxes of suprathermal ions with energies above 10 keV are enhanced. We interpret this as the heating and the formation of a broader distribution. In three Cases presented in this study, we see temperature increases within the mag-netosheath cavities. Examination of spectral plots and dis-tribution functions for all our flux burst events shows some level of heating. Based on these spectral plots, we associate the slight temperature increases that occur within the cavities with the presence of high energy particles.
Plots for the magnetic field components and magnetic lon-gitude versus magnetic latitude angle provide no further en-lightening results on the structure of the magnetosheath cav-ities and are therefore not shown here. As in the previous case, we can only note thatBx andBz decrease while By
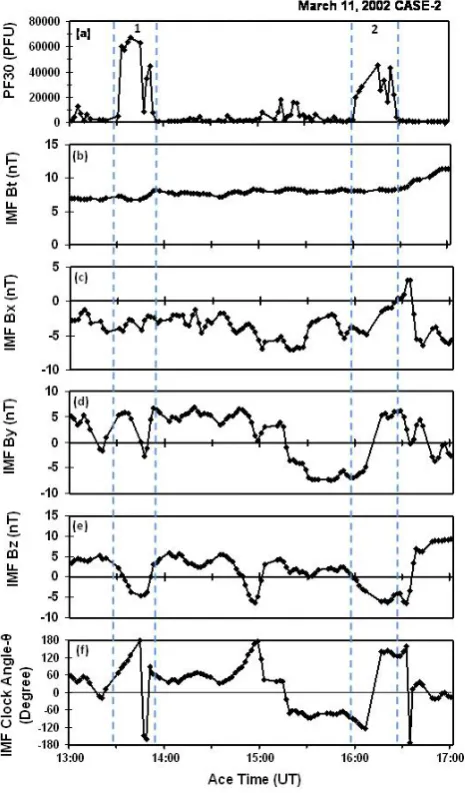
exhibits a substantial magnitude within the flux burst events, especially in Burst 2. Once again magnetic field directions are more variable during flux burst events than outside them. Figure 13 presents IMF and solar wind plasma variations for Case 2. The IMF Bx and Bz components correspond-ing to both bursts are negative while IMF By varies between +5 nT and−5 nT. IMF Bz changes from +5 nT in the mag-netosheath to−5 nT within Burst 1 and from +3 nT in the magnetosheath to −5 nT in Burst 2. The solar wind
den-29 Figure 11 Fig. 11. From top to bottom, panels give particle flux (PF30),
mag-netosheath magnetic field strength, density, speed, and temperature data versus time for 11 March 2002. Red and green lines denote the bow shock and magnetopause while blue lines show intervals of the burst events studied.
sity decreases from 11 to 8 cm−3during Burst 1, the speed from 375 to 300 km s−1, and the temperature rises from∼2 to∼4 MK. A plot of the IMF clock angle versus the IMF magnetic longitude (not shown) does not show any particu-lar direction favored for the burst intervals. Calculations of
2Bn for Case 2 (not shown) give values between 40◦ and
60◦for the event but∼20◦outside the event intervals in the magnetosheath.
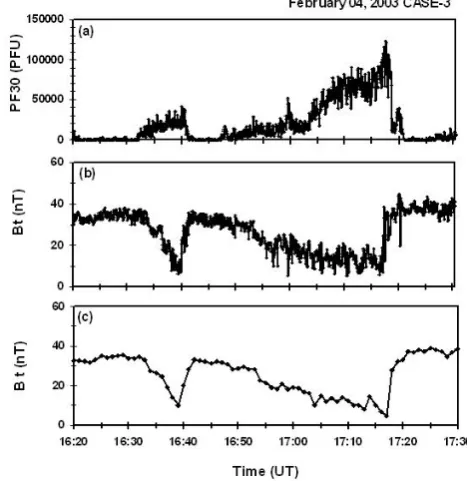
3.3 Case 3: 4 February 2003
[image:9.595.51.289.68.257.2]3774 F. T. Katırcıo˘glu et al.: Magnetosheath cavities: case studies using Cluster observations
30 Figure 12
Fig. 12. Spectral plot for Burst 1 from 14:15 to 15:15 UT in 11 March 2002 (Case 2). Panels from top to bottom are mode of the instrument,
energy in eV (left) and particle flux (right), density, speed (left) and velocity components (right), and temperature (blue) versus time. For comparison, we added 1 min PF30, 1 min magnetic field and 4 s magnetic field in the figure.
85 min from 17:23 UT to 18:48 UT. Peak flux levels varied between 90 000 PFU and 110 000 PFU. The corresponding magnetic field and density data show large depressions and enhanced variations within the cavity regions corresponding
[image:10.595.128.464.65.594.2]31 Figure 13a Fig. 13a. ACE magnetic field data for Case 2, 11 March 2002.
From top to bottom PF30, IMF strength, IMFBx, IMFBy, IMF
Bz, and IMF clock angle versus time. PF30 was added to guide
the features in Cluster data. Cluster data were shifted to the ACE times concurrently to account for the solar wind convection time from ACE to Cluster. Horizontal axis indicates the time at ACE spacecraft.
Burst 1 and 22 nT in Burst 2. The density decreased from 11 cm−3 in the ambient magnetosheath to 7.5 cm−3 within Burst 1 and 8.5 cm−3within Burst 2. Despite depression
sig-nature evident in Burst 2, the large amplitude fluctuations mark the boundaries of this event best. The temperature shows a great and distinct increase and enhanced variability within Burst 2. The intervals of high energy protons corre-spond to slight decreases in the velocity and enhanced fluc-tuations. Figure 15 presents observations of Burst 1 in the same format as that of Figs. 3 and 6. The figure reveals the highly variable magnetic field within the depressed region.
32 Figure 13b Fig. 13b. ACE solar wind plasma data for Case 2, 11 March 2002.
From top to bottom, panels give (a) PF30, (b) IMF strength, (c) den-sity, (d) speed, and (e) proton temperature (radial) versus time. PF30 was added to guide the features in Cluster data. IMF strength was included for easy comparison. Cluster data were shifted to the ACE times concurrently to account for the solar wind convection time from ACE to Cluster. Horizontal axis indicates the time at ACE spacecraft.
While plots of the magnetic field components provide no further details about the depressed regions, the plot of netic longitude versus latitude again indicates greater mag-netic field variability in the depressed regions than in the sur-rounding magnetosheath magnetic fields.
Figure 16 presents IMF dependence for Case 3. As in previous Cases, the panels in Fig. 16a gives IMF compo-nents and IMF Clock Angle, and Fig. 16b shows solar wind plasma data for the time interval of 16:10 UT to 19:10 UT in Fig. 14. IMFBx is strong within both flux burst events,
but IMFBy decreases. IMFBz decreased from 5-8 nT
[image:11.595.51.284.65.462.2] [image:11.595.312.542.67.413.2]3776 F. T. Katırcıo˘glu et al.: Magnetosheath cavities: case studies using Cluster observations
33 Figure 14 Fig. 14. Plots of particle flux (PF30), magnetosheath magnetic field
strength, density, speed, and temperature data versus time for 4 February 2003 (from top to bottom). Red and green lines show bow shock and magnetopause while blue lines indicate the burst events studied.
temperature varies around 0.25 and 0.3 MK within Bursts 1 and 2, respectively.
4 Comparisons with foreshock cavities
The examples presented above demonstrate the existence of magnetosheath cavities characterized by depressed magnetic field strengths, densities and speeds, but enhanced temper-atures. They occur in conjunction with bursts of ≥30 keV ions. We attribute the presence of the magnetosheath cavities to pressure effects associated with the energetic particles.
The depressions in the magnetosheath magnetic field strength and density within the magnetosheath cavities can reach as much as 70% and 50% with respect to values in the ambient magnetosheath. The speed decreases by about 40% and the temperature increases by about 60% within the magnetosheath cavities. As a result, the total pressure cal-culated by summing the gas, ram (dynamic) and magnetic
[image:12.595.308.542.67.308.2]34 Figure 15 Fig. 15. Plot of the expanded time interval for Burst 1 in Case 3 (4
February 2003). As in Figs. 2 and 5, panels give (a) 4 s PF30, and
(b, c) 4 s and 1 min magnetosheath magnetic field.
pressures within the magnetosheath can drop by as much as 80% within the cavities. Figure 17 presents the time vari-ation of the total pressure within Bursts 1 and 2 of Case 1. The anticorrelation between the high energy particle flux (a) and the total pressure (b) within the magnetosheath cavities is evident. Variations in the dynamic pressure (not shown) exceed those of the gas and magnetic pressures. Figure 18a presents a scatter plot of energetic particle fluxes versus total pressure. The best chi-square linear fit to the data in Fig. 18a gives a correlation coefficient around 0.8.
[image:12.595.50.281.67.406.2]35 Figure 16a Fig. 16a. ACE magnetic field data for Case 3, 4 February 2003.
From top to bottom PF30, IMF strength, IMFBx, IMFBy, IMF
Bz, and IMF clock angle. PF30 was added to guide the features in
Cluster data. Cluster data were shifted to the ACE times concur-rently to account for the solar wind convection time from ACE to Cluster. Horizontal axis indicates the time at ACE spacecraft.
from lagged ACE measurements for Case 1. We use the model of Shue et al. (1997) to calculate the distances to the subsolar magnetopause as a function of the north/south IMF orientation and the dynamic pressure. Values for (Rmp)Ratioexceed 1 throughout the interval shown but reach
1.3 within the cavities. The scatter plots in Fig. 18b show the relationship between the magnetopause ratio and the high energy particle flux. The ratio is greater when the flux of energetic particles is large. The correlation coefficient is found to be about 0.8.
Some aspects of magnetosheath cavities resemble those of foreshock cavities, while others do not. Both types of cavities are associated with energetic particles. They both exhibit
de-36 Figure 16b Fig. 16b. ACE solar wind plasma data for Case 3, 4 February 2003.
From top to bottom, panels give (a) PF30, (b) IMF strength, (c) den-sity, (d) speed, and (e) proton temperature (radial) versus time. PF30 was added to guide the features in Cluster data. IMF strength was included for easy comparison. Cluster data were shifted to the ACE times concurrently to account for the solar wind convection time from ACE to Cluster. Horizontal axis indicates the time at ACE spacecraft.
pressed magnetic field strengths and densities and large vari-ations in these parameters. Although thermal plasma tem-peratures decreases within foreshock cavities, suggesting an expansion in response to the enhanced pressures associated with the presence of suprathermal ions, inclusion of these ions in moment calculations actually results in enhanced tem-peratures within the cavities. Expanding cavities compress neighboring plasmas, creating shoulders of enhanced density and magnetic field strength on their edges. Magnetosheath cavities do not exhibit these shoulders, indicating that they are not expanding. Whereas foreshock cavity durations typ-ically vary from 1 to 10 min, average durations for magne-tosheath cavities range from 30 to 60 min.
[image:13.595.309.542.65.394.2] [image:13.595.53.284.66.455.2]3778 F. T. Katırcıo˘glu et al.: Magnetosheath cavities: case studies using Cluster observations
[image:14.595.50.287.65.312.2]37 Figure 17 Fig. 17. Time variation of total pressure and the magnetopause ratio
for Case 1 (2 January 2002). Panels from top to bottom give (a) par-ticle flux (PF30), (b) total pressure in the magnetosheath, and (c) the ratio of the magnetopause distances calculated using Cluster mag-netosheath and Ace solar wind observations. Shue’s magnetopause (1997) was used to calculate the magnetopause boundary. Time in-terval covers Bursts 1 and 2 in Case 1 and horizontal axis shows the time at ACE.
magnetic latitude versus longitude plots for all three cases (e.g. Fig. 8) exhibit this scatter. Hayosh et al. (2004) sought evidence for a relationship between high energy particle fluxes and the total ion flux in 5 years of Interball nightside flank observations. They found only a weak relationship. On the other hand, they found a stronger relationship between the flux levels of high energy particles and fluctuations in the magnetosheath, particularly when either streamlines or field lines connected the point of observation to the quasiparallel shock. They concluded that most of the energetic particles originated from the foreshock and were swept into the night-side magnetosheath. Thus both the upstream solar wind and foreshock regions contributed to the ion flux fluctuations of the nightside magnetosheath. Our study also found a close association between large amplitude fluctuations in the mag-netosheath parameters and the presence of the energetic par-ticles. In fact, we frequently used the fluctuations to identify the magnetosheath cavities.
Sibeck et al. (2001) reported that the foreshock cavities occur on magnetic field lines connected to the bow shock. Sibeck et al. (2002) found that the cavities were not as-sociated with sharp IMF discontinuities. We have found no particular dependence on the IMF orientation or solar
wind plasma conditions. Within the majority of our flux burst events, the corresponding IMF is predominantly south-ward. Within long lasting flux burst events, IMF Bz usually switches its direction from north to south or vice versa. The ambient magnetosheath intervals appear to correspond to an IMF with substantial equatorial components.2Bnvaried
be-tween 20 and 45◦within our events, suggesting they are also associated with the quasi-parallel shock.
Recent results from global hybrid code simulations (N. Omidi, personal communication, 2009) indicate that foreshock cavities can be convected through bow shock and into the magnetosheath. Within the magnetosheath struc-tures, magnetic field strengths and temperatures were cor-related, magnetic field strengths and densities anticorcor-related, and fluctuation levels high. By contrast, our case studies that magnetic field strengths and densities diminish in response to increasing temperatures. More work is need to understand why this should be the case.
5 Summary and conclusions
In this study, we presented three case studies of Cluster ob-servations to study the effects of energetic particles on the magnetosheath plasma and magnetic field. We summarize our findings below:
1. When enhanced fluxes of energetic particles are present in the magnetosheath, magnetic field strengths, densi-ties and velocidensi-ties decrease, but temperatures increase. We call these intervals magnetosheath cavities by anal-ogy to foreshock cavities.
2. All magnetosheath parameters exhibit enhanced fluctu-ations within magnetosheath cavities.
3. Decreases in the total pressure applied to the magneto-sphere by the cavities should permit the magnetopause to lie 30% further outward from the position that would be predicted on the basis of solar wind observations made far upstream.
4. We find no dependence of magnetosheath cavities on IMF or solar wind plasma conditions, with the excep-tion that preliminary 2Bn calculations show that the
events correspond to quasiparallel shock conditions. 5. In contrast to preliminary results from global hybrid
simulations, we find antiphase relationships between the magnetosheath magnetic field strength and densities or temperatures.
38 Figure 18
Fig. 18. Scatter plots of (a) total pressure in the magnetosheath and (b) magnetopause ratio versus particle flux (PF30) for 2 January 2003.
The panels show how total magnetosheath pressure and the magnetopause ratio vary with increasing energetic particle flux.
7. Further studies are also needed to determine how magnetosheath cavities may affect magne-tosheath/magnetosphere coupling, including boundary motion and reconnection.
Acknowledgements. This project was supported by Turkish Scien-tific and Technological Council, project No TUBITAK-104Y039. Work at NASA/GSFC was supported by NASA’s SR&T program. Filiz T¨urk Katırcıoglu would like to thank to S. M. Petrinec for his valuable helps on the calculation of Theta Bn. We thank to PIs and teams of the instruments, the magnetometer FGM, plasma CIS, and energetic particle RAPID on Cluster, and MFI and SWE on ACE for providing data via NASA’s CDAWeb.
Topical Editor I. A. Daglis thanks one anonymous referee for her/his help in evaluating this paper.
References
Asbridge, J. R., Bame, S. J., Gosling, J. T., Paschmann, G., and Scopke, N.: Energetic plasma ions within Earth’s magne-tosheath, Geophys. Res. Lett., 5, 953–955, 1978.
Balogh, A., Dunlop, M. W., Cowley, S. W. H, Southwaood, D. J., Thomlinson J. G., et al.: The Cluster Magnetic Field Investiga-tion, Space Sci. Rev., 79, 65–91, 1997.
Baker, D., Belian, R. D., Fritz, T. A., Higbie, P. R., Krimigis, S. M., et al.: Simultaneous energetic particle observations at geostation-ary orbit and in the upstream solar wind: evidence for leakage during the magnetospheric compression event of November 1, 1984, J. Geophys. Res., 93, 14317–14327, 1988.
Chang, S.-W., Scudder, J. D., Fennell, J. F., Friedel, R., Lepping, R. P., et al.: Energetic magnetosheath ions connected to the Earth’s bow shock: Possible sources of cusp energetic ions, J. Geophys. Res., 105(A3), 5471–5488, 2000.
Chen, J., Fritz, T. A., Sheldon, R. B., Spence, H. E., Spjeldvik, W. N., et al.: Cusp energetic particle events: implications for a major acceleration region of the magnetosphere, J. Geophys. Res., 103(A1), 69–78, 1998.
Cooling, B. M. A., Owen, C. J., and Schwartz, S. J.: Role of the magnetosheath flow in determining the motion of open flux tubes, J. Geophys. Res., 106(A9), 18763–18775, 2001.
Crooker, N. R., Eastman, T. E., Frank, L. A., Smith, E. J., and Russell, C. T.: Energetic magnetosheath ions and interplane-tary magnetic field orientation, J. Geophys. Res., 86, 4455–4460, 1981.
Formisano, V., Moreno, G., Palmiotto, F., and Hedgecock, P. C.: Solar wind interaction with the Earth’s magnetic field: 1. Mag-netosheath, J. Geophys. Res., 78, 3714–3730, 1973.
Fuselier, S. A., Klumpar, D. M., and Shelley, E. G.: On the ori-gins of energetic ions in the Earth’s dayside magnetosheath, J. Geophys. Res., 96, 47–56, 1991.
Gosling, J. T.: Ion acceleration at shocks in interplanetary space: a brief review of recent observations, Space Sci. Rev., 34, 113– 126, 1983.
Hayosh, M., Safrankova, J., Nemecek, Z., Prech, L., Kudela, K., and Zastenker, G. N.: Relationship between high energy particles and ion flux in the magnetosheath, Planet. Space Sci., 53, 103– 115, 2004.
Kobel, E. and Fl¨uckiger, E. O.: A model of the steady state magnetic field in the magnetosheath, J. Geophys. Res., 99(A12), 23617– 23622, 1994.
Kudela, K., Sibeck, D. G., Slivka, M., Fischer, S., Lutsenko, V. N., and Venkatesan, D.: Energetic electrons and ions in the magne-tosheath at low and medium latitudes:prognoz 10 data, J. Geo-phys. Res., 97, 14849–14857, 1992.
McComas, D. J., Blame, S. J., Parker, P., Felman, W. C., Phillips, J. L., Riley, P., Griffee, J. W.: Solar Wind Electron Proton Alpha Monitor (SWEPAM) for the Advanced Composition Explorer, Space Sci. Rev., 86, 563–612, 1998.
Nemecek, Z., Safrankova, J., Zastenker, G. N., Pisoft, P., Paulerana, K. I., et al.: Observations of the radial magnetosheath profile and a comparison with gasdynamic model predictions, Geophys. Res. Lett., 27, 2801–2804, 2000.
Ogilvie, K. W. and Fitzenreiter, R.: The Kelvin-Helmholtz instabil-ity at the magnetopause and inner boundary layer surface, Geo-phys. Res. Lett., 94, 15113–15123, 1989.
3780 F. T. Katırcıo˘glu et al.: Magnetosheath cavities: case studies using Cluster observations
flow directions near the Earth’s bow shock, J. Geophys. Res., 93, 11279–11294, 1988.
R`eme, H., Aoustin, C., Bosqued, J., et al.: First multispacecraft ion measurements in and near the Earth’s magnetosphere with the identical Cluster ion spectrometry (CIS) experiment, Ann. Geophys., 19, 1303–1354, 2001,
http://www.ann-geophys.net/19/1303/2001/.
Russell, C. T., Petrinec, S. M., Zhang, T. L., Song, P., and Kawano, H.: The effect of foreshock on the motion of the dayside magne-topause, Geophys. Res. Lett., 24(12), 1439–1441, 1997. Safrankova, J., Zastenker, G., Nemecek, Z., Fedorov, A.,
Simer-sky, M., and Prech, L.: Small scale observation of magnetopause motion: preliminary results of the INTERBALL project, Ann. Geophys., 15, 562–569, 1997,
http://www.ann-geophys.net/15/562/1997/.
Scholer, M.: Diffuse shock acceleration., in: Collisionless shocks in the heliosphere: Reviews of Current Research, eduted by: Tsu-rutani, B. T. and Stone, R. G., Geophysical Monograph Series, vol. 35, AGU, Washington, D.C., pp 287–301, 1985.
Scholer, M., Gloeckler, G., Ipavich, F. M., Hovestadt, D., and Klecker, B.: Leakage of magnetospheric ions into the tosheath along reconnected field lines at the dayside magne-topause, J. Geophys. Res., 86, 1299–1304, 1981.
Sibeck, D. G.: The magnetospheric response to foreshock pressure pulses, in Physics of the Magnetopause, Geophys. Monograph, 90, 293–302, 1995.
Sibeck, D. G., Phan, T.-D., Lin, R., Lepping, R. P., and Szabo, A.: Wind observations of foreshock cavities: A case study, J. Geo-phys. Res., 107(A10), 1271, doi:10.1029/2001JA0077539, 2002. Sibeck, D. G., Omidi, N., Dandouras, I., and Lucek, E.: On the edge of the foreshock: model-data comparisons, Ann. Geophys., 26, 1539–1544, 2008,
http://www.ann-geophys.net/26/1539/2008/.
Sibeck, D. G., Decker, R. B., Mitchell, D. G., and Lazarus, A. J., Lepping, R. P., and Szabo, A.: Solar wind preconditioning in the flank foreshock: IMP 8 observations, J. Geophys. Res., 106(A10), 21675–21688, 2001.
Sibeck, D. G., Borodkova, N. L., Schwartz, S. J., Owen, C. J., Kessel, R., et al.: Comprehensive study of the magnetospheric re-sponse to a hot flow anomaly, J. Geophys. Res., 104(A3), 4577– 4593, 1999.
Sibeck, D. G., Baumjohann, W., and Lopez, R. E.: Solar wind dynamic pressure variations and transient magnetospheric sig-natures, Geophys. Res. Lett., 16, 13–16, 1989a.
Sibeck, D. G., Baumjohann, W., Elphic, R. C., Fairfield, D. H., Fen-nell, J. T., et al.: The magnetospheric response to 8-min-period strong-amplitude upstream pressure variations, J. Geophys. Res., 94, 2505–2519, 1989b.
Sibeck, D. G. and MacEntire, R. W.: Multiple satellite observations of leakage of particles from the magnetosphere., Adv. Space Res., 8, 201–216, 1988.
Sibeck, D. G., McEntire, R. W., Lui, A. T. Y., Krimigis, S. M., Zanetti, L. J., and Potemra, T. A.: The magnetosphere as a source of energetic ions, Geophys. Res. Lett., 14, 1011–1014, 1987a. Sibeck , D. G., McEntire, R. W., Lui, A. T. Y., Krimigis, S. M.,
Zanetti, L. J., amd Potemra, T. A.: Energetic magnetospheric ions at the dayside magnetopause: leakage or merging?, J. Geo-phys, Res., 92, 12097–12114, 1987b.
Shue, J.-H., Chao, J. K., Fu, H. C., Russell, C. T., Song, P., Khurana, K. K., and Singer, H.,J.: A new functional form to study the solar wind control of the magnetopause size and shape, J. Geophys. Res., 102(A5), 9497–9511, 1997.
Smith, C. W., Acuna, M. H., Burlaga, L. F., L’Heureux, J., Ness, N. F., Scheifele, J.: The Ace Magnetic Fields Experiment, Space Sci. Rev., 86, 613–632, 1998.
Thomas, V. A. and Brecht, S. H.: Evolution of diamagnetic cavities in the solar wind, J. Geophys. Res., 93, 11341–11353, 1988. Turk, F., Kaymaz, Z., and Sibeck, D. G.: Search for Plasma and
Magnetic Field Cavities in Magnetosheath, Adv. Space Res., 31(5), 1455–1462, 2003.