Please cite this article as: M. Boussaada, R. Abdelaati, H. Yahia. Emulation, Model Identification and New-approach Characterization of a PV Panel, International Journal of Engineering (IJE), IJE TRANSACTIONS B: Applications Vol. 31, No. 8, (August 2018) 1222-1227
International Journal of Engineering
J o u r n a l H o m e p a g e : w w w . i j e . i rEmulation, Model Identification and New-approach Characterization of a PV Panel
M. Boussaada*, R. Abdelaati, H. Yahia
Electrical department, Engineering School of Monastir, Monastir University, Tunisia
P A P E R I N F O
Paper history:
Received 15 September 2017
Received in revised form 23 February 2018 Accepted 26 April 2018
Keywords:
Diode-based-equivalent PV Panel DC/DC Buck Converter New Characterization Tool PCM Identification PV Panel
A B S T R A C T
This paper provides experimental and simulation tools to characterize a Photo-Voltaic (PV) panel. To achieve this objective, we start from a PV electrical model and we propose a circuit using Diode-based-equivalent PV (DBEPV) panel. This circuit is presented as a prototype of an equivalent PV panel. It is designed to emulate a real PV module in different climatic conditions (irradiance and temperature). In addition, a new characterization tool for the PV panel, based on the automatic progression of the duty cycle of a Pulse-Width-Modulation (PWM) signal driving DC/DC buck converter, is developed. This characterization tool can emulate a variable resistance from a zero value to the highest one. An ISIS software package and a MATLAB®/Simulink® environment are used to
simulate the characterization of a real PV panel, and the proposed prototype is experimentally validated. The experimental results were obtained and compared with those extracted from simulation. An identification of the parameters of the nonlinear mathematical model of the PV panel is necessary to validate our new approach characterization of a real PV panel and a prototype DBEPV one. A parametric characterization method based on iterative algorithm is applied. A good agreement was achieved. Indeed, our comparison showed the efficiency and feasibility of DBEPV prototype and our characterization method.
doi: 10.5829/ije.2018.31.08b.09
1. INTRODUCTION1
Recently, there has been a strong penetration of renewable energy sources into power supply networks. A lot of studies and researches in this area have registered significant progress and provided new concepts and solutions for realistic and practical generation systems, using renewable energy by converting sunlight energy into electricity. Photo-Voltaic (PV) cells are considered a part of this renewable energy. A PV cell plays a very important role in this field. It can supply electrical energy by directly converting solar energy through the PV effect. To be useful for high energy; these PV cells must be arranged in series and parallel-connected modules [1]. The output power of a PV module is influenced by the irradiation and temperature of solar cells [1, 2]. Therefore, to maximize the efficiency of a PV system, it is necessary to track the maximum power point of the input source [3-5]. To achieve this task, PV parameters must be
*Corresponding Author’s Email: [email protected] (M. Boussaada)
identified from an I-V characteristic curve representing the output of an equivalent electric model of a PV panel. An I-V curve is built using a variable resistor, a capacitive load, an electronic charge and a DC-DC converter [6]. This converter easily emulates a variable resistance from the smallest value to the largest one; so that it can accomplish the task more correctly. Electronic loads propose variable load impedance, composed of a MOSFET in series with a resistor connected to the terminals of a PV panel [7].
In the literature, we are encouraged by a lot of work using DC-DC converters for an I-V measurement, to design reliable and more accessible loads. Different DC-DC converter topologies, like buck, boost and the buck-boost-derived converters being variable resistance emulators were used [8, 9].
Actually, characterization tools are still often expensive in the market. For this purpose, we have sought to realize in the laboratory a suitable way to characterize our PV panel based on an electronic load (DC-DC buck converter), which can emulate a variable resistance from its smallest values to its highest ones.
Still, DC-DC coverters have several problems and limitations, mainly related to the determination of the open-circuit voltage 𝑉𝑜𝑐 and the short-circuit current 𝐼𝑠𝑐.
In addition, the characteristics of I-V and P-V specific zones are partly attained [10]. Therefore, we proposed a DC-DC buck controller to correctly and accurately generate an I-V curve. It is possible in ISIS simulation and in an experimental test bench to scan the entire I-V curve of a PV generator from 𝑉𝑜𝑐 to 𝐼𝑠𝑐.
In general, the characterization of a PV panel is based on the upward or downward load impedance variation, which is usually connected directly to the PV panel. In our work, we replace that variable load by a fixed one connected to a DC-DC buck converter, which is commanded with an analog Pulse-Width-Modulation (PWM) signal, mainly to create a PWM signal with a time-varying duty cycle with an increasing or decreasing behavior. When the duty cycle is zero, the PV will be disconnected from the load and will be in an open-circuit operating 𝑉𝑜𝑐. When the duty cycle is equal
to one, the PV will be connected to the load. Accordingly, using a low load assures that PV is in short-circuit operating 𝐼𝑠𝑐. The progressive increase or
decrease in the duty cycle can be obtained by comparing a linear, progressive voltage with a saw-tooth signal. To achieve this, we developed an electronic card based on an electronic counter associated to a Digital-to-Analog Converter (DAC). Both the counter and DAC transform a progressive number to a progressive voltage signal. This latter is compared to a saw-tooth signal and delivers the PWM signal with a variable duty.
In this context, and to obtain I-V and P-V characteristics of a PV panel, we developed an experimental bench: a prototype of an equivalent PV (PEPV) panel (electric current source shunted with a set of diodes), a PWM card, and a DC-DC converter connected to a fixed load. To validate our design, the experimental I-V and P-V characterizations were compared to those simulated in ISIS and MATLAB environments. With the ISIS software, we implement and simulate a PEPV panel and our proposed load tracer. The characteristics of this latter were compared to those given by a real PV panel and an experimental
PEPV panel, respectively. Using
MATLAB®/Simulink®, we identified the PEPV
parameters, and then the mathematical model characteristics were compared to the experimental ones.
In this paper, a new DC-DC controller is suggested to act as a variable load across a PV generator. The experimental and simulation tests confirmed our proposal. Section 2 describes the PV principle and operation, followed by explaining the influence of the temperature and irradiance on the I-V and P-V curves. In section 3, we emulate the variable resistor based on a new controller. Section 4 provides the plot of the I-V and P-V characteristics obtained from the mathematical
model. The experimental results validate the theoretical analysis. The conclusion is drawn in section 5.
2. PHOTO-VOLTAIC PANELS
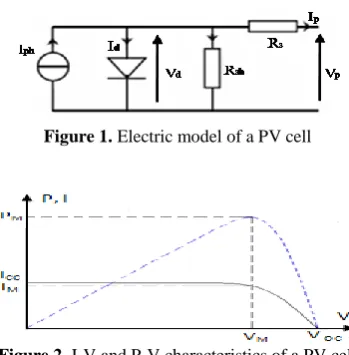
2. 1.Analytical Model of a PV Cell A PV cell can be modeled as illustrated in Figure 1 [11]. The current of a solar cell can be expressed by:
𝐼𝑃= 𝐼𝑝ℎ− 𝐼𝑑− 𝐼𝑟𝑠ℎ (1)
where, 𝐼𝑝 is the output current, 𝐼𝑝ℎ is the photo
generated current, 𝐼𝑑 is the dark saturation current, and
𝐼𝑟𝑠ℎ is the current flowing shunt resistance, given:
𝐼𝑟𝑠ℎ= (𝑉𝑝+ 𝑅𝑠𝐼𝑝)/𝑅𝑠ℎ (2)
where, 𝑉𝑝 is the output voltage, 𝑅𝑠 is the series
resistance, and 𝑅𝑠ℎ is the shunt resistance. Equation (1)
is developed to be as follows:
𝐼𝑃= 𝐼𝑝ℎ− 𝐼𝑠[𝑒𝑥𝑝(𝑉𝑝+𝑅𝑠𝐼𝑝)/𝑉𝑇− 1] − (𝑉𝑝+ 𝑅𝑠𝐼𝑝)/ 𝑅𝑠ℎ (3)
where, 𝐼𝑠 is the reverse saturation current, 𝑉𝑇= 𝐴𝐾𝑇/𝑞
is the thermodynamic voltage, 𝐴 is the diode ideality constant, 𝑞 = 1.6 ∗ 10−19°C is the electronic charge,
𝐾 = 1.38 ∗ 10−23𝐽/𝐾 is the Boltzmann constant, and 𝑇
is the ambient temperature in Kelvins. Equation (3) can be plotted versus the output voltage 𝑉𝑃 (a continuous
line in Figure 2). Thus, multiplying equation (3) by 𝑉𝑃
results in:
𝑃 = 𝑉𝑃 𝐼𝑃= (𝐼𝑝ℎ− 𝐼𝑠[𝑒𝑥𝑝(𝑉𝑝+𝑅𝑠𝐼𝑝)/𝑉𝑇− 1] −
(𝑉𝑝+ 𝑅𝑠𝐼𝑝)/ 𝑅𝑠ℎ)𝑉𝑃
(4)
The power expression in equation (4) is then plotted versus voltage 𝑉𝑃, leading to a curve in the form shown
in Figure 2 with a dashed line. Both curves are plotted for constant temperature and irradiance. In this figure, 𝑃𝑀 is the optimal power, 𝑉𝑀 is the optimal voltage, 𝐼𝑀 is
the optimal current, 𝐼𝑆𝐶 is the short circuit current, and
𝑉𝑂𝐶 is the open circuit voltage.
Figure 1. Electric model of a PV cell
A maximum power operation of PV module applications is a challenging problem, since it requires that the system load is capable of using all available power from the PV system at all times.
In any case, any operating point is given by the intersection of the I-V characteristics of the connected load with the I-V characteristics of the PV array. In other words, a variation in the load under average irradiance and temperature conditions involves the movement of the operating point along the I-V characteristic of the PV module from open-circuit to short-circuit conditions. Based on the electric energy production, as needed, PV modules can be arranged into arrays to raise the electrical output. The groups of modules are connected in parallel and in series to form a solar array or panel to get the necessary voltage and current. Those kinds of PV panels require a large area to be planted and are generally mounted on roofs. To simplify this huge and difficult plant of PV cells, we propose an equivalent PV panel based on 32 power diodes connected in series, called a Diode-based-equivalent circuit of a PV (DBEPV) panel, which is simple to use and easy to design.
2. 2.Diode-based Equivalent Circuit of a PV Panel
Based on the electric model of a PV module, an equivalent PV generator can be designed as in [12]. The principle of this prototype is based on a current souce shunted to a set of diodes and devoted to supply the same short-circuit current as any real PV panel operating at any condition. Also, 𝑉𝑜𝑐 can be adjusted
across a diode panel by the number of diodes connected in series. Thus DBEPV panel can accomplish static and dynamic characteristics like any PV array. Figure 3 depicts DBEPV panel simulated on a Proteus ISIS environment. It is designed to deliver an open-circuit voltage 𝑉𝑂𝐶= 34.1 𝑉 and a short-circuit current 𝐼𝑆𝐶 =
3.24 𝐴. To extract I-V and P-V characteristic curves, we proposed an electronic load acting as an I-V tracer to sketch these curves, as shown in Figure 4.
3. PROPOSED ELECTRONIC LOAD
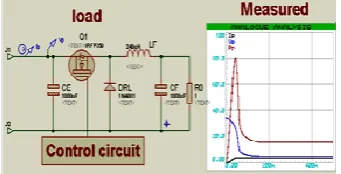
We suggested an electronic load made of an L-C filter composed of an inductor L and a capacitor C, a DC-DC buck converter with an appropriate PWM control module, and a resistor R0. Connected to our DBEPV module, this load scans all operating points on both current and power-source voltage curves, to characterize a PV source from 𝑉𝑂𝐶 to 𝐼𝑆𝐶.
3. 1. Buck Converter and PWM Controller The most appealing method consists in sweeping the IV-curve, using a variable resistor as proposed in literature [8].
Figure 3. Proteus ISIS-based DBEPVP model
Figure 4. ISIS simulation
The DBEPV-load system can start from a minimal allowed voltage (or maximal allowed current) and then it gradually rises until reaching the maximal allowed voltage (or minimal allowed current). Our proposed system presents an electronic load based on a buck converter connected to a resistor. The buck converter is commanded by a PWM controller. Both of them were designed as inner parts of the proposed load. Their equivalent circuits are shown in Figure 4.
3. 2. Simulation in ISIS Environment The suggested system, composed of a DBEPV panel and an electronic load, is developed and simulated in an ISIS environment. Figure 4 illustrates the buck converter connected to the output (J1, J2) of the prototype diode panel provided in Figure 3. The CMOS transistor is controlled by a variable PWM result by comparing between a ramp signal and a saw-tooth signal. This performs an automatic switching of the operating point between the open-circuit and short-circuit conditions. The measurement of the output voltage, current and power versus time are given in Figure 4.
3. 3. Experimental Results Using Proposed Electronic Load The aforementioned DBEPV panel and electronic load were built in electronic cards in our research laboratory, as shown in Figure 5. A ramp card and a PWM generator card are also realized.
Figure 5. Experimental set-up
Figure 6. Simulation sample of progressive duty cycle
3. 3. 1. I-V and P-V Characteristics of a Real Panel
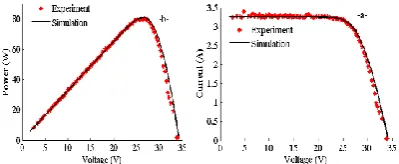
To validate DBEPV panel, the simulation results sketch its I-V and P-V characteristic curves, compared to those extracted from a real PV panel (IFRI250-60). This latter is implanted on the roof of our laboratory. The experimental curves are extracted using our suggested I-V tracer under various climatic conditions (temperature and irradiation). The PV electronic load is the same as shown in Figure 5, but the DBEPV panel is replaced by a real laboratory PV panel. A lot of experimental tests were conducted during different periods. Examples of tests are given in Figure 7 for (G= 632.93 W/m² &T 31.91°C) and Figure 8 for (G= 566.21 W/m² &T 31.83°C).
In Figures 7 and 8, we sketched the simulation results given by the DBEPV-load system modeled on an ISIS environment at the same conditions of the examples of the experimental tests. Compared to the current-voltage and power-voltage curves extracted from the real PV panel, as illustrated in Figures 7 and 8, our DBEPV panel model can prove its validity as an alternative that can simulate a real PV panel.
Figure 7. Comparison of simulated and measured curves of a
real PV panel (G=632.93 W/m²): a) I-V characteristic, b) P-V characteristic
Figure 8. Comparison of simulated and measured curves of a
real PV panel (G=566.21 W/m²): a) I-V characteristic, b) P-V characteristic
3. 3. 2. I-V and P-V Prototype Characteristic
The results given by the simulated DBEPV model are in concordance with the experimental results of the
current-voltage I-V and power-voltage P-V
characteristics sketched out from our DBEPV-load electronic cards, as it can be seen in Figure 9. The ISIS simulation curves of the model are in a solid line and the experimental results are in a dotted line. Both curves are built at the same conditions: an open-circuit voltage of 34.1V and a short current of 3.24 A.
We can specify here that contrary to a real PV panel, DBEPV panel registers the lack of temperature and irradiance dependencies. This shortcoming forces us to validate the experimental results of DBEPV panel by comparing them to those given by the ISIS model, because this simulated model can be adapted to meteorological data by adding or removing diodes from the chain and adjusting the values of 𝑅𝑠 and 𝑅𝑠𝐻. Once
simulated, the model is validated. The comparison study between DBEPV panel and its ISIS model (Figure 9) is sufficient to prove this PV prototype.
4. PARAMETER IDENTIFICATION
During the characterization of a PV panel, we measured the voltages and currents produced at these terminals. It is possible to reconstitute the characteristics of an energy PV panel by its mathematical model while applying a series of voltage levels between 0 and 𝑉𝑂𝐶
and calculating their corresponding currents. This model is non-linear and contains unknown parameters, which depends on several factors such as climatic conditions [1, 13, 14]. In practice, the obtained I-V curve implies that the parameters are not accessible.
Figure 9. Comparison of simulated and measured curves of
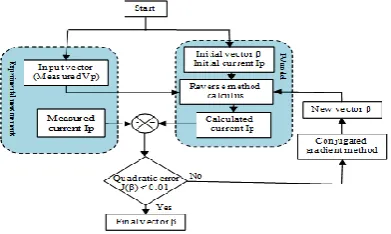
To extract them, we used a Parametric Characterization Method (PCM) based on minimizing quadratic difference between the experimental measurements and the results of the theoretical models describing the PV system. This method is described in Figure 10.
The parametric characterization presented in this paper requires experimental (voltage, current) measurements and a mathematical model of a PV panel. Our task is to apply this method on DBEPV module to convert it into a mathematical model of four parameters. The PCM method consists in assessing inaccessible physical quantities in an experience (β) to another measuring magnitude (I, V), which is directly accessible to an experience. Given V, I is calculated from a mathematical model of the problem. For a PV panel, the mathematical model is given by Equation (3). The latter is adopted to predict the DBEPV model. First, an initial vector β and current IP are chosen. After that, a reverse
calculus method is applied, based on the Newton-Raphson method, to get the first calculated current IP.
𝐽(𝛽) is a quadratic criterion depending on the residual error given between 𝐼𝑝−𝑚𝑒𝑎𝑠𝑢𝑟𝑒𝑑 and 𝐼𝑝−𝑐𝑎𝑙𝑐𝑢𝑙𝑎𝑡𝑒𝑑.
If 𝐽(𝛽) < 0.01 , then the present vector 𝛽 is retained. Otherwise, another initial vector 𝛽 is calculated. This part of the algorithm is based on the Gauss Newton method. The process will continue until the condition on 𝐽(𝛽) is approved.
Table 1 presents the results obtained by the proposed parametric characterization method. Using the experimental data given DBEPVP and starting from a well-chosen initial vector 𝛽, we can have an approximated four-parameter model of the DBEPVP, with 𝐼𝑝ℎ = 3.24 𝐴, 𝑉𝑂𝐶= 34.10 𝑉, and 𝐴 = 1.32.
As shown in Figure 11, the I-V and P-V characteristics of the DBEPV mathematical model are in concordance with those obtained by the DBEPV-load cards. It is noted that the accuracy of the estimated values depends upon the chosen tolerance band and the initial vector 𝛽. The PCM validation is done by calculating the errors in the curves obtained using the estimated parameters with respect to those curves obtained experimentally, as illustrated by Figure 12.
Figure 10. PCM flowchart
TABLE 1. Estimation results (DBEPV, parameter model)
β parameters Initial values Optimal values
𝐼𝑆 (A) 3.0 10-13 3.29 10-12
𝑉𝑇 (V) 1.1 1.23
𝑅𝑠 (ohm) 1.4 1.42
𝑅𝑠ℎ (ohm) 80 5.610+3
Figure 11. Comparison of measured and calculated
characteristics of a DBEPV model using estimated parameters: a) I-V characteristic, b) P-V characteristic
Figure 12. Residual error
5. CONCLUSION
6.REFRENCES
1. Dhassa, A., Natarajana, E. and Lakshmi, P., "An investigation of temperature effects on solar photovoltaic cells and modules",
International Journal of Engineering-Transactions B: Applications, Vol. 27, No. 11, (2014), 1713-1722.
2. Salih, S., Jabur, Y.K. and Kadhim, L., "Analysis of temperature effect on a crystalline silicon photovoltaic module performance",
International Journal of Engineering-Transactions B: Applications, Vol. 29, No. 5, (2015), 722-727.
3. Subramanian, N., Prasanth, P., Srinivasan, R., Subhesh, R. and Seyezhai, R., "Analysis and experimentation of soft switched interleaved boost converter for photovoltaic applications",
International Journal of Engineering-Transactions A: Basics, Vol. 28, No. 10, (2015), 1469-1475.
4. Haihong, B., Weiping, Z. and Bing, C., "Control simulation and experimental verification of maximum power point tracking based on rt-lab", International Journal of Engineering-Transactions A: Basics, Vol. 29, No. 10, (2016), 1372-1379. 5. Boutabba, T., Drida, S., Chrifi-Alaouic, L. and Benbouzidd, M.,
"A new implementation of maximum power point tracking based on fuzzy logic algorithm for solar photovoltaic system",
International Journal of Engineering-Transactions A: Basics, Vol. 31, No. 4, (2018), 580-587.
6. Silva, E.A., Bradaschia, F., Cavalcanti, M.C. and Nascimento, A.J., "Parameter estimation method to improve the accuracy of photovoltaic electrical model", IEEE Journal of Photovoltaics, Vol. 6, No. 1, (2016), 278-285.
7. Triki, A., Mahrane, A., Guenounou, A. and Laghrouche, M., "Conception et simulation d’un banc de mesure de la caractéristique i-v des modules photovoltaïques", Revue des Energies Renouvelables, Vol. 17, No. 1, (2014), 29-41. 8. Durán, E., Andújar, J., Enrique, J. and Pérez-Oria, J.,
"Determination of pv generator iv/pv characteristic curves using a dc-dc converter controlled by a virtual instrument",
International Journal of Photoenergy, Vol. 2012, (2012). 9. Taghvaee, M., Radzi, M., Moosavain, S., Hizam, H. and
Marhaban, M.H., "A current and future study on non-isolated dc–dc converters for photovoltaic applications", Renewable and Sustainable Energy Reviews, Vol. 17, (2013), 216-227. 10. Khatib, T., Elmenreich, W. and Mohamed, A., "Simplified iv
characteristic tester for photovoltaic modules using a dc-dc boost converter", Sustainability, Vol. 9, No. 4, (2017), 657-668. 11. Pan, L., "Analysis of photovoltaic module resistance
characteristics", (2013).
12. Zhou, Z. and Macaulay, J., "An emulated pv source based on an unilluminated solar panel and dc power supply", Energies, Vol. 10, No. 12, (2017), 2075-2094.
13. Maity, S., Bhunia, C. and Sahuc, P., "Experimental study of some effective surface parameters of crystalline silicon solar cell for getting better performance", International Journal of Engineering-Transactions A: Basics, Vol. 28, No. 1, (2014), 81-87.
14. Hosseini, S., Taheri, S., Farzaneh, M., Taheri, H. and Narimani, M., "Determination of photovoltaic characteristics in real field conditions", IEEE Journal of Photovoltaics, Vol. 8, No. 2, (2018), 572-580.
Emulation, Model Identification and New-approach Characterization of a PV Panel
M. Boussaada, R. Abdelaati, H. Yahia
Electrical department, Engineering School of Monastir, Monastir University, Tunisia
P A P E R I N F O
Paper history:
Received 15 September 2017
Received in revised form 23 February 2018 Accepted 26 April 2018
Keywords:
Diode-based-equivalent PV Panel DC/DC Buck Converter New Characterization Tool PCM Identification PV Panel
هديكچ
( ژاتلو سکع لنپ کی ندرک صخشم یارب ار یزاس هیبش و یبرجت رازبا هلاقم نیا
PV
رب .دنک یم مهارف ) نیا هب یبایتسد یا
یکیرتکلا لدم کی زا ام ،فده
PV
سا رب دوید هیاپ رب لناپ زا هدافتسا اب رادم کی و مینک یم عورش م داهنشیپ سا
ی
(DBEPV) PV
لناپ زا هنومن کی ناونع هب رادم نیا .مینک
PV
هدش یحارط نیا .تسا هدش هئارا لداعم ا
کی هک تس
یعقاو لوژام
PV
ی ،نیا رب هولاع .دنک دیلقت )ترارح هجرد و شبات( ییاوه و بآ فلتخم طیارش رد ار م رازبا ک
هصخش
لناپ یارب دیدج
PV
انگیس کی راک هخرچ کیتاموتا تفرشیپ ساسا رب ل
PWM
لدبم
DC / DC
عسوت کب لدبم ه
.دنک دیلقت ار نیرتلااب هب رفص رادقم زا ریغتم تمواقم کی دناوت یم هصخشم رازبا نیا .تسا هتفای مرن هتسب کی
ا زف یرا
ISIS
طیحم کی و
MATLAB® / Simulink ®
یارب هیبش یزاس صوصخ یعقاو لناپ تای
PV
و دوش یم هدافتسا
هک ییاهنآ اب و هدمآ تسدب یبرجت جیاتن .تسا هدش دییات یبرجت تروص هب هدش داهنشیپ هیلوا هنومن ا
یبش ز یزاس ه
لناپ یضایر یطخ ریغ لدم یاهرتماراپ ییاسانش .دنا هدش هسیاقم هدش جارختسا
PV
یگژیو دییات یارب ج
ام درکیور دید
یعقاو لناپ کی
PV
هنومن کی و
DBEPV 1
رارکت متیروگلا ساسا رب یرتماراپ فیصوت شور کی .تسا مزلا لامعا ی
دهد یم ناشن یزاس هیبش و یبرجت جیاتن نیب هسیاقم ،عقاو رد .تسا هدمآ تسد هب بوخ قفاوت .دوش یم ا هک
و یشخبرث
هیلوا هنومن یجنس ناکما
DBEPV
هدش داهنشیپ فیصوت شور و
.