Effects of different temperatures and durations of heating on the
reduction of Ochratoxin a in bread samples
M M M
Masoud Hashemiasoud Hashemiasoud Hashemiasoud Hashemi----KaroueiKaroueiKaroueiKarouei1111
, Issa , Issa , Issa
, Issa GholampourGholampourGholampourGholampour----AziziAziziAziziAzizi2222
, Samaneh Rouhi , Samaneh Rouhi, Samaneh Rouhi , Samaneh Rouhi2222
, , ,
, Mahdi Mahdi Mahdi TashayyoMahdi TashayyoTashayyoTashayyo1111
1 Department of Microbiology, Islamic Azad University, Tonekabon Branch, Tonekabon, Iran 2 Department of Microbiology, Islamic Azad University, Babol Branch, Babol, Iran
Abstract Abstract Abstract Abstract
Ochratoxin A (OTA) is a mycotoxin produced in corn, rice, and flour. It is a major concern for animal and human health. The purpose of this study was the evaluation of OTA contamination in bread samples gathered from bakeries, in different temperatures and durations of heating. In this study, 32 samples (4 samples of flour and 28 samples of bread) were randomly collected from different bakeries in Babol city, Mazandaran province, Iran, in fall 2013. The OTA content of the samples was measured in different temperatures and durations of heating using competitive direct enzyme-linked immunosorbent assay (CD-ELISA) method. Nonparametric Kruskal-Wallis was applied for data analysis. Results proved that reduction in the amount of OTA in samples during the heating process was significant and longer duration of heating was more effective, than raising the temperature, on OTA reduction. The highest percentage of OTA reduction occurred in constant temperature and when 2 minutes were added to the original time of heating. The lowest reduction rate of this toxin was observed in constant temperature and when 4 minutes was deducted from the original time in each bakery. Our study showed that bread and flour samples do in fact contain OTA, but this toxin is being reduced through heating. Since bread is the most consumed food in the world and also Iran, determination, management, and reduction of OTA in bread should be considered seriously.
KEYWORDS: KEYWORDS: KEYWORDS:
KEYWORDS: Bread,Ochratoxin A Reduction, Temperatures, Heating
Date of submission: Date of submission: Date of submission:
Date of submission: 16 May 2014, Date of acceptance:Date of acceptance: Date of acceptance:Date of acceptance:19 Jul 2014
Citation: Hashemi-Karouei M, Gholampour-Azizi I, Rouhi S, Tashayyo M. Effects of different temperatures
and durations of heating on the reduction of Ochratoxin a in bread samples. J Adv Environ Health Res
2014; 2(4): 209-14.
Introduction
1
Mycotoxins are secondary metabolites that are produced by fungi. Aflatoxins, trichothecenes, zearalenone, fumonisins, and ochratoxins are important mycotoxins found in cereals.1
Ochratoxin has three types of A, B, and C which have some chemical differences. This toxin has a colorless and crystallized compound. Ochratoxin A (OTA) is a common type of Ochratoxin.2 The
chemical structure of OTA is 7-L-β-phenylalanylcarbonyl-5-chloro-8-hydroxy-3,
Corresponding Author
Corresponding AuthorCorresponding Author Corresponding Author::::
Mahdi Tashayyo
Email: [email protected]
dihydro-3-R-methyl-isocoumarin.3 OTA is
produced by Aspergillus ochraceus, Aspergillus carbonarius, and Aspergillus niger in tropical regions, and by Penicillium verrucosum in temperate regions.4 This toxin has been found in
different foods such as corn, rice, soybean, coffee, cocoa, bean, and pea and also corn derivatives such as flour, bread, and pasta.5 OTA
has nephrotoxic, immunotoxic, carcinogenic, teratogenic, and genotoxic effects and it has been associated with human and animal kidney diseases.6 The International Agency for Research
on Cancer (IARC) has given a group 2B classification to OTA.3 The Iranian maximum
tolerated level for OTA is 5 ng/g in human
food.7 European Commission (EC) has
determined the maximum tolerated OTA level to be 5 ng/g for cereals and 3 ng/g for their derived products. According to EC, the tolerable weekly intake (TWI) of OTA is 120 ng/kg bw/week for humans.6 Several studies have
shown the production of mycotoxins in food products, and the reduction and change in concentration of different mycotoxins based on heating in human food. Meca et al., in Canada, detected Fusarium mycotoxin [Beauvericin (BEA) (5 mg/kg)] decomposition in barley and wheat flour during beer and bread making. During the bread making process, BEA reduction ranged from 75 to 95%.8 van der
Stegen et al., in the Netherlands, studied green coffee contaminated by OTA and showed that during the roasting time which lasted from 2.5 to 10 minutes, OTA was reduced 69%.9 Kristensen
et al., in Denmark, using 64 °C for 10.5 minutes, reduced 99% of the yeast and 98% of the filamentous fungi in rye bread and confirmed that drum drying did not destroy OTA.10 In
another study in Iran, Gholampour Azizi reported that from 100 grape juice and raisin samples, 32 grape juice and 4 raisin samples had contamination rates higher than that of the EC limit (10 µg/kg).11 The climatic conditions of
Mazandaran province (northern Iran) provide a good environment for fungi growth and mycotoxins occurrence such as OTA (because in northern regions of Iran, the weather is humid and mild). Bread is the most consumed food in the world and Iran. Therefore, the purpose of this study was to evaluate OTA in several bread samples, based on different temperatures and durations of heating, using the competitive direct enzyme-linked immunosorbent assay (CD-ELISA) method in Babol city (Mazandaran province, Northern Iran).
Materials and Methods
In this study, 32 samples from 4 bakeries (8 samples per bakery: 1 sample of flour and 7
samples of bread) in Babol were randomly collected. The constant temperature and time of heating in each bakery, which prepared normal bread, were bakery A: 320 °C and 6 minutes, B: 185 °C and 8:45 minutes, C: 280 °C and 6:30 minutes, and D: 200 °C and 8:30 minutes. Samples from each bakery included: 1 sample of wheat flour (the flour with which bread was baked and was the basis for other samples and it was not heated), 1 sample of normal bread baked for the original time and with constant temperature of heating in the bakeries, 1 sample baked for the original time and constant temperature increased by 20 °C from the original temperature of heating in the bakeries, 1 sample baked for the original time and constant temperature deducted by 20 °C, 1 sample baked for the original time and constant temperature deducted by 40 °C, 1 sample baked constantly with the original temperature and time of heating increased by 2 minutes, 1 sample baked constantly with the original temperature and time of heating deducted by 2 minutes, 1 sample baked constantly with the original temperature and time of heating deducted by 4 minutes.
In this procedure all samples were dried and ground to powder. Subsequently, 20 g of each sample was mixed with 100 cc of 70% methanol in a blender, and then, the mixture was shaken in an Erlenmeyer flask continuously for 3 minutes. After settling, the extract was filtered with Whatman filter paper No.1(Kamyab Tabib Tajhiz, Iran).12
hydrogen peroxide was used as a substrate for color development. After the washing phase, 100 µl of enzyme substrate was added to wells and incubated at room temperature for 5 minutes. After this step, a blue color was observed in the wells. Finally, 100 µl of stopping solution was added to stop the reactions, as a result, the blue color changed to yellow. The color intensity was inversely proportional to the OTA concentration and was measured with the ELISA reader in the wavelength of 450-630 nm (according to the manufacturer's instructions).
Data were calculated by a nonparametric Kruskal-Wallis test (to check normality of data) using SPSS software (version 18, SPSS Inc., Chicago, IL, USA) (P < 0.05).
Results and Discussion
Results of OTA reduction in bakeriesIn bakery A, the highest reduction percentage of OTA (16.53%) was observed when the bread sample was baked in a constant temperature (320 °C) and time was increased by 2 minutes (8
minutes) from the original time (6 minutes). The lowest reduction (9.09%) was observed with a constant temperature (320 °C) and the deduction of time by 4 minutes (2 minutes) in the same bakery (Table 1).
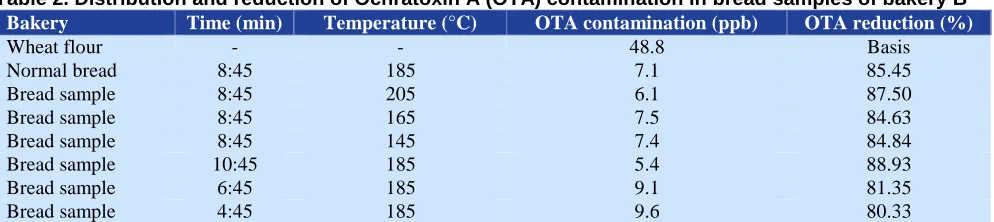
In bakery B, the highest percentage of OTA reduction (88.93%) was observed in bread samples baked in constant temperature (185 °C) in the same bakery and time increased by 2 minutes (10:45 minutes) from the original time (8:45 minutes). The lowest reduction (80.33 %) of this toxin in bakery B was observed in samples baked in constant temperature (185 °C) and time deducted by 4 minutes (4:45 minutes) (Table 2).
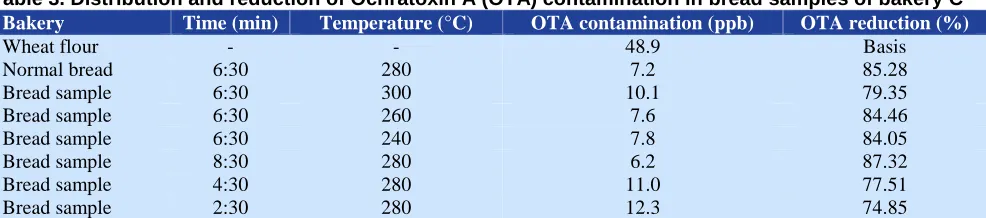
In bakery C, the highest percentage of OTA reduction (87.32%) was observed in bread sample baked in a constant temperature (280 °C) in the same bakery and time increased by 2 minutes (8:30 minutes) from the original time (6:30 minutes). The lowest reduction (74.85%) of this toxin in this bakery was observed in a constant temperature (280 °C) and when time was deducted by 4 minutes (2:30 minutes) (Table 3).
Table 1. Distribution and reduction of Ochratoxin A (OTA) contamination in bread samples of bakery A
Bakery Time (min) Temperature (°C) OTA contamination (ppb) OTA reduction (%)
Wheat flour - - 48.4 Basis
Normal bread 6 320 41.2 14.88
Bread sample 6 340 41.4 14.46
Bread sample 6 300 42.1 13.02
Bread sample 6 280 43.5 10.12
Bread sample 8 320 40.4 16.53
Bread sample 4 320 43.5 10.12
Bread sample 2 320 44.0 9.09
Normal bread: Bread prepared in constant temperature and duration of heating in any bakery without a change in those factors; Basis: flour not affected by different temperatures and durations of heating for reduction of OTA and chosen as the basis for comparison with the bread samples; OTA: Ochratoxin A
Table 2. Distribution and reduction of Ochratoxin A (OTA) contamination in bread samples of bakery B
Bakery Time (min) Temperature (°C) OTA contamination (ppb) OTA reduction (%)
Wheat flour - - 48.8 Basis
Normal bread 8:45 185 7.1 85.45
Bread sample 8:45 205 6.1 87.50
Bread sample 8:45 165 7.5 84.63
Bread sample 8:45 145 7.4 84.84
Bread sample 10:45 185 5.4 88.93
Bread sample 6:45 185 9.1 81.35
Bread sample 4:45 185 9.6 80.33
*
Table 3. Distribution and reduction of Ochratoxin A (OTA) contamination in bread samples of bakery C
Bakery Time (min) Temperature (°C) OTA contamination (ppb) OTA reduction (%)
Wheat flour - - 48.9 Basis
Normal bread 6:30 280 7.2 85.28
Bread sample 6:30 300 10.1 79.35
Bread sample 6:30 260 7.6 84.46
Bread sample 6:30 240 7.8 84.05
Bread sample 8:30 280 6.2 87.32
Bread sample 4:30 280 11.0 77.51
Bread sample 2:30 280 12.3 74.85
Normal bread: Bread prepared in constant temperature and time in bakery without change in the temperature and time of heating; Basis: flour not affected by different temperatures and durations of heating for reduction of OTA and chosen as the basis for comparison with the bread samples; OTA: Ochratoxin A
Table 4. Distribution and reduction of Ochratoxin A (OTA) contamination in bread samples of bakery D
Bakery Time (min) Temperature (°C) OTA contamination (ppb) OTA reduction (%)
Wheat flour - - 48.8 Basis
Normal bread 8:30 200 8.4 82.79
Bread sample 8:30 220 7.7 84.22
Bread sample 8:30 180 8.4 82.79
Bread sample 8:30 160 9.6 80.33
Bread sample 10:30 200 7.6 84.43
Bread sample 6:30 200 8.9 81.76
Bread sample 4:30 200 9.8 79.92
Normal bread: Bread prepared in constant temperature and time in bakery without change in the temperature and time of heating; Basis: flour not affected by different temperatures and durations of heating for reduction of OTA and chosen as the basis for comparison with the bread samples; OTA: Ochratoxin A
In bakery D, the highest percentage of reduction in this toxin (84.43%) was observed in constant temperature of 200 °C and when time was increased by 2 minutes (10:30 minutes) from the original time (8:30 minutes). the Lowest reduction of OTA (79.92%) was observed in the constant temperature of 200 °C and when the time was deducted by 4 minutes (4:30 minutes) from the original time (8:30 minutes) (Table 4). In all bakeries, it was specified that temperature and time of heating are prominent factors for reduction of OTA in bread samples. All bread samples showed less OTA contamination than raw flour.
Results of statistical analysis
The results indicate that in all bakeries, OTA level is higher than recommended standard values. Depending on the OTA amount in wheat flour, different temperatures and times of heating caused significant reductions in OTA level in bread (P < 0.05), which ranged from 9.09-16.53%,
80.33-88.93%, 77.51-87.32%, and 79.92-84.43% in bakeries A, B, C, and D, respectively.
More information about this toxin and comparison with other studies
OTA is a type of mycotoxin that occurs frequently in cereals and can be found in starch-rich foods such as grains, cereal, and bread.13,14
Valle-Algarra et al.,13 in Spain, showed that OTA
that OTA decreased only a small amount during the bread making process.15 We showed that the
highest rates of reduction in bakeries A, B, C, and D were 16.53% (8 minutes, 320 °C), 88.93% (10:45 minutes, 185 °C), 87.32% (8:30 minutes, 280 °C), and 84.43% (10:30 minutes, 200 °C), respectively. Different researches reported that food processing (cleaning, milling, baking, and fractionating), hygienic conditions, and workers' health in the bakeries can be effective on the levels of mycotoxin contamination of flour and bread.14-16 Pacin et al., in Argentina, after studying
several wheat flour samples, reported that French bread and Vienna bread were contaminated with deoxynivalenol (DON) (35.5 µg/kg and 22 µg/kg, respectively). OTA was not detected in the flour in their study. A 33 and 58.5% reduction in DON after the bread making process was observed in French bread and Vienna bread, respectively.17 In our study, 32 samples were
contaminated by this toxin. Common processes in manufacturing and physical treatment of grain, such as scouring and cleaning the grain prior to milling, can reduce the initial contamination by mycotoxins in the raw material used for bakery and bread making.17,18 Osborne et al. showed that
when OTA was added to flour samples which were subsequently baked into bread, it was recovered after the baking processes without becoming decomposed.19 Furthermore, in our
study, toxins, in some cases, were destroyed in the samples. For example, in bakery A samples, the level of OTA was higher than the other samples. This toxin has a moderately stable molecule and is able to survive most food processes; thus, it is only partly destroyed during cooking and bread making processes. Baking and roasting bread can reduce the existing OTA content up to 20%.20,21 Castells et al., in Spain,
reported that the cooking temperature of 160 °C applied for 70 seconds reduces OTA up to 86% in barley bread.22 In our research, the highest
reduction (88.93%) of OTA was observed when the bread sample was baked in a constant temperature (185 °C) and 2 minutes was added to the original time (10:45) (bakery B). Different
factors that influence the OTA content and quantity in food products are: different ecological niches of the ochratoxigenic mycobiota, such as Aspergillus spp. and Penicillium verrucosum, and accurate agricultural practices, such as better harvest procedures and storage conditions, the type of grains, nature and extent of technological advancements in agricultural equipments.12,23
Since most wheat flour is processed into various foods such as bread and consumption of a food that is contaminated by OTA causes different diseases in humans, greater attention should be paid to OTA in wheat and wheat products. Results of our study are effective in the management, detection, and reduction of fungi growth and OTA production in food.
Conclusion
In this study, OTA concentration in several samples was measured after employing different temperatures and durations of heating using ELISA. Therefore, we can conclude that there was a significant relationship between OTA reduction in the samples, and temperature and durations of heating (P < 0.05). The highest rate of reduction in OTA was observed when a constant temperature was maintained in each bakery and when the time of heating was increased by 2 minutes from the original time.
Conflict of Interests
Authors have no conflict of interests.
Acknowledgements
The Faculty of Microbiology, Research Branch, Islamic Azad University, Babol, and the Islamic Azad University, Tonekabon Branch, Iran, supported this study.
References
2. Pohland AE, Nesheim S, Friedman L. Ochratoxin A: A review. Pure and Applied Chemistry 1992; 64(7): 1029-46.
3. Tam J, Pantazopoulos P, Scott PM, Moisey J, Dabeka RW, Richard ID. Application of isotope dilution mass spectrometry: determination of ochratoxin A in the Canadian Total Diet Study. Food Addit Contam Part A Chem Anal Control Expo Risk Assess 2011; 28(6): 754-61.
4. Rosa CA, Keller KM, Keller LA, Gonzalez Pereyra ML, Pereyra CM, Dalcero AM, et al. Mycological survey and ochratoxin A natural contamination of swine feedstuffs in Rio de Janeiro State, Brazil. Toxicon 2009; 53(2): 283-8.
5. Gholampour Azizi I, Rahimi K, Shateri S. Ochratoxin: Contamination and Toxicity (A Review). Global Vet 2012; 8(5): 519-24.
6. Bento JMV, Pena A, Lino CM, Pereira JA. Determination of ochratoxin a content in wheat bread samples collected from the Algarve and Bragan+ºa regions, Portugal: Winter 2007. Microchemical Journal 2009; 91(2): 165-9.
7. Institute of Standards & Industrial Research of Iran. Food and feed- mycotoxins: maximum tolerated level. 1st ed. Tehran, Iran: Institute of standards and industrial research of Iran (ISIRI) .p. 3-20; 2002. 8. Meca G, Zhou T, Li XZ, Manes J. Beauvericin
degradation during bread and beer making. Food Control 2013; 34(1): 1-8.
9. van der Stegen GH, Essens PJ, van der Lijn J. Effect of roasting conditions on reduction of ochratoxin a in coffee. J Agric Food Chem 2001; 49(10): 4713-5. 10. Kristensen EF, Elmholt S, Thrane U. High-temperature
Treatment for Efficient Drying of Bread Rye and Reduction of Fungal Contaminants. Biosystems Engineering 2005; 92(2): 183-95.
11. Gholampour Azizi E. Evaluation of the presence of Ochratoxin in grape juices and raisins. J Food Technol Nutr 2012; 9(1): 95-100.
12. Gholamour Azizi I, Rouhi S. The Comparison of Total Fumonisin and Total Aflatoxin Levels in Biscuit and Cookie Samples in Babol City, Northern Iran. Iranian Journal of Public Health 2013; 42(4): 422-7.
13. Valle-Algarra FM, Mateo EM, Medina A, Mateo F, Gimeno-Adelantado JV, Jimenez M. Changes in ochratoxin A and type B trichothecenes contained in wheat flour during dough fermentation and bread-baking. Food Addit Contam Part A Chem Anal Control
Expo Risk Assess 2009; 26(6): 896-906.
14. Lasram S, Belli N, Chebil S, Nahla Z, Ahmed M, Sanchis V, et al. Occurrence of ochratoxigenic fungi and ochratoxin A in grapes from a Tunisian vineyard. Int J Food Microbiol 2007; 114(3): 376-9.
15. Scudamore KA, Banks J, MacDonald SJ. Fate of ochratoxin A in the processing of whole wheat grains during milling and bread production. Food Addit Contam 2003; 20(12): 1153-63.
16. Roohi S, Gholampour Azizi I, Hashemi M. Fumonisin contamination based on flour quality used inbakeries and confectioneries in Qaemshahr (city of theNorthern Iran). African Journal of Microbiology Research 2012; 6(8): 1815-8.
17. Pacin A, Ciancio Bovier E, Cano G, Taglieri D, Hernandez Pezzani C. Effect of the bread making process on wheat flour contaminated by deoxynivalenol and exposure estimate. Food Control 2010; 21(4): 492-5. 18. Food and Agriculture Organization of the United Nations. Joint fao/who food standards programme. Codex committee on food additives and contaminants [Online]. [cited 1998]; Available from: URL:
http://www.iss.it/binary/cnra/cont/position%20paper%2 0ochratoxin%20A.1121359601.pdf
19. Osborne BG, Ibe F, Brown GL, Petagine F, Scudamore KA, Banks JN, et al. The effects of milling and processing on wheat contaminated with ochratoxin A. Food Addit Contam 1996; 13(2): 141-53.
20. Centre for Food Safety. Risk Assessment Studies Report No. 19 [Online]. [cited 2013]; Available from: URL:
http://www.cfs.gov.hk/english/programme/programme _rafs/programme_rafs_ft_01_02_mcfs.html
21. Kolossova A, Stroka J, Breidbach A, Kroeger K, Bouten K, Ulberth F. Evaluation of the effect of mycotoxin binders in animal feed on the analytical performance of standardised methods for the determination of mycotoxins in feed follow-up study. Geel, Belgium: European Commission Joint Research Centre Institute for Reference Materials and Measurements; 2011.
22. Castells M, Pardo E, Ramos AJ, Sanchis V, Marin S. Reduction of ochratoxin A in extruded barley meal. J Food Prot 2006; 69(5): 1139-43.