Iranian Journal of Economic Studies
Journal homepage: ijes.shirazu.ac.ir
The Effect of Technological Structure Change on Total Output: An Input-Output Analysis
Ramezan Hosseinzadeha, Nooraddin Sharifyb
a. Department of Economics, University of Sistan and Baluchestan, Zahedan, Iran. b. Department of Economics, University of Mazandaran, Babolsar, Iran.
Article History Abstract
Received date: 29 January 2018 Revised date:28 June 2018 Accepted date: 11 July 2018 Available online: 29 July 2018
In this study, the Input- Output Structural Decomposition Analysis (I-O SDA) is used to investigate the effects of technological structure changes on changes of total output in Sistan and Baluchestan Province during 2006-2011. The technological structure change is decomposed into two factors: intermediate input structure changes (input substitution) and change in direct backward linkage. The results show that the effect of changes in direct backward linkage is negative in all sectors, but the effect of input substitution in twelve sectors is positive and in other nine sectors is negative. Input substitutions in "Agriculture" and "Transport" sectors have the main positive effect on total output of the region and in ''Food industries'' and ''Restaurants & Hotels'' have the main negative effect on total output. This factor caused 20.89 billion Rials decrease in total output of region. Changes in direct backward linkage caused 8270.89 billion Rials decrease in total output of the region. JEL Classification:
I25 I21 Q56
Keywords: Input-Output
Structural Decomposition Analysis Technological Changes
Sistan and Baluchestan Province
1. Introduction
Economic growth is affected by several factors. One of these factors is technological structure changes. Economists state that technological structure changes play a major role in economic growth and development. They also state that the use of production inputs, such as primary inputs and intermediary inputs
are related to the technological structure of production (Pan, 2006).
Technological structure changes may occur in different sectors and lead to different paths of economic growth. Different technological structures have different effects on economic growth. These effects depend on the economic
structure and development level of economy (Çalliskan, 2015).
The input-output model has been used to examine the technological structure of economies in different countries, because it presents the interindustry relationships in economy and production technological structure
also. In this method, the changes in outputs between two periods can be decomposed into two parts. First part that reflect the technological structure changes is shown with changes in technical coefficients in these tables. Second part is related to changes in final demand of economy over the period of time (Miller and Blair, 2009). Technical coefficients in this method change through
technological changes (Rose, 1995). On the other hand, changes in the technical
coefficient matrix reflect different aspects of technological structure changes, including changes in structure of intermediate inputs (input substitutions), for example replacing metals with plastics in automobiles, and changes in backward linkages of sectors, for example substitutions domestically produced inputs
instead of imported ones and vice versa (Miller and Blair, 2009).
Sistan and Baluchestan is a border region in Southeast of Iran with low level of income and employment. Volume of contraband goods in this province was very high. However, during 2006-2011 the borders of the province were extremely limited and the volume of smuggled goods fell sharply. This can lead to changes the total domestic intermediate inputs that is used in domestic sectors (changes in backward linkages of sectors) and, consequently, technological structure of production in different sectors is changed in this province. Another change that occurred during the study in Iran and the related regions is the fluctuation of important economic variables, such as changes in relative prices. This led to changes in intersectoral transactions or input substitution between different sectors and technological structure changes in this province.
As mentioned above, Sistan and Baluchestan province is one of the provinces with low level of income in the country. Therefore, recognition of its economic structure and the analysis of growth drivers and inhibitors is essential in the province. On the other hand, changing the technological structure can be one of the sources of production growth in various economic sectors of the province. However, these changes may not always lead to desired economic growth. Therefore, regional policymakers should pursue favorable policies to achieve regional growth and desired changes in other variables such as employment. Study of effect of technological structure changes can help policymakers to pursue the appropriate policies.
The paper contains five sections. In the second section, previous studies are presented. Section 3 addresses methodology and data. Section 4 presents the results. Finally, the concluding and policy implications are drawn in the last section.
2. Literature Review
Many studies used the I-O SDA method for decomposition of output,
employment, value added, energy consumption and CO2 emission in economic
sectors. These studies can be classified into two groups. First, a group of studies has only focused on the overall change of technical coefficients (technological structure change) in I-O tables between two periods and examines the effect of this change on different variables such as gross output. In some other studies, changes in technical coefficients is decomposed into two or three parts.
Initial studies in first group include Chenery et al. (1962), Barker (1990),
and Miller and Shao (1994). Chenery et al. (1962) was the first study that used this method in Japan’s economy to examine the effect of technological structure
change on output growth. Barker (1990) decomposed the changes in output of
market service industries in the UK into technological changes and changes of level and structure of final demand. The results showed that the technological
changes had a little effect on output growth in the study period. Miller and Shao
(1994) used the I-O SDA method in US multiregional tables for decomposition
of output during 1963-1977. Liu and Saal (2001) examined the effect of input
structure changes on gross output in South Africa during 1975–1993. Bazzazan
and Mohammadi (2007) studied the growth of industry output in Iran during 1988-1993 and 1993-1999. The results of this study indicated the changes in
input-output coefficients during 1988-1993. Bazzazan and Mohammadi (2008)
used the SDA to identify the effects of technological changes on industrial
output in Iran during 1988-1993 and 1993-1999 period. Bokaei and Banouei
(2011) used SDA to examine the share of factors that affect the output growth
during 1986-2006. The results of this study showed that changes in technology
had a little effect on output growth. Ansari et al. (2012) focused on changes of
output in agriculture sector during 1986-1991 and 1991-2001 periods. The results show that during 1986-1991 periods, the main factor of output’s growth in the agriculture and horticulture was expansion of intermediate demand
(changes in technology structure) and investment. Zuhdi (2012) examined the
effect of creative industry for Indonesia using input-output SDA method.
Moreover, Bekhet (2013) investigated the changes of technological structure in
Malaysia over the period 1980–2005. Los et al. (2015) decomposed the changes
in employment in china between 1995 and 2001 into some factors including
technological structure, using global input-output model. Also, Fotros et al.
(2014) used this method to analyze CO2 emission in Iran. In another study, Ansari and Salami (2015) investigated the effect of technological changes on
output of agriculture sector in Iran during 1986-2001. Su et al. (2017)
Some other studies decomposed the technological changes into a number of
separate components including Linden and Dietzenbacher (2000), Pan (2006),
Wei et al. (2016), and Llop (2017). Linden and Dietzenbacher (2000)
decomposed the effects of technological change into three factors, including average input substitution, intermediate input intensity, and cell-specific effects. In Pan’s (2006) study, input coefficient matrix was decomposed into old
technical process and new technical process. Furthermore, Wei et al. (2016)
examined the CO2 emissions in Beijing industries during 2000-2010. In the
present study, input-output coefficients were classified into technology and
sectoral connection. Llop (2017) developed the SDA method to decompose
changes in technology into production effects, substitution effects, and the mixed effects.
3. Methodology and Data 3.1 Methodology
In this study, I-O SDA method is used to measure the effects of technological structure changes on output. To do so, the basic input-output model is implemented:
Y C Y A I
Q( )1. . 1
where, Q is the vector of output, A denotes technical coefficient, C refers the
Leontief inverse matrix, and Y is final demand. According to Eq. (1), changes in
Q can be decomposed to changes in final demand (Y) and changes in Leontief
inverse matrix (Miller and Blair, 2009).
Y C C Y Y C
Q
).
2 ( ) 2
.( 0 1 0 1 2
where Δ refers to the changes of variables, 0 and 1 in C and Y indicate the
amount of these variables in the initial and the current periods of time. The first term in Eq. (2), represents the share of changes in Leontief inverse matrix on output changes. The second term shows the share final demand. The changes in
the Leontief inverse matrix decomposedas follows (Ibid)
.
0 1.( A).C C C
3
Replacing Eq. (3) in Eq. (2) yields: Y C C Y Y C A C
Q
). 2 ( ) 2 .( .
. 0 0 1 0 1
1 4
For an n-sector economy, the ΔA can be decomposed into N terms as:
n j j nj A A
A A A 1 ) ( ) ( ) 1 ( ... ... 5
whereΔAjrepresents to the technological changes in sector j.
In this study
A
jis decomposed into two matrices, Sj and Tj. The matrix Sj isn×n that all columns are zero except the jth column. The elements of the jth
column of this matrix represent the share of sectors in total intermediate
consumption of sector j, in which[ ][ ] [
n ]i ij ij
ij a a
s . In other words, this matrix
shows the input structure within sector j.
Matrix Tj is an n×n diagonal matrix that measures the total direct
intermediate consumption coefficient of sector j or direct backward linkage of
sector j. 0 0 0 0 1 nj j j s s S
0 0 0 0 0 0 1 n i ij j a TThus, the changes in technical coefficient of sector j can be written as:
j j j j j j
j S T T S S T
A
).
2 ( ) 2
.( 0 1 0 1
)
( 6
Substitution of Eq. (5) and (6) in first term in Eq. (4) yields total output changes of sectors caused by technological changes in sectors as:
) 2 ( . ). 2 .( ) 2 .( ) 2 .( . ... ) 2 ( . ). 2 .( ) 2 .( ) 2 .( . ... ) 2 .( . ). 2 .( ). 2 .( ). 2 .( . 1 0 0 ) ( 1 0 1 1 0 0 1 0 ) ( 1 1 0 0 ) ( 1 0 1 1 0 0 1 0 ) ( 1 1 0 0 ) 1 ( 1 1 1 0 1 1 0 0 1 1 1 0 ) 1 ( 1 Y Y C T S S C Y Y C T T S C Y Y C T S S C Y Y C T T S C Y Y C T S S C Y Y C T T S C Q n n n n n n j j j j j j 7
The right-hand side of Eq. (7) contains 2×n terms (n for the number of
sectors and two for two factors: input substitution and backward linkages). The
first part in right-hand side, ( )
2 .( ). 2 .(
. 0 1
0 1 1 1 0 ) 1 ( 1 Y Y C T T S
C ) measures the effects of
input substitution in sectors 1 on total output. The second part
)) 2 .( . ). 2 .(
( (1) 0 0 1 1 1 1 0 1 Y Y C T S S
C measures the effect of changes in direct backward
The final two parts of this equation represents the effects of input
substitution ( )
2 .( ) 2 .(
. ( ) 0 1 0 0 1 1
Y Y C T T S C
n n
n
) and changes in direct backward
linkages in sector n ( )
2 ( . ). 2
.( 0 1 ( ) 0 0 1 1
Y Y C T S S
C n
n
n
), respectively.
3.2 Data
In this study, the input-output tables of Sistan and Baluchestan region for the years 2006 and 2011 is used as database of the model. In order to prepare the regional tables from national one, there needs to be national domestic input-output tables. These tables for two years have been received from the Office of Economic Studies at the Research Center of the parliament of Islamic republic of Iran. These tables have been prepared by updating the input-output table of the year 2001 by this research center.
At the next level, for the preparation of domestic national I-O tables (domestic transaction matrix) from total national I-O tables (total transaction
matrix), the method presented in Miller and Blair (2009) has been used (Method
2, pp. 150-151). After preparing the domestic transactions matrices, Augmented
Flegg Location Quotient (AFLQ) method (Flegg and Tohmo, 2011) was used to
construct regional I-O tables. In this method, the sectoral employment data is needed in regional and national level. However, due to lack of sectoral employment data, the sectoral output data was used for construction of regional I-O tables. In this method, the choice of most appropriate δ value is very
important. The Bazzazan and Mohammadi (2007) method was employed to
determine the best value for regionalization of national tables (δ). The appropriate value of δ coefficient for Sistan and Baluchestan province was 0.4 in 2006 and 0.8 in 2011. Other data including the national and regional sectoral output were prepared from the Annual National Accounts and Annual Regional
Accounts of the Statistics Center of Iran1.
Price changes in sectors during study periods could change the technical coefficients in I-O tables. For calculation of the real changes in technical coefficients, the I-O tables had to be deflated to constant prices. For this reason, at the final level, to eliminate the effects of price changes on input-output table of the year 2011, this table is deflated to the price of the year 2006 using Double Deflation method. To this end, it is assumed that the national price indices of sectors were equal to the corresponding indices at the national ones. The price indices is calculated by dividing the implicit price indices of sectors for the year 2011 by the corresponding ones for the year 2006. The implicit price indices were calculated using sectoral output in current prices and the corresponding output at the constant prices for the years 2006 and 2011. Sectoral output in constant and current prices is obtained from Central Bank of Islamic Republic of Iran.
4. Data Analysis and Empirical Results
4.1 Structure of Output in Sistan and Baluchestan (S & B) Province
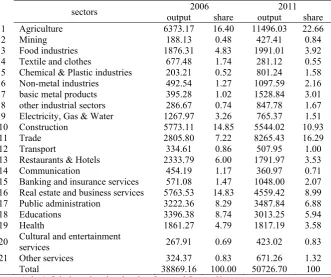
Structure of output in Sistan and Baluchestan is shown in Table 1. According to this table, total output of this province was 38869.16 billion Rials in 2006 and this amount is increased to 50726.70 billion Rials in 2011.
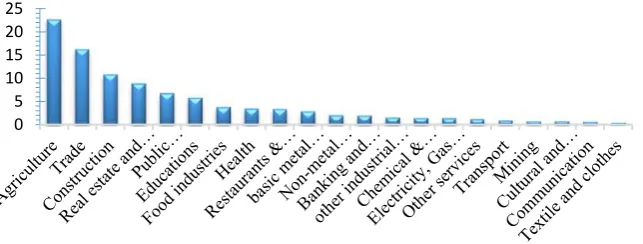
Share of each sector in total output of region is shown in Fig. 1. As it shown in this Fig., “Agriculture”, “Construction”, and “Real estate and business services” are the three sectors that had the main share in output of region. The share of these sectors in total output of region is 16.40%, 14.85% and 14.83%. Output of these sectors was 6373.17, 5773.11 and 5763.53 billion Rials, respectively.
Table 1. Structure of output in Sistan and Baluchestan (Billion Rials)
sectors output 2006 share output 2011 share
1 Agriculture 6373.17 16.40 11496.03 22.66
2 Mining 188.13 0.48 427.41 0.84
3 Food industries 1876.31 4.83 1991.01 3.92
4 Textile and clothes 677.48 1.74 281.12 0.55
5 Chemical & Plastic industries 203.21 0.52 801.24 1.58
6 Non-metal industries 492.54 1.27 1097.59 2.16
7 basic metal products 395.28 1.02 1528.84 3.01
8 other industrial sectors 286.67 0.74 847.78 1.67
9 Electricity, Gas & Water 1267.97 3.26 765.37 1.51
10 Construction 5773.11 14.85 5544.02 10.93
11 Trade 2805.80 7.22 8265.43 16.29
12 Transport 334.61 0.86 507.95 1.00
13 Restaurants & Hotels 2333.79 6.00 1791.97 3.53
14 Communication 454.19 1.17 360.97 0.71
15 Banking and insurance services 571.08 1.47 1048.00 2.07
16 Real estate and business services 5763.53 14.83 4559.42 8.99
17 Public administration 3222.36 8.29 3487.84 6.88
18 Educations 3396.38 8.74 3013.25 5.94
19 Health 1861.27 4.79 1817.19 3.58
20 Cultural and entertainment services 267.91 0.69 423.02 0.83
21 Other services 324.37 0.83 671.26 1.32
Total 38869.16 100.00 50726.70 100
Source: Author’s Calculation based on data from Statistical Center of Iran
Figure 1. Share of sectors in total output in 2006
Source: Author’s Calculations
“Education”, “Public administration” and “Trade” ranked next in terms of the share in total output. According to Figure 1, industry subsectors such as “Textile and Clothes”, “Non-metal industries”, and “Basic metal products” have a small share in total production of region in 2006. This has many reasons, one of which is low level of investment in the industry subsectors in the province. The importation of various types of smuggled industrial goods is another reason for this. The “Food industries” has the largest share among the industrial subsectors in total output of region. Share of each sector in total output of region is shown in Figure 2.
Figure 2. Share of sectors in total output in 2011
Source: Author’s Calculations
Figure 2 shows that the top three sectors, which had the main share in total output in 2011, are “Agriculture” with 22.66%, “Trade” with 16.29%, and “Construction” with10.93percentage. Output of these sectors is 11496.03 billion Rials, 8265.43 billion Rials and 5544.02 billion Rials in 2011. “Real estate and business service”, “Public administration” and “Educations” have the rank of
4th, 5th and 6th in share of total output in this year.
0 5 10 15 20
Three sectors including “Textile and Clothes” with 0.55%, ”Communication“ with 0.71%, and “Cultural and Entertainment services” with 0.83% are the three sectors that have the lowest share in total output of region in 2011.
Comparing the share of sectors in two years shows that the structure of regional output has changed during the study period. Share of “Trade” sector is increased from 7.22% in 2006 to 16.29% in 2011. The share of “Agriculture” sector is increased from 16.40% in 2006 to 22.66% in 2011. The share of “Construction” sector is decreased from 14.85% to 10.93% during the study period. “Cultural and Entertainment services” and “Mining” are the two sectors, which gave the lowest share in total output of region in both years.
4.2 Empirical Results
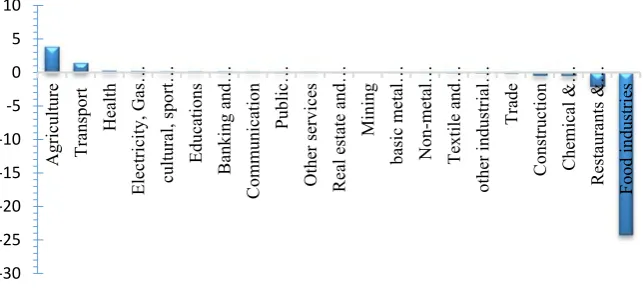
Effect of changes of technological structure in sectors on regional output is shown in Table 2. According to the results, while the effects of changes in direct backward linkage are negative in all sectors, the effects of input substitution in 12 sectors are positive and in nine sectors are negative. Effect of input substitution on total output is shown in column S and Fig. 3. This factor caused 20.89 billion Rials decrease in total output of region.
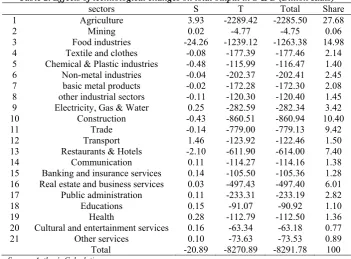
Table 2. Effects of technological changes on total output in S & B (Billion Rials)
sectors S T Total Share
1 Agriculture 3.93 -2289.42 -2285.50 27.68
2 Mining 0.02 -4.77 -4.75 0.06
3 Food industries -24.26 -1239.12 -1263.38 14.98
4 Textile and clothes -0.08 -177.39 -177.46 2.14
5 Chemical & Plastic industries -0.48 -115.99 -116.47 1.40
6 Non-metal industries -0.04 -202.37 -202.41 2.45
7 basic metal products -0.02 -172.28 -172.30 2.08
8 other industrial sectors -0.11 -120.30 -120.40 1.45
9 Electricity, Gas & Water 0.25 -282.59 -282.34 3.42
10 Construction -0.43 -860.51 -860.94 10.40
11 Trade -0.14 -779.00 -779.13 9.42
12 Transport 1.46 -123.92 -122.46 1.50
13 Restaurants & Hotels -2.10 -611.90 -614.00 7.40
14 Communication 0.11 -114.27 -114.16 1.38
15 Banking and insurance services 0.14 -105.50 -105.36 1.28
16 Real estate and business services 0.03 -497.43 -497.40 6.01
17 Public administration 0.11 -233.31 -233.19 2.82
18 Educations 0.15 -91.07 -90.92 1.10
19 Health 0.28 -112.79 -112.50 1.36
20 Cultural and entertainment services 0.16 -63.34 -63.18 0.77
21 Other services 0.10 -73.63 -73.53 0.89
Total -20.89 -8270.89 -8291.78 100
As shown in Figure 3, input substitution in “Agriculture” and “Transport” sectors have the main positive effect on total output. This factor caused 3.93 increase and 1.46 billion Rials in total output, respectively.
Investigation of share of sectors in total intermediate inputs used in Agricultural sector shows that the share of “Agricultural products” and “Business services” are increased in total input of these sectors. On the other hand, “Agricultural” sector is an important sector in economy of this region for providing the intermediate input for regional sectors. For this reason, the input substitution in this sector caused an increase in output of the province.
The share of “Agricultural” products is also increased in total inputs of “transport” sector.
Input substitution in “'Food industries” and “Restaurants & Hotels” have the main negative effect on total output. Input substitution in these two sectors caused to decrease 24.26 billion Rials and 2.10 billion Rials in total output of region. One of the reasons for negative effects of input substitution in “Food industries” is increment of the share of “Chemical & Plastic industries” and “Basic metal and metal products” in total input used by “food industries”. These two sectors are the weak sectors in the economy of the province and have the low linkages with other domestic sectors.
Figure 3. Effect of input substitution on total output of S & B (Billion Rials)
Source: Author’s Calculations
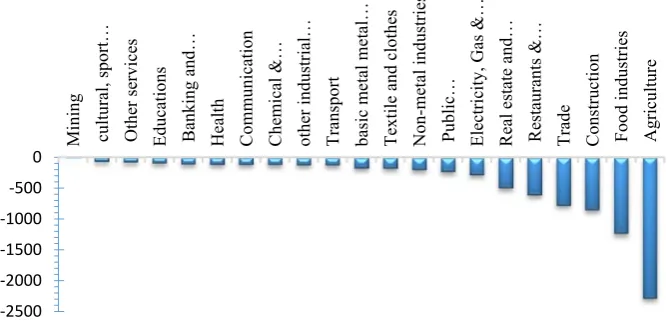
The effect of changes in direct backward linkage of sectors is shown in column T in table 2 and Figure 4. According to the results, this factor caused a decrease of 8270.89 billion Rials in total output. Most of this decline is due to changes in the direct backward linkage “Agriculture”, “Food industries” and “Construction” sectors. Changes of direct backward linkages in these sectors caused a reduction of 2289.42 billion Rials, 1239.12 billion Rials and 860.51 billion Rials in total output. The sum of these three values (4389.05 billion Rials) is 53.07% of the total decrease in output due to the change in the direct backward linkage coefficient (8270.89 billion Rials).
‐30 ‐25 ‐20 ‐15 ‐10 ‐5 0 5 10
Agriculture Transpor
t
Heal
th
El
ect
ric
ity,
Gas
…
cultural, sport…
Educations
Banking and…
Comm
unica
tion
Public…
O
the
r s
er
vice
s
Rea
l e
st
at
e
and…
Mining
basic
m
eta
l…
Non-m
eta
l…
Textile and…
other industrial…
Tra
de
Construction Chemical &…
R
es
ta
urant
s
&
…
An examination of change in the direct backward linkage coefficients in these sectors shows that direct backward linkage coefficient of these sectors declined sharply during the study period. This indicates that these sectors imported the intermediate inputs from outside of the region. On the other hand, “Agriculture” and “Food industries” are the key sectors of this province and have the strong linkages with other domestic sectors, hence, the decline in production of these sectors led to a sharp decrease in the output of the province. Unlike these sectors, backward linkage in “Mining”, “Cultural, Sport and Entertainment services” and “Other services” caused less reduction in total output in region.
Figure 4. Effect of changes in direct backward linkage on total output of S & B (billion Rials)
Source: Author’s Calculations
Amounts of reduction in total output due to changes in direct backward linkage in these sectors are 4.77 billion Rials, 63.34 billion Rials and 73.63 billion Rials. The main reason for this is that these sectors have a weak relationship with other sectors of the region. This phenomenon caused low reduction in regional output due to changes in direct backward linkage of these sectors.
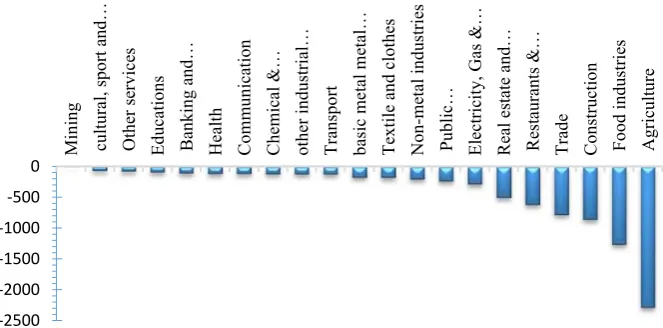
Column 5 (summation of Column 3 and 4) in Table 2 and Figure 5 shows the contribution of overall technological structure changes in sectors on total output of the region. Technological changes in sectors caused a decline 8291.78 billion Rials in total output of the region during the study period. Technological changes in “Agriculture”, “Food industries”, and “Construction” sectors had the main negative effect on total output. Reduction in total output due to changes in technology in these sectors is 2285.50 billion Rials, 1263.38 billion Rials and 86.94 billion Rials, respectively.
The share of these sectors in total reduction of output is 27.56% and 15.24%, and 10.36%, respectively. As mentioned above, these sectors are the
‐2500 ‐2000 ‐1500 ‐1000 ‐500
0 Mining cultural, sport… O
the
r s
er
vice
s
Educations Banking and… Heal
th
Comm
unica
tion
Chemical &… other industrial… Transpor
t
basic
m
eta
l met
al…
Textile and clothes Non-metal industries Public… Elect
ric
ity,
Gas
&…
Rea
l e
st
at
e
and…
Re
st
aura
nts
&
…
Tra
de
key sectors of this province and the reduction in backward linkage of these sectors caused a sharp decline in the output of the province. Unlike these sectors, technological changes in “Mining”, “Cultural, Sport and Entertainment services” and “Other services” caused less reduction in total output in region.
Figure 5. Effect of technological changes on total output of S & B (billion Rials)
Source: Author’s Calculations
Amounts of reduction in total output due to changes in technology in these sectors are 4.75 billion Rials, 63.18 billion Rials and 73.53 billion Rials. The main reason for this result is that these sectors have a weak relationship with other sectors of the region. This phenomenon had the low contribution in reduction of output of the region due to technological changes of these sectors.
5. Concluding Remarks and Policy Implications
I-O SDA method is used in this study to examine the effect of sectoral technological structure changes on regional output in Sistan and Baluchestan province over 2006-2011. The technological structure changes are decomposed to intersectoral input substitution and changes in direct backward linkages. Results of this study show that input substitution in 12 sectors had a positive effect and in other nine sectors are negative. Intersectoral input substitution in Agriculture sector has the main positive effect on regional output. One reason for this phenomenon is that the share of "Agricultural products" and ''Business services'' are increased in total input of this sector during the study period. "Agriculture" sector is a key sector in this region. For this reason, input substitution in this sector has the high positive effect on regional output. Input substitution in ''Food industries'' has the main negative effect in regional output. One of the reasons for this negative effect is that the shares of "Chemical & Plastic industries" and "Basic metal and metal products" have increased in total input of ''Food industries'' during study period. These two sectors are the weak sectors in the economy of the province. So, for more effects of input substitution on total output, sectors should be used the products of sectors that
‐2500 ‐2000 ‐1500 ‐1000 ‐500
0 Mining cultural, sport and… O
the
r s
er
vice
s
Educations Banking and… Heal
th
Comm
unica
tion
Chemical &… other industrial… Transpor
t
basic
m
eta
l met
al…
Textile and clothes Non-metal industries Public… Elect
ric
ity,
Gas
&…
Rea
l e
st
at
e
and…
Re
st
aura
nts
&
…
Tra
de
have the strong linkage with other sectors. Therefore, appropriate solutions should be made by regional decision makers to increase the linkage of sectors in regional economy. One of the policies to increase the linkage of sectors is providing the credit facilities and investment in regional sectors.
Another result of the study showed that changes in direct backward linkage in all sectors caused a reduction in regional output of the province. This is due to a reduction in direct backward linkage coefficient of all sectors in the province during study period. On the other hand, regional sectors imported more intermediate inputs from other regions or abroad. This phenomenon may have two main reasons: one reason is a reduction in investment and a reduction in regional production capacity. These lead to reduction in direct backward linkage of sectors. Other reason for this phenomenon is increased smuggling goods such as "Agriculture products", "Textile and Clothes" and "Trade products". Unfortunately, smuggled goods in this province are very high.
References
Ansari, V., & Salami, H. (2015). Analysis of the effect of technology change on agricultural production growth: Structural decomposition analysis method.
Iranian Journal ofAgricultural Economics and Development, 46, 759-775. Ansari, V., Salami, H., & Saleh, I. (2012). Sources of output growth in agriculture sector using input- output table. Iranian Journal of Agricultural Economics and Development Research, 1, 1-17.
Barker, T. S. (1990). An analysis of the updated 1963 input-output transactions table In Allen R. I. G. and Gosling W. F. (Eds.), Estimating and Projecting Input-Output Coefficients (pp. 57-67). London: Input-Output Publishing Co.
Bazzazan, F., & Mohammadi, N. (2007). Sources of economic growth and Input-Output structural decomposition analysis: The case of Iran, 16th
International Conference on Input-Output Techniques, Istanbul, Turkey. Bazzazan, F., & Mohammadi, N. (2008). Identify the effect of export
development strategy in growth of industrial output (using input-output method). Journal of Quantitative Economics, 5, 131-155.
Bekhet, H. A. (2013). Assessing structural changes in the Malaysian economy: I–O approach. Economic Modelling, 30, 126-135.
Bokaei, M., & Banouei, A. (2011). Analysis of growth and structural changes using input-output tables (1986-2006). Biquarterly Journal of Economic Essays, 8, 205-235.
Çalliskan, H. K. (2015). Technological change and economic growth. Procedia-Social and Behavioral Sciences, 195, 649 – 654.
Chenery, H. B., Shishido, S., & Watanabe, T. (1962). The pattern of Japanese growth. Econometrica, 30, 98–139.
Flegg, A., & Tohmo, T. (2011). Regional input–output tables and the FLQ formula: A case study of Finland. Regional Studies, 5, 703-721.
Fotros, M.H., Barati, J., & Rasoulzadeh, M. (2014). Structural decomposition analysis of CO2 emission in Iran using input-output approach. Quarterly
Energy Economics Review, 41, 131-152.
Linden, J. A., & Dietzenbacher, E. (2000). The determinant of structural changes in the European Union: A new application of RAS. Environment and Planning A, 32, 2205-2229.
Liu, A., & Saal, D. S. (2001). Structural change in apartheid-era South Africa: 1975–1993. Economic Systems Research, 13, 235–257.
Llop, M. (2017). Changes in energy output in a regional economy: A structural decomposition analysis. Energy, 128, 145-151.
Los, B., Timmer, M., & Varies, G. J. (2015). How important are exports for job growth in China? A demand side analysis. Journal of Comparative Economics, 43, 19-32.
Miller, R., E., & Shao, G. (1994). Structural change in the U.S. multiregional economy. Structural Change and Economic Dynamics, 5, 41–72.
Pan, H. (2006). Dynamic and endogenous change of input–output structure with specific layers of technology. Structural Change and Economic Dynamics, 17, 200–223.
Rose, A. (1995). Input–output economics and computable general equilibrium models. Structural Change and Economic Dynamics, 6, 295–304.
Su, B., Ang, B. W., & Li, Y. (2017). Input-output and structural decomposition analysis of Singapore's carbon emissions. Energy Policy, 105, 484–492. Wei, J., Huang, K., Yang, S, Li, Y., Hu, T., & Zhang, Y. (2016). Driving forces
analysis of energy-related carbon dioxide (CO2) emissions in Beijing: An
input-output structural decomposition analysis. Journal of Cleaner Production, 163, 1-11.