Assessment of heart rate variability in patients with chronic stable
angina
Received: 15/7/2010 Accepted: 28/2/2011
Mohammed Hassan Alwan*
Background and objectives:A prospective study performed in Ibn-Albitar hospital a terti-ary center to assess the effect of ischemic heart disease on heart rate variability.
Methods: Thirty nine consecutive patients all with history of chronic stable angina &with positive treadmill test underwent 24 hours holter test to assess heart rate variability. com-pared it with 25 age & sex matched control volunteer group.
Results: Thirty one (79.48%) male of patients group& 20 (80%) male of control group . heart rate variability expressed as (SDNN) standard deviation of normal to normal interval, (RMSSD) square root of the mean squared differences of successive normal to normal in-tervals& (pNN50) the proportion derived by dividing (NN50) the number of interval differ-ences of successive normal to normal intervals greater than 50 milliseconds (ms.) by the total number of normal to normal intervals all were significantly lower in patients group. Conclusion: This study showed that heart rate variability significantly lower in patients with chronic stable angina.
Key words: Heart rate, stable angina
Abstract
*Department of Internal Medicine, College of Medicine, Hawler Medical University, Erbil, Iraq. The last two decades have witnessed the
recognition of a significant relationship be-tween autonomic nervous system and diovascular mortality, including sudden car-diac death 1,2. Experimental evidence for an
association between a propensity for lethal arrhythmias and signs of either increased sympathetic or reduced vagal activity has encouraged the development of quantita-tive markers of autonomic activity. Heart rate variability (HRV) represents one of the
most promising such markers 3.
This phenomenon concerned with the oscil-lation in the interval between consecutive heart beats as well as the oscillations be-tween consecutive instantaneous heart rates. HRV has become the conventionally accepted term to describe variations of both instantaneous heart rate and RR inter-vals in the ECG 4.The clinical relevance of HRV was first appreciated in 1965 when
Introduction Hon and Lee noted that fetal distress was preceded by alterations in interbeat inter-vals before any appreciable change oc-curred in the heart rate itself 5. Twenty years ago, Sayers and others focused at-tention on the existence of physiological rhythms imbedded in the beat-to-beat heart rate signal 6, 7.The association of higher
risk of post-infarction mortality with re-duced HRV was first shown by Wolf et al 8.
The clinical importance of HRV became apparent in the late 1980s when it was confirmed that HRV was a strong and inde-pendent predictor of mortality following an acute myocardial infarction 9. Variations in
(NN) intervals (that is all intervals between adjacent QRS complexes resulting from sinus node depolarizations). The simplest variable to calculate is the standard devia-tion of the NN interval (SDNN), i.e. the square root of variance. The most com-monly used measures derived from interval differences include RMSSD, NN50 and
pNN50 All these measurements of short-term variation estimate high frequency variations in heart rate and thus are highly correlated 4. Various spectral methods for
the analysis of the tachogram had been provided the basic information of how power (i.e. variance) distributes as a func-tion of frequency 10, however time–domain
analysis is easier to perform 4.Heart rate
variability in a general population sample shows expected associations with all known cardiovascular risk factors 11, 12. Va-gal modulation as assessed by HRV analy-sis was enhanced in association with exer-cise induced inferoposterior ischemia 13. Several studies showed that HRV has an independent value in predicting total sur-vival of patients with chronic heart failure. Recently the predictive power of HRV in patients with congestive heart failure has also been reported 14.
The present study involved patients who attend outpatient clinic in Ibn-Albitar hospi-tal with chest pain where they underwent thorough history, medical examination, ECG at rest, ECG exercise test, Echo study &blood examination. Among all pa-tients, 39 complete the above work and in-cluded in the study workup from first of March 2006 to twenty of September 2006 after full filling the following criteria: 1-have classical ischemic chest pain with at least two risk factors for IHD and positive exercise ECG test. 2-Having chronic stable angina (15) on anti-ischemic treatment ac-cording to preference of treating cardiolo-gist. 3-Patients with acute myocardial in-farction (AMI), unstable angina, valvular heart disease, decompensated heart Methods
failure& patients not in sinus rhythm were excluded from the study. The control group involved healthy volunteers who were age & sexmatched to the patients group. Se-verity of chronic stable angina was as-sessed clinically and by using ECG exer-cise test (EET). Clinically patients classi-fied according to Canadian cardiovascular society (CCS) with class I mean normal ordinary physical activity, class II slight limitation of ordinary physical activity, class III marked limitation of ordinary physical activity class VI pain at rest 16. EET were
performed for all patients in the study group, treadmill test was used according to bruce protocol. Positive EET was defined as horizontal or down sloping of ST seg-ment depression or elevation in non-Q wave lead of 1mm for at least 60-80millisecond after J point in any of the 12 leads 17, 18. 24 hour holter study was done for all patients & controls, all of them given appointment between (8 to 9 A.M.) and removed on the following day at (8 to 9 A.M.). HRV measured as SDNN, RMSSD, and PNN50. NN50, number of interval dif-ferences of successive NN intervals greater than 50 milliseconds 8.Left ven-tricular (L.V.) dysfunction was defined as ejection fraction (EF) below 50. Mild L.V. dysfunction defined as EF between (45%-50%). Moderate L.V. dysfunction defined as EF below (45%). Severe L.V. dysfunc-tion defined as EF below (35%) 18. Statisti-cal analysis all data were presented as mean ± SD. Comparison among data were done using Z test, P value < 0.05 accepted as minimal value for significance.
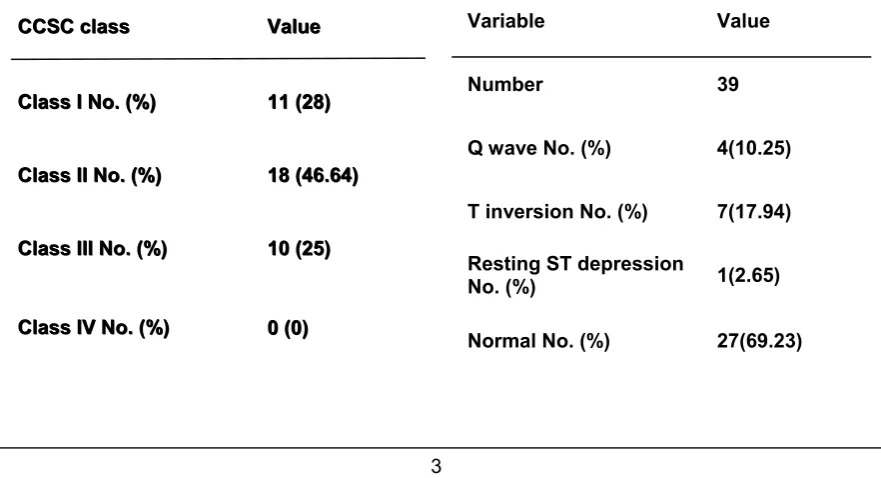
This study involved 39 patients with CSA & 25 person were taken as control. Table (1) showed no significant difference in age or sex distribution between the two groups. Hypertension, diabetes mellitus & positive family history of coronary artery disease (CAD) were more prevalent in the study group as in (Table 1). Patient in functional class 1 according to CCS classification
were 11 (28%), CCS class II were 18 (46%) &10 patients were in class III (25.64%) as in (Table 2). The resting ECG in patients with CSA showed that 27 patient (69.23%) had normal ECG,4 patients (10.25%) with significant Q wave,7 patients (17.94%) with T wave inversion &one pa-tient (2.65%) with ST depression as in (Table 3). Echocardiography in patients
with CSA showed that 35 patients (89.74%) were having good L.V function, 2 patients (5.12%)had mild L.V dysfunction & 2 patients (5.12%) had moderate L.V dys-function as in (Table 4). In all patients with CSA& positive ECG exercise test, SDNN, RMSSD& PNN50 were significantly lower in patients with CSA than control as in (Table 5).
Table 1: Base line characteristics of study and control groups.
Variable
Patients ControlP value
Number
39 25Age (year) 57.816 ± 7.707 56.70± 6.50 0.30
Male No.(%) 31 (79.4) 18 (72) 0.510
Female No.(%) 8 (20.5) 7 (28) 0.490
Hypertension No. (%) 20 (51.3) 6 (24) 0.03
Diabetes mellitus No. (%) 9 (23) 2 (8) 0.119
Smoker No. (%) 20 (51.3) 12 (48) 0.790
Positive family history of
CAD No.(%) 10 (25.6) 2 (8) 0.078
CCSC class Value
Class I No. (%) 11 (28)
Class II No. (%) 18 (46.64)
Class III No. (%) 10 (25)
Class IV No. (%) 0 (0)
CCSC class Value
Class I No. (%) 11 (28)
Class II No. (%) 18 (46.64)
Class III No. (%) 10 (25)
Class IV No. (%) 0 (0)
Table 2: Classification of angina in patients with CSA
Variable Value
Number 39
Q wave No. (%) 4(10.25)
T inversion No. (%) 7(17.94)
Resting ST depression
No. (%) 1(2.65)
Normal No. (%) 27(69.23)
Table 4: Echocardigraphic finding in study group.
This study involved patients with chest pain suggestive of chronic stable angina, who were referred to a tertiary center for farther evaluation. Among all patients during the study period 39 patients fulfiled the inclu-sion criteria. Hyperteninclu-sion diabetes mellitus & family history were more prevalent in CSA group than control. This is expected as these risk factors increase the tendency to develop angina 19. We chose patients with positive EET as patients group. Most of patients had normal resting ECG &Echo. These were due to type of patients selected as more than 70% of our patients are in CCS I & II. Most of the studies con-cerned with HRV and CSA involved post-myocardial infarction patients 20, 21, 22, 23
however studies involving HRV in patients with CSA are lacking making comparison of results of this study with other studies difficult. HRV significantly lower in patients with CSA than control group. Vagal modu-lation as assessed by HRV analysis was enhanced in association with exercise induced inferoposterior ischemia13.
The RR interval variations present during resting conditions represent a fine-tuning of the beat-to-beat control mechanisms 24, 25. Vagal afferent stimulation leads to
Table 5: Heart rate variability in study and control groups
reflex excitation of vagal efferent activity and inhibition of sympathetic efferent activ-ity. The opposite reflex effects are medi-ated by the stimulation of sympathetic af-ferent activity 26. Efferent vagal activity also appears to be under ‘tonic’ restraint by car-diac afferent sympathetic activity 27. Effer-ent sympathetic and vagal activities di-rected to the sinus node are characterized by discharge largely synchronous with each cardiac cycle. Ischemic heart disease seems to affect these efferent afferent in-teraction pathways and as a result HRV is affected, however the exact mechanism of interaction between HRV& IHD is not known 4.
Heart rate variability as measured by time domain method assessed by NNSD, RMSSD, PNN50 was significantly reduced in patients with CSA.
Number 39
Good L.V.F No. (%) 35 (89.74)
Mild L.V.
dysfunction No. (%) 2 (5.12)
Moderate L.V.
dysfunction No. (%) 2 (5.12)
Severe L.V.
dysfunction No. (%) Zero (0)
HRV
Patients withCSA
Controls P value
SDNN 113.8 ± 25.2 142.54± 34.15 0.0001
RMSSD 33.7 ± 18.73 45.95 ± 28.23 0.0014
PNN50 8.28 ± 6.98 14.5 ± 10.63 0.0001
Discussion
1. Levy MN, Schwartz PJ eds. Vagal control of the heart: Experimental basis and clinical implications. Armonk: Future 1994.
2. Lown B, Verrier RL. Neural activity and ventricular fibrillation.N Engl J Med 1976; 294: 1165–70. 3. Dreifus LS, Agarwal JB, Botvinick EH et al.
(American College of Cardiology Cardiovascular Technology Assessment Committee):- Heart rate variability for risk stratification of life-threatening arrhythmias. J Am Coll Cardiol 1993; 22:948–50. 4. Malik M, Bigger JT, Cam AJ, Kleiger RE, Malliani
A, Moss AJ, et al. Heart rate variability: Standards of measurement, physiological interpritation, and clinical use. Eur Heart J 1996; 17: 354–381
5. Hon EH, Lee ST. Electronic evaluations of the fetal heart rate patterns preceding fetal death, fur-ther observations. Am J Obstet Gynec.1965; 87: 814–26.
6. Hirsh JA, Bishop B. Respiratory sinus arrhythmia in humans; how breathing pattern modulates heart rate. Am J Physiol 1981; 241: H620–9.
7. Sayers BM. Analysis of heart rate variability. Er-gonomics 1973; 16: 17–32.
8. Task Force of the European Society of Cardiology and the North American Society of Pacing and Electrophysiology. Heart rate variability. Standards of measurement, physiological interpretation, and clinical use. Circulation,1996;93:1043-1065. 9. Bigger JT, Fleiss JL, Steinman RC, Rolnitzky LM,
Kleiger RE, Rottman JN. Frequency domain meas-ures of heart period variability and mortality after myocardial infarction. Circulation 1992; 85: 164– 71.
10. Kay SM, Marple, SL. Spectrum analysis: A mod-ern perspective Proc IEEE.1981; 69: 1380–1419.
rate variability in an ageing population and its asso-ciation with lifestyle and cardiovascular risk factors: results of the SAPALDIA study.Europace. . 2006 ;8 (7):521-9.
12. Schulnan SP, Lasorda D, Farah T, et al . Correla-tions between coronary flow reserve measured with a Doppler guide wire& treadmill exercise testing. Am Heart J1997; 134:99
hanced vagal modulation and exercise induced ischaemia of the inferoposterior myocardium. Heart. 2006; 92(3): 325-30.
14. Boveda S, Galinier M,Pathak A,et al . Prognostic value of heart rate variability in time domain analy-sis in congestive heart failure. J Interv Card Elec-trophysiol 2001;5:181-187.
15. Scolon P, Faxon D, Audei A.et al.ACC/AHA guideline for coronary angiography . J Am Coll Car-diol 1999;33:1765
16. Campeau L : Grading of angina pectoris. Circula-tion 54 : 522.1975
17. Fearon WF, Lee DP, Froelicher VF The effect of resting ST segment depression on the diagnostic characteristics of exercise treadmill test .J Am Coll Cardiol 2000;35:1026.
18. Gibbons RJ, Balady GJ, Bricker JT, et al ACC/ AHA. guide line up date fore exercise testing. Summery article. A report of the ACC/AHA task force or practice guidelines (Committee to up date). (2002).
19. Hajiar I, Kotchen TA. trends in prevalence , awareness , treatment, and control of hypertension in the united states, JAMA 2003; 290:199.
20. Bigger JT, Fleiss JL, Rolnitzky LM, Steinman RC. The ability of several short-term measures of RR Variability to predict mortality after myocardial infarction. Circulation 1993; 88: 927–34.
21. De Ferrari GM, Vanoli E, Schwartz PJ. Cardiac vagal activity, myocardial ischemia and sudden death. In: Zipes DP, Jalife J, eds. Cardiac electro-physiology. From cell to bedside. Philadelphia: W. B. Saunders, 1995: 422–34.
22. Lombardi F, Sandrone G, Mortara A et al. Cir-cadian variation of spectral indices of heart rate variability after myocardial infarction. Am Heart J 1992; 123: 1521–9.
23. Merri M, Farden DC, Mottley JG, Titlebaum EL. Sampling frequency of the electrocardiogram for the spectral analysis of heart rate variability, IEEE Trans Biomed Eng 1990; 37: 99–106.
24. Akselrod S, Gordon D, Madwed JB, Snidman NC, Shannon DC, Cohen RJ. Hemodynamic regu-lation: investigation by spectral analysis. Am J Physiol 1985; 249: H867–75.
25. Saul JP, Rea RF, Eckberg DL, Berger RD, Cohen RJ . Heart rate and muscle sympathetic nerve variability during reflex changes of auto-nomic activity. Am J Physiol.1990; 258:H713–21. 26. Malik M, Camm AJ. Significant of long-term
com-ponents of heart rate variability for the further prog-nosis after acute myocardial infarction. Cardiovasc Res 1990; 24: 793–803.
27. Cerati D, Schwartz PJ. Single cardiac vagal fiber activity, acute myocardial ischemia, and risk for sudden death. Circ Res 1991; 69: 1389–1401.