3
ANALYSIS OF MACROECONOMIC EVENTS IMPACT USING THE
EVENT STUDY METHODOLOGY
Radu LUPU
, PhD
Romanian Academy, Institute for Economic Forecasting
Alexandra MATEESCU
, PhD candidate
Romanian Academy, Institute for Economic Forecasting
Mihai MITRACHE
, PhD candidate
Romanian Academy, Institute for Economic Forecasting
Abstract:
This article examines the impact of the most important macroeconomic events form Eurozone on the returns of financial assets such as exchange rates, stock market indexes, swap and futures contracts. By applying the event study methodology, we computed the abnormal square returns. Results have demonstrated that events with the highest impact were macroeconomic indicator announcements like consumer price index, unemployment rate and interest rate communication by the European Central Bank.
Keywords:event study, macroeconomic events, high frequency data
JEL classification:G14, E44
Introduction
During the past several decades we have witnessed rapid advances in the quantification of risk related to financial investments. Reducing uncertainty has been a very important part in financial management. In their activity, investors should take into account not only the expected return on investment, but also an inventory of the risks that an investment is facing and a measure of the exposure to each risk.
In order to manage risk, first it is necessary to understand the types of risk that an investment is exposed to. This requires also an examination of the information available on the market, since this is immediately reflected in the behavior and dynamics of financial markets. A fundamental source of available information is the publication of macroeconomic data by statistical offices. The effects of these announcements on financial assets prices has received increased attention in the academic literature.
To measure this impact, a frequently used approach is the event study methodology. Assuming that economic agents act rationally, the utility of this methodology comes from the fact that the effects of an event will be immediately reflected in financial assets prices. Thus a measure of a macroeconomic event impact can be built using prices for a short period of time. This approach, intensively used in economic and financial research, is popular for testing the effects of a wide range of events. Examples include takeovers, mergers and acquisitions, earning announcements, securities issues, bankruptcy and financial distress and news regarding macroeconomic variables such as GDP, unemployment, inflation rate.
4 in financial instruments prices. Until the moment they are published, the investors are waiting patiently, and respond immediately after they are released. Reactions can be very strong, based on the released values of the indicators and how much they deviated from the expected ones. Thus, in this study we investigate the events which influenced the most the evolutions of financial asset prices.
Moreover, since the globalization is an essential characteristic of world economy, economic agents must bear in mind not only domestic information, but also news that come from markets around the world. Therefore, economic situation in one country can affect the decisions of investors from other countries. Macroeconomic data influence investors ‘perceptions not only about current economic situation, but also future evolution and causing therefore price changes.
Literature review
There is a wide coverage in the academic literature of event studies and it probably started with the research conducted by James Dolley (1933) who used the methodology to examine the returns effect of stock splits. The complexity level of this method increased in the following years. Certain important contributors include John H. Myers and Archie Bakay (1984), C. Austin Baker (1956, 1957 and 1958) and John Ashley (1962). The most significant improvements they brought were the removal of general stock market price variations and the separation of events which may cause confusion and increase the difficulty of ascertaining the impact of one event, such as contemporaneous events. By the end of the 1960, important papers published by Ball and Brown (1968) and Fama et al. (1969) have introduced the methodology which is very similar to one used today. Ball and Brown have focused on the informational content of quarterly earnings per share, while Fama et al. have studied the effects of stock splits after eliminating the confounding events like simultaneous dividends increase.
In a more recent study, Krueger (1996) states that starting with the year 1983, the New York Times Journal is publishing an article about the release of nonfarm payroll indicator by the Bureau of Labor Statistics and its impact on the bond or stock market.
A similar set of literature has focused on the analysis of macroeconomic news surprises’ impact on financial asset prices. The surprise of an event is computed as a difference between the predicted level and the observed level of its released value. In this category can be included the contributions brought by Fleming and Remolona (1997), Bollerslev et al. (2000), Furfine (2001), Balduzzi et al. (2001) and Green (2004) who proved that surprises of macroeconomic events such as GDP, inflation rate, unemployment rate or consumer confidence index are the main drivers of changes in Treasury yields, especially at the moment when they are released.
In an effort to perform a more in depth analysis, following studies have used high frequency data. Based on 5 minutes frequency data, Andersen et al. (2007) investigated the impact of 22 US macroeconomic indicators on stock, bond and foreign exchange markets not only from the US, but also from Great Britain and Germany during July 1998 and December 2002. They demonstrated that the release of indicators ‘values affect the European markets.
Also, Ederington and Lee (1993) conducted an event study analysis in order to determine whether US macroeconomic indicators are impacting financial instruments like Treasury bonds (T-bonds) and Eurodollar. The results have shown that indicators with the highest impact were consumer and producer price indexes, trade deficit, employment report, durable goods orders and retail sales. Moreover, prices tend to adjust to this new information very rapidly, usually in the first minute after the publication, they show a higher level of volatility for another 15 minutes and a slightly high level in the next few hours.
5 financial instrument used in the analysis was the EUR-USD exchange rate. Between 1999 and 2006 there were 89 Governing Council meetings. Their results proved that an unexpected decision regarding contractionary/expansionary monetary policy leads to an immediate appreciation/depreciation of EUR. Also, both positive and negative surprises related to interest rate level (according or not to the market expectations) are causing prolonged increased volatility in the exchange rate. In addition, the following speeches or statements are playing an important role in setting the expectations of economic agents about the future evolution of the economy. If the speech includes statements concerning risks to price stability, the EUR is appreciating. The reason for this behavior lies in the investors’ beliefs that the Central Bank will react immediately and adopt measures to address the risk of price stability by raising interest rates.
The structure of an event study
Even though it doesn’t have a unique structure, generally, the structure of an event study is following the bellow steps (Campbell, Lo, MacKinlay, 1997):
Identify the event. The initial step in the event study methodology is to choose the event whose impact we are analyzing and the event window, which is the total time interval relevant for the analysis. For example, if we want to study the effect of earnings announcements on share prices, the event would be the announcement and the event window could be the day of the announcement.
Selection criteria. The second step in the event study methodology requires the identification of selection criteria based on which we include data series in the analysis. In case of macroeconomic indicators’ impact this step involves financial instruments selection.
Normal and abnormal returns. The impact of an event on returns must be measured, and the measurement is the abnormal part of the return. In other words, the abnormal return is the ex-post return of the financial instrument, obtained in the event window, from which we extract the normal return, in the event window. The normal return is defined as the return that would have been obtained if the event hadn’t happened. For each asset i and event τ, the abnormal return is computed with the bellow formula:
it Rit E
Rit /Xt
Where
it, Ritşi E[Rit] are abnormal, actual and normal returns for period t. Xt is the conditional information in the absence of the event. Through modelling the expected return based on this information we can obtain an estimation of the normal return. There are two approaches used to determine normal returns: Constant Mean Return Model in which Xt is a constant and the Market Model which assumes that Xt is the market return. The Constant Mean Model, like the name suggests, assumes that the mean of a given asset is constant in time, while the Market Model is based on a linear, stable relationship between market return and asset return. However, these classical models were improved during the last years, and the modern literature is dominated by many other normal returns modelling techniques, in the absence of the event.6
Testing procedure. With the estimated parameters, we determine the normal returns and a methodology of testing these abnormal returns.
Empirical results. The econometric analysis is followed by the presentation of empirical results and of diagnostics, especially when the event observations are limited.
Interpretation and conclusions. The results of the analysis should offer answers regarding the ways through which the event is affecting the price of a financial instrument.
Data selection
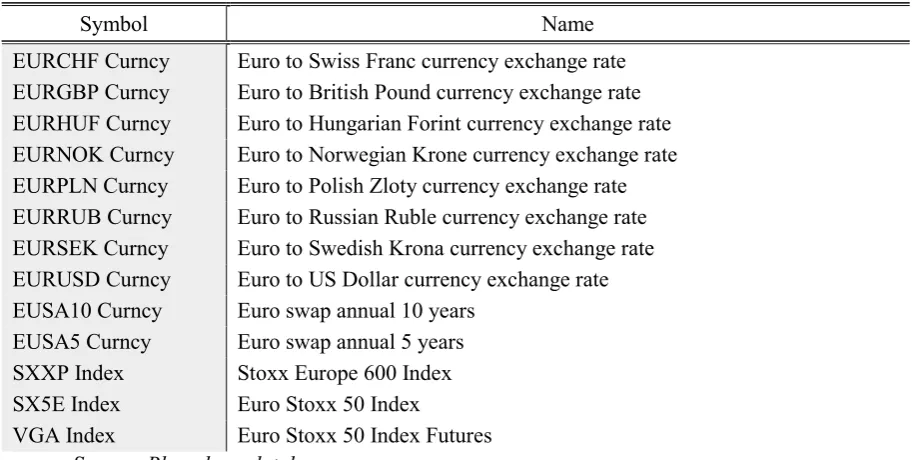
The first step in the event study process is deciding what type of event is of interest. With this done, we need to specify the selection criteria based on which we determine whether a certain instrument should be included in the sample of analysis or not. The data used for the purpose of this paper consists of five-minute returns for different types of financial instruments such as: exchange rates, swap contracts, stock indexes and a stock market index future. Tables 1 lists all the instruments used in this analysis. We took into account a period of approximately 8 months, starting from 2nd of June 2014 until the 30th of January 2015. Price data was obtained through Bloomberg platform, and the analysis was performed in Matlab.
Table 1. Analyzed financial assets
Symbol Name
EURCHF Curncy Euro to Swiss Franc currency exchange rate
EURGBP Curncy Euro to British Pound currency exchange rate
EURHUF Curncy Euro to Hungarian Forint currency exchange rate
EURNOK Curncy Euro to Norwegian Krone currency exchange rate
EURPLN Curncy Euro to Polish Zloty currency exchange rate
EURRUB Curncy Euro to Russian Ruble currency exchange rate
EURSEK Curncy Euro to Swedish Krona currency exchange rate
EURUSD Curncy Euro to US Dollar currency exchange rate
EUSA10 Curncy Euro swap annual 10 years
EUSA5 Curncy Euro swap annual 5 years
SXXP Index Stoxx Europe 600 Index
SX5E Index Euro Stoxx 50 Index
VGA Index Euro Stoxx 50 Index Futures
Source: Bloomberg database
Also, we used different types of macroeconomic events in order to build an exhaustive analysis of the impact that different statistical information releases regarding the Eurozone might have on the financial market. There were considered only regular, scheduled communicates. Therefore, the repeatability is an essential characteristic of the events used for this study. Table 2 contains a complete list of macroeconomic indicators for Eurozone, released regularly.
Table 2. Macroeconomic events
Macroeconomic events Consumer Price Index (CPI)
Producer Price Index (PPI)
7 Gross Domestic Product (GDP)
Industrial Production (IP) M3 Money Supply (M3)
Retail Sales (RS) Balance of Trade (BT) Unemployment rate (U)
Markit Eurozone Composite PMI (PMIc) Markit Eurozone Manufacturing PMI (PMIm)
Business Confidence Index (BCI) Consumer Confidence Index (CCI) Economic Confidence Index (ECI)
The methodology
The purpose of this event study is to measure the impact in the volatility of above mentioned financial instruments when information regarding Eurozone’s main financial indicators is released.
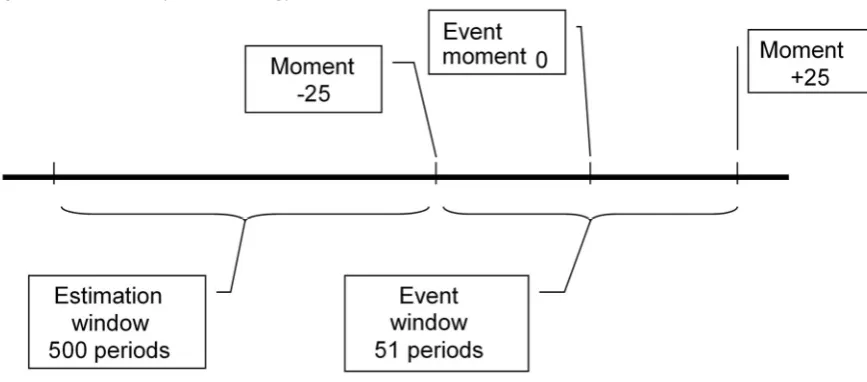
The applied methodology is based on data series for each financial asset used to measure volatility changes during periods after each event. Thus, we applied a volatility estimation technique for a 500 period sample (log-returns of 5 minutes frequency data series) before the event. We considered that the most important price reactions occur in the period prior to the event, which in case of this analysis is a 25 period sample. The mentioned reactions refer to the fact that moments before the publication of some important events, the volatility of financial assets is relatively low compared to volatilities recorded in the same moments, but during different trading days. In this interval, we can say that the market is waiting and after the release of macroeconomic indicators we can expect significant volatility movements that depend on the nature of the data and their values, in line with investor expectations or not.
In the time frame preceding the event release, we measure the amount of fitting error with respect to the volatility model (through mean-squared errors – MSE, which is the mean of squared errors, errors computed as difference between real and estimated values). The obtained value will be used as reference for identification of volatility changes in the interval after the event. We use another 25 period time frame in order to measure the volatility impact. It is very important to assess market reaction in the same time interval for all types of considered events, so that we can obtain comparable results.
In each of the 25 periods after the event, we use the volatility model to make forecasts and calculate the squared error (𝜀 ), meaning the difference between squared return and estimated variance. Each of these values will be compared with the mean squared error computed in the pre-released time frame. We consider that a value is abnormal, meaning that we have a volatility impact, if 𝜀 > 2MSE.
Thus, we construct a binary variable which takes the value of 0 if no volatility impact is detected and the value of 1 when at least one 𝜀 is above the mentioned threshold. We sum the values of 1 and the result is divided by the total number of periods after the event (in this particular case we have 25 periods plus 1, which is event moment). The obtained indicator represents the impact of information regarding a macroeconomic indicator on the volatility of a financial asset.
𝐼𝑚𝑝𝑎𝑐𝑡 = 1, 𝜀 > 2𝑀𝑆𝐸
0, 𝜀 ≤ 2𝑀𝑆𝐸, iar 𝑉𝑜𝑙𝑎𝑡𝑖𝑙𝑖𝑡𝑦 𝑖𝑚𝑝𝑎𝑐𝑡 =
∑
8 Figure 1. Event study methodology
The volatility model used to offer forecast is RiskMetrics. RiskMetrics is a risk management system proposed by the company JP Morgan and uses the exponentially weighted average model to forecast variance. The weight of square returns are exponentially reduced as we move into the past.
The RiskMetrics variance model, also known as exponential smoother is:
𝜎 = (1 − 𝜆) 𝜆 𝑅 , for 0 < λ < 1
Separating from the sum the square return for τ = 1, where 𝜆 = 𝜆 = 1, we obtain:
𝜎 = (1 − 𝜆) 𝜆 𝑅 + (1 − 𝜆)𝑅
By applying the exponential smoother technique again, today’s variance 𝜎 ,, can be written as:
𝜎 = (1 − 𝜆) 𝜆 𝑅 =1
𝜆(1 − 𝜆) 𝜆 𝑅
Therefore, future variance can be described as:
𝜎 = 𝜆𝜎 + (1 − 𝜆)𝑅
Thus, the RiskMetrics model of future volatility estimation can be seen as weighted average between actual volatility and actual square return. For this analysis we used the volatility model with the variable 𝜆 taking the value 0.94, estimated for a 500 period sample prior to the event window. This way, the abnormal square return is defined as difference between actual square return and estimated 𝜎 .
However, in order to offer an accurate event impact, it is necessary to eliminate first the periodicity component from the data series. A regular, time-dependent time series is periodic. According to Erdemlioglu, Laurent and Neely (2012), this periodic pattern can be usually caused by regular trading trends such as opening and closing of the three major markets, Asia, Europe and North America, or effects of regular macroeconomic news.
Due to these regular variations, the variance calculated for high frequency data, 𝜎, , has a periodic component, 𝑓,. Erdemlioglu, Laurent and Neely (2012) state that 𝜎, = 𝑠, 𝑓, , where 𝑠,
9
Laurent and Neely (2012) is computed based on standard deviation: 𝑓, = ,
∑ ,
, where 𝑆𝐷, =
, ∑ 𝑦; ,
, . M represents the number of returns from a data series and 𝑦
, is the standardized return
of i order from day t. Therefore the log-returns used in this analysis are periodicity-adjusted returns, i.e. returns divided by the 𝑓, measure of periodicity.
Results
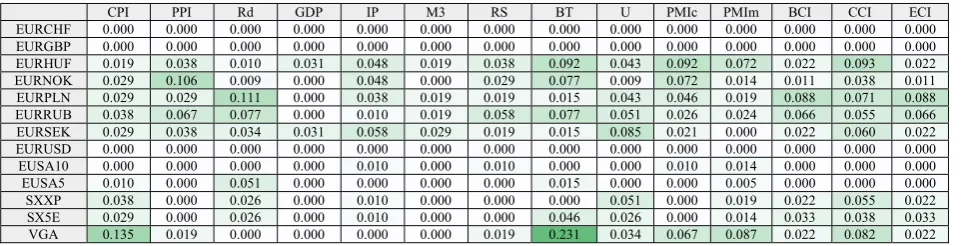
The results of this study reveal important information about the general state of Eurozone’s economy. On average, indicators with the most persistent influence were the Consumer Price Index, Consumer Confidence Index, Producer Price Index, unemployment rate, Markit Eurozone Composite PMI Index and European Central Bank decision regarding interest rate. Two of these indicators, namely the Consumer Price Index and Producer Price Index are the main indexes used in order to measure the inflation, and together with the inflation rate they provide essential information about the real economy of Eurozone. Moreover, their evolution is a key factor in European Central Bank’s decision regarding the interest rate. On the other hand, the PMI Composite Index and Consumer Confidence Indicator can offer an overview over the future evolution economic activity. This are the reasons why they are so important and their release may cause significant movements in financial instruments’ prices. They are carefully followed by investors who want to take the best decision based on current and future developments of the economy.
Table 3. Average volatility impact for each analyzed asset after the publication of Eurozone’s macroeconomic indicators
CPI PPI Rd GDP IP M3 RS BT U PMIc PMIm BCI CCI ECI EURCHF 0.000 0.000 0.000 0.000 0.000 0.000 0.000 0.000 0.000 0.000 0.000 0.000 0.000 0.000 EURGBP 0.000 0.000 0.000 0.000 0.000 0.000 0.000 0.000 0.000 0.000 0.000 0.000 0.000 0.000 EURHUF 0.019 0.038 0.010 0.031 0.048 0.019 0.038 0.092 0.043 0.092 0.072 0.022 0.093 0.022 EURNOK 0.029 0.106 0.009 0.000 0.048 0.000 0.029 0.077 0.009 0.072 0.014 0.011 0.038 0.011 EURPLN 0.029 0.029 0.111 0.000 0.038 0.019 0.019 0.015 0.043 0.046 0.019 0.088 0.071 0.088 EURRUB 0.038 0.067 0.077 0.000 0.010 0.019 0.058 0.077 0.051 0.026 0.024 0.066 0.055 0.066 EURSEK 0.029 0.038 0.034 0.031 0.058 0.029 0.019 0.015 0.085 0.021 0.000 0.022 0.060 0.022 EURUSD 0.000 0.000 0.000 0.000 0.000 0.000 0.000 0.000 0.000 0.000 0.000 0.000 0.000 0.000 EUSA10 0.000 0.000 0.000 0.000 0.010 0.000 0.010 0.000 0.000 0.010 0.014 0.000 0.000 0.000 EUSA5 0.010 0.000 0.051 0.000 0.000 0.000 0.000 0.015 0.000 0.000 0.005 0.000 0.000 0.000 SXXP 0.038 0.000 0.026 0.000 0.010 0.000 0.000 0.000 0.051 0.000 0.019 0.022 0.055 0.022 SX5E 0.029 0.000 0.026 0.000 0.010 0.000 0.000 0.046 0.026 0.000 0.014 0.033 0.038 0.033 VGA 0.135 0.019 0.000 0.000 0.000 0.000 0.019 0.231 0.034 0.067 0.087 0.022 0.082 0.022
In Annex 3 there are presented the publication moments of the six indicators which, on average, had the strongest impact, and the value of volatility indicator.
After the release of GDP there were very low reactions, or no reactions at all. This is a quarterly published indicator and generally does not provide surprising details regarding the overall state of the economy, this being already captured through monthly basis information. The results are in line with the ones previously mentioned in the literature review section.
Also, the currency exchange rates are the financial instruments that reflect the fastest new information entering the market, except EURCHF, EURGBP and EURUSD. The lack of impact and abnormal returns for these financial assets may be explained by the proximity of the four regions (Eurozone, Switzerland, Great Britain and United States). Economically, these countries are very similar. Usually they respond to the same types of information and sometimes we can even talk about contagion. The prices are adjusting very fast, but without sudden, significant movements.
10 market does not react immediately and prices need some time to adjust and include new information. However, increased volatility persists for at least 15 minutes.
Conclusions
This paper tested the market efficiency and how events in the financial market shift returns from their estimated equilibriums by employing an event study with focus on 14 types of macroeconomic indicators on series of financial assets during 2nd of June 2014 and 30th of January 2015. The results
demonstrated that the events had an impact on the financial market, though it was not immediate. The decision making process in finance is very complex due to the high level of uncertainty in any financial market. Through the analysis presented in this paper it was highlighted also the great importance of high frequency data in assessing the impact of macroeconomic events on financial assets. Risk and volatility are associated with the quality and quantity of information that is entering the market. This is the reason why we investigated the connection between moments when we registered abnormal returns and main macroeconomic events. This fundamental analysis is offering an overview for the general direction of the market in the long term. Moreover, we determined the events that influenced the most the evolutions of financial assets. Overall, it was observed a stronger impact generated by the release of the following indicators: Consumer Price Index, Producer Price Index, Consumer Confidence Index, unemployment rate, Markit Eurozone Composite PMI Index, and Central Bank’s decision on interest rate.
Bibliography
[1] Albu L. L., Lupu R., Calin A. C., Popovici, O. C. (2014b), “The effect of ECB’s Quantitative Easing on Credit Default Swap Instruments in Central and Eastern Europe”, Procedia Economics and Finance, Volume 8
[2] Andersen T., Bollerslev T., Diebold F., Vega C. (2007), „Real-time price discovery in global stock, bond and foreign exchange markets”, Journal of International Economics 73
[3] Ashley J. W. (1962), „Stock Prices and changes in Earnings and Dividends: Some Empirical Results”, Journal of Political Economy 70(1)
[4] Balduzzi P., Elton E., Green C. (2001), „Economic news and bond prices: evidence from the US
treasury market.”, Journal of Finance Quant Analysis 36
[5] Ball R., Brown P. (1968), „An Empirical Evaluation of Accounting Income Numbers”, Journal of
Accounting and Research 6(2)
[6] Barker, C. A. (1956), „Effective Stock Splits”, Harvard Business Review 34(1) [7] Barker, C. A. (1957), „Stock Splits in a Bull Market”, Harvard Business Review 35(3) [8] Barker, C. A. (1958), „Evaluation of Stock Dividends”, Harvard Business Review 36(4)
[9] Barndorff-Nielsen O., Shephard N. (2004), „Power and bipower variation with stochastic volatility and jumps”, Journal of Financial Econometrics
[10] Bollerslev T., Cai J., Song F.M. (2000), „Intraday periodicity, long memory volatility, and macro-economic announcement effects in the US treasury bond market”, Journal of Empirical Finance 7
[11] Campbell J.Y., Lo A.W., MacKinlay C.A. (1997), „The Econometrics of Financial Markets”,
Princeton, NJ: Princeton University Press
[12] Dolley J. C. (1933), „Characteristics and Procedure of Common Stock Split-Ups”, Haravard
Business Review 11
11 [14] Fama E. F., Fisher L., Jensen M. C., and Roll R. J. (1969), „The Adjustment of Stock Prices to
new Information”, International Economic Review 10(1)
[15] Furfine C. (2001), „Do macro announcements still drive the US bond market?” BIS Q Rev 49–
57
[16] Green C.T. (2004), „Economic news and the impact of trading on bond prices.” Journal of Finance 59
[17] Krueger, A.B. (1996), „Do markets respond more to more reliable labor market data?” Articol
nepublicat, Princeton University, A test of market rationality
[18] Longerstaey J., (1996), „J.P.Morgan/Reuters. RiskMetricsTM—Technical Document”
[19] Myers J. H., Bakay A. (1948), „Influence of Stock Split-Ups on Market Price”, Harvard Business Review 26
[20] Fleming M. J., Remolona E. M. (1997), „What Moves the Bond Market?” Federal Reserve Bank
of New York Economic Policy Review 3
[21] Ederington L. H., Lee J. H. (1993), „How markets process information: News releases and
volatility”, The Journal of Finance 48(4)
[22] Conrad C., Lamla, M. (2010), „The high-frequency response of the EUR-USD exchange rate to
ECB communication”, Journal of Money, Credit and Banking, 42
Annex 3. Indicators that, on average, had the highest volatility impact
Event Affected asset Publication moment Volatility impact
Consumer Price Index EURHUF Curncy 10/16/2014 9:00 0.076923077
Consumer Price Index EURHUF Curncy 11/14/2014 10:00 0.076923077
Consumer Price Index EURNOK Curncy 10/16/2014 9:00 0.153846154
Consumer Price Index EURNOK Curncy 12/17/2014 10:00 0.076923077
Consumer Price Index EURRUB Curncy 10/16/2014 9:00 0.307692308
Consumer Price Index EURSEK Curncy 11/14/2014 10:00 0.153846154
Consumer Price Index EURSEK Curncy 1/16/2015 10:00 0.076923077
Consumer Price Index EUSA5 Curncy 10/16/2014 9:00 0.076923077
Consumer Price Index SXXP Index 1/16/2015 10:00 0.307692308
Consumer Price Index SX5E Index 1/16/2015 10:00 0.230769231
Consumer Price Index VGA Index 12/17/2014 10:00 1
Consumer Price Index VGA Index 1/16/2015 10:00 0.076923077
Consumer Price Index EURPLN Curncy 10/16/2014 9:00 0.076923077
Consumer Price Index EURPLN Curncy 12/17/2014 10:00 0.076923077
Consumer Price Index EURPLN Curncy 1/16/2015 10:00 0.076923077
Producer Price Index EURHUF Curncy 10/2/2014 9:00 0.076923077
Producer Price Index EURHUF Curncy 12/2/2014 10:00 0.153846154
Producer Price Index EURHUF Curncy 1/8/2015 10:00 0.076923077
Producer Price Index EURNOK Curncy 10/2/2014 9:00 0.307692308
Producer Price Index EURNOK Curncy 11/4/2014 10:00 0.230769231
Producer Price Index EURNOK Curncy 12/2/2014 10:00 0.230769231
Producer Price Index EURNOK Curncy 1/8/2015 10:00 0.076923077
Producer Price Index EURRUB Curncy 11/4/2014 10:00 0.230769231
Producer Price Index EURRUB Curncy 12/2/2014 10:00 0.307692308
Producer Price Index EURSEK Curncy 10/2/2014 9:00 0.230769231
12
Producer Price Index VGA Index 1/8/2015 10:00 0.153846154
Producer Price Index EURPLN Curncy 11/4/2014 10:00 0.153846154
Producer Price Index EURPLN Curncy 12/2/2014 10:00 0.076923077
Consumer Confidence Index EURHUF Curncy 11/20/2014 15:00 0.307692308
Consumer Confidence Index EURHUF Curncy 1/8/2015 10:00 0.076923077
Consumer Confidence Index EURHUF Curncy 1/29/2015 10:00 0.076923077
Consumer Confidence Index EURNOK Curncy 10/23/2014 14:00 0.307692308
Consumer Confidence Index EURNOK Curncy 11/20/2014 15:00 0.076923077
Consumer Confidence Index EURNOK Curncy 12/22/2014 15:00 0.076923077
Consumer Confidence Index EURNOK Curncy 1/8/2015 10:00 0.076923077
Consumer Confidence Index EURRUB Curncy 10/23/2014 14:00 0.076923077
Consumer Confidence Index EURRUB Curncy 10/30/2014 10:00 0.307692308
Consumer Confidence Index EURRUB Curncy 11/27/2014 10:00 0.153846154
Consumer Confidence Index EURRUB Curncy 12/22/2014 15:00 0.153846154
Consumer Confidence Index EURRUB Curncy 1/22/2015 15:00 0.076923077
Consumer Confidence Index EURSEK Curncy 10/23/2014 14:00 0.307692308
Consumer Confidence Index EURSEK Curncy 10/30/2014 10:00 0.076923077
Consumer Confidence Index EURSEK Curncy 11/20/2014 15:00 0.307692308
Consumer Confidence Index EURSEK Curncy 12/22/2014 15:00 0.076923077
Consumer Confidence Index EURSEK Curncy 1/29/2015 10:00 0.076923077
Consumer Confidence Index SXXP Index 12/22/2014 15:00 0.153846154
Consumer Confidence Index SXXP Index 1/22/2015 15:00 0.076923077
Consumer Confidence Index SXXP Index 1/29/2015 10:00 0.153846154
Consumer Confidence Index SX5E Index 11/20/2014 15:00 0.076923077
Consumer Confidence Index SX5E Index 12/22/2014 15:00 0.230769231
Consumer Confidence Index SX5E Index 1/29/2015 10:00 0.230769231
Consumer Confidence Index VGA Index 12/22/2014 15:00 1
Consumer Confidence Index VGA Index 1/8/2015 10:00 0.153846154
Consumer Confidence Index EURPLN Curncy 11/27/2014 10:00 0.153846154
Consumer Confidence Index EURPLN Curncy 12/22/2014 15:00 0.307692308
Consumer Confidence Index EURPLN Curncy 1/22/2015 15:00 0.076923077
Markit Eurozone Composite PMI EURHUF Curncy 10/3/2014 8:00 0.076923077
Markit Eurozone Composite PMI EURHUF Curncy 11/20/2014 9:00 0.076923077
Markit Eurozone Composite PMI EURHUF Curncy 12/3/2014 9:00 0.153846154
Markit Eurozone Composite PMI EURHUF Curncy 12/16/2014 9:00 0.153846154
Markit Eurozone Composite PMI EURHUF Curncy 1/6/2015 9:00 0.076923077
Markit Eurozone Composite PMI EURNOK Curncy 11/5/2014 9:00 0.076923077
Markit Eurozone Composite PMI EURNOK Curncy 12/3/2014 9:00 0.076923077
Markit Eurozone Composite PMI EURNOK Curncy 1/23/2015 9:00 0.230769231
Markit Eurozone Composite PMI EURRUB Curncy 12/3/2014 9:00 0.153846154
Markit Eurozone Composite PMI EURRUB Curncy 12/16/2014 9:00 0.153846154
Markit Eurozone Composite PMI EURRUB Curncy 1/6/2015 9:00 0.076923077
Markit Eurozone Composite PMI EURSEK Curncy 10/3/2014 8:00 0.076923077
Markit Eurozone Composite PMI EURSEK Curncy 12/3/2014 9:00 0.076923077
Markit Eurozone Composite PMI EURSEK Curncy 1/6/2015 9:00 0.153846154
13
Markit Eurozone Composite PMI VGA Index 12/16/2014 9:00 1
Markit Eurozone Composite PMI EURPLN Curncy 10/3/2014 8:00 0.076923077
Markit Eurozone Composite PMI EURPLN Curncy 11/5/2014 9:00 0.076923077
Markit Eurozone Composite PMI EURPLN Curncy 12/3/2014 9:00 0.230769231
Markit Eurozone Composite PMI EURPLN Curncy 12/16/2014 9:00 0.230769231
Markit Eurozone Composite PMI EURPLN Curncy 1/6/2015 9:00 0.076923077
Unemployment rate EURHUF Curncy 9/30/2014 9:00 0.076923077
Unemployment rate EURHUF Curncy 10/31/2014 10:00 0.076923077
Unemployment rate EURHUF Curncy 1/7/2015 10:00 0.153846154
Unemployment rate EURHUF Curncy 1/30/2015 10:00 0.076923077
Unemployment rate EURNOK Curncy 10/31/2014 10:00 0.076923077
Unemployment rate EURRUB Curncy 10/31/2014 10:00 0.153846154
Unemployment rate EURRUB Curncy 1/30/2015 10:00 0.307692308
Unemployment rate EURSEK Curncy 11/28/2014 10:00 0.076923077
Unemployment rate EURSEK Curncy 1/30/2015 10:00 0.153846154
Unemployment rate SXXP Index 1/7/2015 10:00 0.230769231
Unemployment rate SXXP Index 1/30/2015 10:00 0.230769231
Unemployment rate SX5E Index 1/7/2015 10:00 0.076923077
Unemployment rate SX5E Index 1/30/2015 10:00 0.153846154
Unemployment rate VGA Index 1/7/2015 10:00 0.230769231
Unemployment rate VGA Index 1/30/2015 10:00 0.076923077
Unemployment rate EURPLN Curncy 9/30/2014 9:00 0.076923077
Unemployment rate EURPLN Curncy 10/31/2014 10:00 0.076923077
Unemployment rate EURPLN Curncy 1/7/2015 10:00 0.153846154
Unemployment rate EURPLN Curncy 1/30/2015 10:00 0.076923077
ECB interest rate decision EURHUF Curncy 10/2/2014 11:45 0.076923077
ECB interest rate decision EURHUF Curncy 1/22/2015 12:45 0.076923077
ECB interest rate decision EURNOK Curncy 11/6/2014 12:45 0.076923077
ECB interest rate decision EURRUB Curncy 10/2/2014 11:45 0.153846154
ECB interest rate decision EURRUB Curncy 11/6/2014 12:45 0.230769231
ECB interest rate decision EURRUB Curncy 1/22/2015 12:45 0.307692308
ECB interest rate decision EURSEK Curncy 12/4/2014 12:45 0.076923077
ECB interest rate decision EURSEK Curncy 12/4/2014 12:45 0.076923077
ECB interest rate decision EURSEK Curncy 1/22/2015 12:45 0.153846154
ECB interest rate decision SXXP Index 12/4/2014 12:45 0.076923077
ECB interest rate decision SXXP Index 12/4/2014 12:45 0.076923077
ECB interest rate decision SXXP Index 1/22/2015 12:45 0.076923077
ECB interest rate decision SX5E Index 1/22/2015 12:45 0.230769231
ECB interest rate decision EURPLN Curncy 10/2/2014 11:45 0.076923077
ECB interest rate decision EURPLN Curncy 11/6/2014 12:45 0.076923077