Vol.8 (2018) No. 3
ISSN: 2088-5334
A Study of Delay and Data Traffic of
IEEE 802.15.4 ZigBee-Based WSN in a Smart Home
Naseem Kadhim Baqer
#, Ameen M. Al-Modaffer
#, Esam A. AlKaldy
# #Department of Electrical Engineering, Faculty of Engineering, University of Kufa, Najaf, Iraq E-mail: [email protected] , [email protected] , [email protected]
Abstract—Wireless sensor networks (WSN) play a key role in modern applications, for instance, in smart homes as will be
demonstrated in this paper. ZigBee technology provides better support when compared with WiFi, Bluetooth and Ultra Wide Band (UWB) standards regarding transmission range. This paper deals with the use of ZigBee WSN in a domestic application, namely smart home control. This model comprises a smart home with multiple rooms, designed in such a way that each room has sensors for a varied environment. The sensor nodes will be presented by ZigBee end device which transmits the traffic to a master node in the form of a ZigBee coordinator. An OPNET modeler V14.5 was used in this simulation study. This paper presents seven models related to delay and data traffic received to improve WSN performance. Seven different WSN designs variations were utilized according to the number of rooms, sensors, coordinators, and routers. The outcomes demonstrate that one coordinator model causes more delay when compared with multiple coordinator models. Conversely, the presence of a router causes additional delay. This model should help electrical engineers when designing smart homes that utilize WSNs.
Keywords
—
wireless sensor networks (WSN); ZigBee, OPNET; media access delay (MAD); data traffic received (DTR).I. INTRODUCTION
Smart home systems that use WSN technology enrich human life and help in critical situations for instance with the take care of older adults who live alone. Advances in the field of WSN have become a highly exciting and rewarding area of Networks. This study discusses the performance of seven designs using WSNs based on ZigBee technology regarding delay and data traffic received. For the most part, ZigBee technology is used for monitoring and collecting data from multiple sensors connected to various home appliances. The data could be accessed by connecting the WSN to a server through an Ethernet LAN or handled by a Microcontroller and then displayed to control different appliances based on need [1].
In practice, a WSN comprises communication, computing, actuation, sensing and power components. The components of the WSN are bundled in single or multiple boards and packed into tiny spaces[2]. The WSNs are expressed by small, inexpensive and straightforward sensor nodes that operate as wireless devices. The sensor nodes work as environmental sensors and report outcomes to a central processing unit. The nodes are limited by processing speeds, memory, and energy due to the node's small size. The wireless sensors currently operate under four protocols: Wi-Fi (IEEE 802.11); ZigBee (IEEE 802.15.4); UWB (IEEE 802.15.3) and Bluetooth (IEEE 802.15.1). IEEE represents
the physical and MAC layers in wireless communications over an operational range of around 10-100 meters for Wi-Fi and Bluetooth [3]. Using OPNET modeler version V14.5 according to the IEEE 802.15.4 ZigBee standard to demonstrate system performance via simulation study to determine the throughput in WSN applied in greenhouse's environment monitoring system. The outcomes could help network engineers to improve their designs [4].
WSNs in a smart home control system were studied in this research using the OPNET modeler version V14.5 according to the IEEE 802.15.4 ZigBee standard to demonstrate the system performance in important applications of WSN with multiple sensors and a variable number of rooms. Also, single and multiple coordinator models were tested with the presence and obscene of a router.
In [6], a simulation study was conducted on IEEE 802.15.4/Zigbee wireless communication standard using of the REVERBED (OPNET) Academic Edition17.5 simulator to illustrate the performance of star, tree and mesh topologies supported by Zigbee standard, comparing the parameters end-to-delay and throughput. The simulation results showed that that the star topology perform better than other topologies in case of end-to-end delay, whereas, regarding throughput, the star and tree topologies perform better than mesh topology.
In [7], IEEE 802.15.4/ZigBee wireless communication standard and the RIVERBED (OPNET) Academic Edition 17.5 simulator Modeler was examined with different scenarios to compare the performance of star, tree, and mesh topologies based on end-to-end delay, throughput, mac load and traffic received parameters. They found that the tree topology is better in term of throughput, yet it performs less than mesh topology in case of end-to-end delay time. The fixed nodes had similar end-to-end delay times, whereas a higher end-to-end delay occurred at mobile nodes, which if it is used in a less prominent role, a low traffic load will occur. The tree topology is suitable for networks with small numbers of sensor nodes, as it could transmit data to its destination with a small delay and without keeping the central node too busy.
In [8], network performance was evaluated by working on ZigBee using IEEE 802.15.4 protocol stack using the parameters: throughput, delay, data dropped, and data traffic receives and sent. The results indicate that a good response could be obtained by using a combination of star and tree topologies.
In [9], three topologies: mesh, tree, and hybrid were tested by implementing them in ZigBee using IEEE 802.15.4 protocol stack through the use of OPNET modeler 14.5 simulators. Combination of mesh and tree topology was used to produce the hybrid topology. They noticed that the hybrid topology achieved maximum throughput whereas tree topology achieved minimum throughput and in case of mesh topology the throughput is almost the same in all cases. Moreover, they found that MAC delay of hybrid topology is at maximum, whereas MAC delay of tree topology is at a minimum in all simulation. The MAC delay in mesh topology stays almost the same in all scenarios. Tree topology provides minimum DTR, whereas mesh topology provides minimum DTS. They conclude that hybrid topology is the best among two other topologies, as it provides high throughput, high DTR, and DTS.
In [10], an Opnet simulation of a ZigBee network performance was conducted for three different topologies (Tree, Star, and Mesh) to compare their routing results. They concluded that, although the tree routing presents the lowest end to end delay, it is less suitable for WSN because of its high energy consumption due to the high number of used hops.
II. MATERIAL AND METHOD
A. WSN Architecture
The definition of WSN is a collection of different nodes; each node is connected wirelessly over a specific range of frequencies and bandwidth. If WSNs are compared with
traditional sensor networks, it can be seen that WSNs depend on deployment and coordination of their jobs successfully when executed. The distribution of nodes enables closer placement of the events at the exact position of the particular event. In a wide range of WSN applications, battery-powered sensors are used because recharging or replacement may not be practical. It is disposable sensors are used. Increasing the lifetime and productivity of the disposable nodes should be expected to decrease eventual failure which is an ultimate goal, yet the security protocol could be lightweight while retaining the usefulness of achieving this goal [11].
As a result of its technical superiority in a processor, communication and low-power usage of embedded computing devices, WSN is routinely applied in both the industrial and commercial contexts[12].
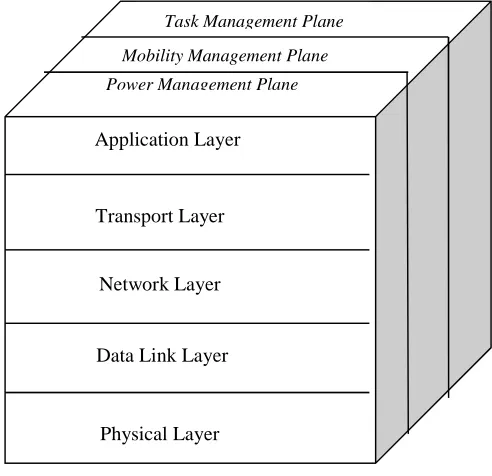
The Open Systems Interconnection (OSI) Model is the most common WSN architecture, as seen in Fig. 1, which is made up of five layers: (1) application layer, (2) transport layer, (3) network layer, (4) data link layer and (5) physical layer. The 802.15.4 ZigBee operates at the data link layer. IEEE802 divides the data link layer into two sublayers: the Logical link control (LLC) layer and the Media Access Control (MAC) layer which is responsible for controlling devices access to a medium by sharing the physical connection of the network among several sensors to transmit data packets. Each sensor has its own unique MAC address. In other words, the MAC provides an addressing mechanism and channel access, enabling each node on the network to communicate with other nodes on the same or other networks.
In addition to the five layers, there are another three cross-layer planes used for network management and to enable sensors working together to increase network efficiency. These cross-layer planes are power management plane, mobility management plane and task management plane [13], [14].
Fig. 1 WSN architecture Application Layer
Data Link Layer Transport Layer
Network Layer
Task Management Plane
Physical Layer
B. ZigBee Wireless Network Topologies
In comparison to other devices of its type, the ZigBee layer is more reliable and with better security. The supported networks are mesh, tree, and star
.
The ZigBee coordinator initializes, maintains and controls the network. All devices in a star network are directly connected to the coordinator. By comparison, devices communicate with each other in a multi-hop fashion in mesh and tree networks. In common, all three network types have one ZigBee coordinator and multiple ZigBee routers as a central feature. Another standard feature is found in reduced function devices joining the network as end devices by connecting with the ZigBee routers or a ZigBee coordinator. Mesh networks suffer from several limitations including their ability only to communicate with each other in a peer-to-peer fashion (as specified in IEEE 802.15.4[15]), and with the coordinator and routers not being beacon-enabled; in contrast to a tree network which has this latter capability[16].In this paper, the use of ZigBee WSNs in smart home systems is discussed. Seven suggested scenarios for star and tree network topologies are tested regarding the delay, DTR, and MAD.
C. WSN in the Smart Home
The monitoring of the safety of home appliances in a home system is a prominent feature of the smart home. In critical situations, it can even cause specific electrical devices to stop running. The smart home system is divided into two components, the WSN and the management and security monitoring systems
.
The primary purpose of WSN in the smart home is to collect internal data from sources such as temperature, light, gas volume, …etc of different sensors. Using the WSN, data is sent to the controller then to the management and security monitoring systems. In the monitoring and management subsystem, the data is processed, analyzed and subsequently displayed via graphs, reports, and curves. The WSN was constructed using ZigBee technology by the IEEE802.15.4 standard [1].
A smart home provides energy conservation and convenience for users, alongside habitat sensing applications such as:
- Cooling, heating, and lighting management systems from anywhere in the home.
- Automated multi-systems for energy conservation and habitat monitoring.
- The capture of detailed utility usage data for electricity, gas, and water[17].
D. Simulation Designs
In our network models, the sensors were designated as a ZigBee end device while a ZigBee coordinator represented the master node. The OPNET Modeler V14.5 was used in the simulation for the network.
There are four sensors for each room inside the smart home. Different scenarios were suggested to study the system performance regarding the delay for a single coordinator and multiple coordinators with increasing number of rooms inside the smart home or with increasing sensors inside each room.
1) First Scenario: In this suggested scenario, there is one
room in the smart home with four sensors to measure, for example, light, temperature, motion detection, and gas volume. A ZigBee end device represents each sensor, and the master node is expressed by a ZigBee coordinator where data is sent from the sensors to the coordinator. This scenario is shown in Fig. 2.
Fig. 2 First scenario design
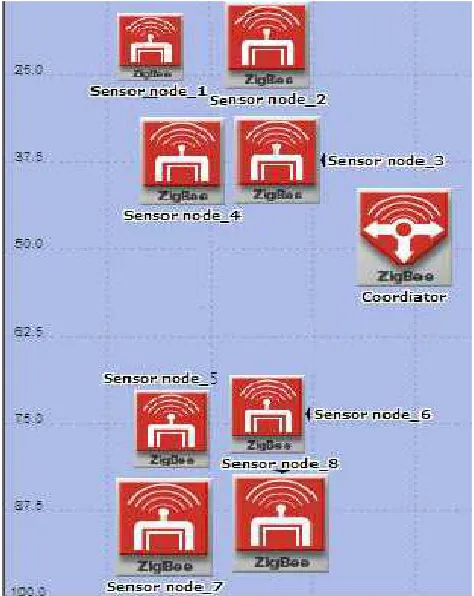
2) Second Scenario: In this scenario, the number of rooms
inside the smart home was increased to two with four sensors in each room where data is sent from all the eight sensors to the coordinator. This second scenario of eight sensors is shown in Fig. 3.
3) Third Scenario: In this suggested scenario, the number
of rooms inside the smart home has been increased to four which result in sixteen sensors, but maintaining a single coordinator, as seen in Fig. 4.
Fig. 4 Third scenario
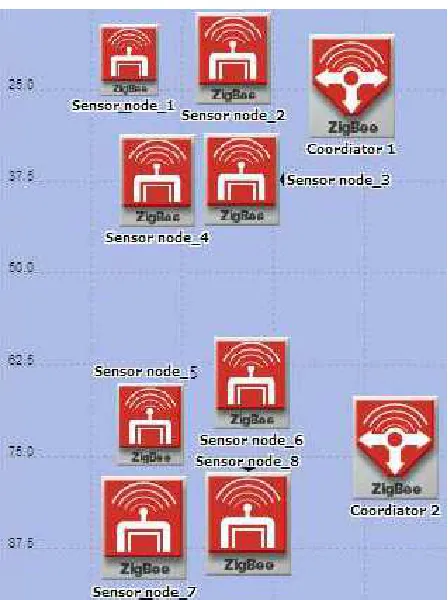
4) Fourth Scenario: In this scenario, there are two rooms
in the smart home, with four sensors and one coordinator in each room, as seen in Fig. 5.
Fig. 5 Fourth scenario
5) Fifth Scenario: In this proposed scenario, there are four
rooms inside the smart home with four sensors and one coordinator for each room. This design leads to sixteen sensors with four coordinators receiving data from the sensors as shown in Fig. 6.
Fig. 6 Fifth scenario
6) Sixth Scenario: In this scenario, a ZigBee router was
used to receive traffic from four coordinators (master nodes) as seen in Fig. 7. This model could connect access points to a server through a ZigBee/Wifi gateway before monitoring.
Fig. 7 Sixth scenario
7) Seventh Scenario: A ZigBee router was used with a
Fig. 8 Seventh scenario
III.RESULTS AND DISCUSSION
The seven scenarios were implemented using the OPNET Modeler. Data was gathered to study the overall performance of the various system configurations about Media Access Delay (MAD), and a comparison was carried out between the suggested networks scenarios according to the number of rooms, sensors, and coordinators. Subsequently, additional computations were done for each coordinator to look at the performance of a system when the master nodes were increased as, in this paper, the primary concern is the traffic delay of collected data. The simulation lasted for 2000 seconds to survey system performance according to various parameters. The combined results were as follows:
A. First Output Results for One Coordinator
MAD calculations were recorded. For every frame, the delay was computed as the duration from the time it entered the transmission line up - defined as the arrival time of the next data layer and creation time for all the other types of frames - until the time the frame is first dispatched to the physical layer. Fig. 9 shows the MAD for scenarios 1, 2 and 3 by comparing the results for a different number of rooms, which increased from 1 to 2 to 4 rooms and number of sensors increasing too from 4 to 8 to 16 respectively.
Fig. 9 MAD for single coordinator
B. Second Output Results for One Coordinator
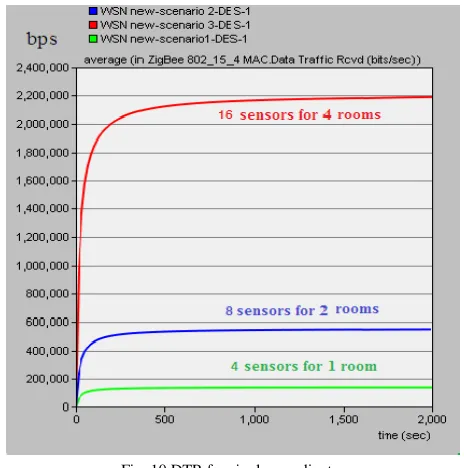
Data Traffic Received (DTR) in bits per sec is the total traffic successfully received by the MAC from the physical layer, including re-transmissions[18]. Fig. 10 represents the DTR for scenarios 1, 2 and 3 that recorded on the same graph for comparison; with the number of rooms increasing from 1 to 2 to 4 rooms, with a corresponding increase the number of sensors from 4 to 8 to 16. With four sensors inside each room, the delay increased as the number of rooms increased.
Fig. 10 DTR for single coordinator
C. Third Output Results for One coordinator
Fig. 11 shows DTR received by the coordinator from the sensors in such a way that the number of sensors is increased from four to eight than to sixteen sensors for one, two and four rooms respectively inside the smart home. The DTR rises as the number of rooms goes up; and with a corresponding rise in sensors, there is a proportionate increase in data sent to the coordinator.
The first set of outcomes show different parameters using a single coordinator. The second set of outcomes provides a comparison between using a single coordinator for all rooms or one coordinator for each room of the smart home.
D. Fourth Output Results for Multiple Coordinators
Fig. 12 describes the delay in a single and multiple coordinator systems. The delay was calculated using scenarios 2, 3, 4 and 5. It is evident from the figures that the delay decreases as the number of coordinators increases.
Two different cases for each of two scenarios are considered: in the first eight sensors were used, and in the second sixteen sensors were used. The delay in the first case noticeably decreased when an extra coordinator is added. This preferable decrement was 7.11 ms in the steady state. The delay in the second case also decreased when the number of coordinators is increased as in case one (this decrement was 5.34 ms). Adding three extra coordinators produces 7.45 ms useful decrement in the delay at the steady state.
Fig. 12 Delay in multiple coordinator systems
E. Fifth Output Results for Single Coordinator with and without a router
Fig. 13 shows the delay for systems with and without a router. It also shows an end-to-end delay of all the packets received by the 802.15.4 MACs. At the steady state, the extra increment in delay was 0.29 ms due to the presence of the router.
Fig. 13 Delay with and without a router for a single coordinator
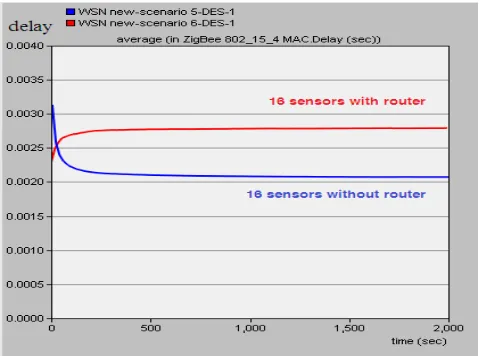
F. Sixth Output Results for Multiple Coordinators with and without a router
Scenario 6 is the same as number 5 except for the use of an extra router. Fig. 14 reveals the router effects regarding the delay. This figure shows an end-to-end delay for all packets received by the 802.15.4 MACs. At the steady state, the amount of not preferable delay was 0.702 ms which is much greater than the delay of only coordinator networks.
Fig. 14 Delay with and without a router for 4 coordinators
The outcomes can be summarized as in table 1.
TABLEI OUTCOMES SUMMARY
Scenario Sensors Coordinator Rooms Router MAD
(ms)
DTR (kbps)
Delay (ms)
Figure
1 4 1 1 Non 5.378
9
2 8 1 2 Non 6.108
3 16 1 4 Non 8.35
1 4 1 1 Non 131.034
10
2 8 1 2 Non 551.724
3 16 1 4 Non 2,186.2
2 8 1 2 Non 9.228
12
3 16 1 4 Non 7.457
4 8 2 2 Non 2.114
5 16 4 4 Non 2.114
3 16 1 4 Non 9.457
13
7 16 1 4 yes 9.742
5 16 4 4 Non 2.083
14
IV.CONCLUSIONS
By comparing the first, the second, and the third scenarios, a single coordinator has been used with one, two or four rooms with four sensors in each room. The MAD, DTR (from the MAC layer) and DTR (from sensors) increased as the number of rooms increased. For multiple coordinator systems, the network performance proved to be faster, regardless of the number of sensors.
For both single and multiple coordinator systems, the presence of a router introduced an additional delay of the data traffic; the delay increased as the number of coordinators is increased. Accordingly, it is highly recommended that WSN designers may avoid the use of routers as much as possible from delay point of view.
REFERENCES
[1] J. V Ekshinge and S. S. Santosh, “Smart Home Management Using Wireless Sensor Network,” Int. J. Adv. Res. Electron. Commun. Eng., vol. 3, no. 4, pp. 453–456, 2014.
[2] Y. Yu, B. Krishnamachari, and V. Kumar, Information processing and routing in wireless sensor networks. World Scientific Publishing Co. Pte. Ltd., 2006.
[3] J. S. Lee, Y. W. Su, and C. C. Shen, “A comparative study of wireless protocols: Bluetooth, UWB, ZigBee, and Wi-Fi,” IECON Proc. (Industrial Electron. Conf., 2007, pp. 46–51.
[4] N. K. Baqer, A. M. Al-modaffer, and G. H. Shahtoor, “Throughput Study of IEEE 802 . 15 . 4 ZigBee-Based WSNs for Greenhouse Environments,” Int. J. Sci. Res. Eng. Technol., vol. 7, no. 3, pp. 171– 176, 2018.
[5] N. Javaid, M. Yaqoob, M. Y. Khan, M. A. Khan, A. Javaid, and Z. A. Khan, “Analyzing delay in wireless multi-hop heterogeneous body area networks,” Res. J. Appl. Sci. Eng. Technol., vol. 7, no. 1, pp. 123–136, 2013.
[6] P. Mounika and C. S. Rani, “Simulation of Zigbee Wireless Sensor
Networks Based on OPNET Modeler,” Int. J. Eng. Res. Electron. Commun. Eng., vol. 4, no. 9, pp. 24–27, 2017.
[7] S. Vançİn, “Design and Simulation of Wireless Sensor Network Topologies Using the ZigBee Standard,” Int. J. Comput. Networks Appl., vol. 2, no. 3, pp. 135–143, 2015.
[8] A. Kaur, J. Kaur, and G. Singh, “Node Failure Investigation in Zigbee Sensor Network,” CT Int. J. Inf. Commun. Technol., vol. 2, no. 1, pp. 28–34, 2014.
[9] S. Kaur, H. Singh, and G. Singh, “Examine the Performance of different Topologies using Opnet 14 . 5 in ZigBee Sensor Network,” Int. J. Comput. Appl., vol. 108, no. 7, pp. 1–5, 2014.
[10] E. Kaoutar and P. M. Mohammed, “Zigbee Routing Opnet Simulation for a Wireless Sensors Network,” Int. J. Adv. Comput. Sci. Appl., vol. 5, no. 12, pp. 151–154, 2014.
[11] D. Boyle, E. Davidboyleulie, and T. Newe, “Securing Wireless Sensor Networks : Security Architectures,” J. NETWORKS, vol. 3, no. 1, pp. 65–77, 2008.
[12] T. Agarwal, “Wireless Sensor Network Architecture and Its Applications.” [Online]. Available: https://www.elprocus.com/architecture-of-wireless-sensor-network-and-applications/. [Accessed: 01-Apr-2018].
[13] I. F. Akyildiz, W. Su, Y. Sankarasubramaniam, and E. Cayirci, “Wireless sensor networks: a survey,” Comput. Networks, vol. 38, no. 4, pp. 393–422, 2002.
[14] A. Abed, A. Alkhatib, and G. S. Baicher, “Wireless Sensor Network Architecture,” Int. Conf. Comput. Networks Commun. Syst., vol. 35, no. Cncs, pp. 11–15, 2012.
[15] M.-S. Pan and Y.-C. Tseng, “ZigBee Wireless Sensor Networks and Their Applications,” Sens. Networks Config. Fundam. Stand. Platforms, Appl., pp. 349–368, 2007.
[16] M. P. Yu-Chee Tseng, “Quick convergecast in Zigbee/IEEE 802.15.4 tree-based wireless sensor networks,” Computer (Long. Beach. Calif)., vol. 39, no. 7, pp. 55–62, 2006.
[17] K. Sohraby, D. Minoli, and T. Znati, Wireless Sensor Networks, 2007th ed. A John Wiley & Sons, Inc., Publication, 2007.