Inzinerine Ekonomika-Engineering Economics, 2018, 29(5), 559–570
Management Accounting Practices in Support of Lean Management Strategy in
Service Organizations
Tomasz Wnuk-Pel
1,21University of Lodz
Matejki St. 22/26 90-237 Lodz, Poland
2Affiliated at Linnaeus University
Box 451, 35106 Vaxjo, Sweden E-mail: tomwnuk@uni.lodz.pl
http://dx.doi.org/10.5755/j01.ee.29.5.20763
Lean strategy is becoming more and more popular, not only in manufacturing but also in service organizations. Drawing on previous research (e.g. Kennedy, Widener, 2008; Fullerton et al., 2013) the paper aims to empirically examine whether service organizations use specific management accounting systems (MAS) to support lean strategy.
The theoretical influence of the research is threefold: (a) the research adds to the literature by responding to calls to provide empirical research on the functioning of MAS in a lean environment, especially in service organizations, (b) it suggests that service companies recognize the need to change MAS in response to changes in their strategy, (c) it also investigates associations between different management accounting (MA) practices, examining if they work as a package in support of lean strategy in a service organization. These are important issues that keep MA research up to date with the practical problems of world-class organizations, and they move the knowledge of MA forward.
The case study method was used in the research to gain a deeper understanding of the phenomena analyzed. It was found that there is a positive and significant association between lean practices and employee empowerment, whiteboard use and individual process costing. Thus, it was generally observed that departments with higher use of lean methods also use MA practices more extensively. Limited evidence was found, however, that in the case of company MA practices work together (as a package) to support lean strategy. It was also observed that MA tasks, related to lean practices, are moving from the Accounting Department to operational departments.
Keywords: Management Accounting System; Case Study; Lean Management; Lean Strategy; Service Organization.
Introduction
One of the most important strategies implemented in organizations today is lean management (Fullerton et al., 2013; Rajnoha et al., 2018) and it seems that the successful use of this strategy requires appropriate management accounting systems (Nicolau, 2003; Haskin, 2010; Strumickas and Valanciene, 2010; Castellano and Burrows, 2011; Fullerton et al., 2013). The general necessity to change management accounting systems (MAS) in reaction to new strategy implementation was already advocated in the 1980’s by Kaplan and Cooper (1988). Their argumentation is valid, especially in the case of MAS support of lean management (LM) strategy implementation, although the nature of these changes is still a subject of research (Kennedy & Widener, 2008; Fullerton et al., 2013; Kinder & Burgoyne, 2013).
This issue seems important from microeconomic point of view as it is focused on the behaviour of an organization in making decisions on its strategy and system supporting it (Dagiliene, 2010). Studying of this phenomena also requires applying general economic principles in analysing a specific company and a specific problem inside the company i.e. the implementation of lean strategy and examining MAS role in supporting this implementation. However, there is not enough research on the relationships between management
accounting systems and lean management (Haskin, 2010; Castellano and Burrows, 2011; Fullerton et al., 2013). Moreover, most of this research was performed in the production context (Chenhall & Langfield-Smith, 1998; Fullerton & McWatters, 2002; Kennedy & Widener, 2008; Fullerton et al., 2013) and far less in the context of service organizations (Hines et al., 2004; Piercy & Rich, 2009; Kinder & Burgoyne, 2013), particularly with regard to the research on how MAS support LM. This gap in the body of research offers the possibility of studying if or how management accounting system supports lean management in a service company. Filling this gap seems especially important because service organizations: (a) constitute large and steadily increasing proportion of economy in each country, (b) they implement and use management methods used earlier mainly by manufacturing organizations and (c) there is a lack of research on whether the use of these methods (e.g. LM) is supported by organization’s MAS.
other, forming a package. To address this purpose, the case study method was chosen.
As the nature of the relationships between management accounting systems and lean management has not been explained enough, the research is mainly exploratory and its main role is to provide a deeper understanding if/how MA practices support LM strategy. It seems especially interesting in the context of service organizations and, more specifically, the Polish branch of a Western financial institution. The study’s contribution to the literature is threefold: (a) it responds to the calls to empirically examine whether organizations use specific MAS to support lean strategy (van der Merwe and Thomson, 2007; Li et al., 2012), (b) it investigates the degree of MAS and LM use and relationships between the two, (c) it provides evidence of how different MA practices (tools) work together to support LM strategy (in this aspect, it responds to the calls of Malmi & Brown, 2008). Moreover, the study offers a starting point for future research with the use of more traditional surveys with hypotheses testing.
The rest of the paper is organized as follows: first, there is a short literature review, which is followed by a presentation of the research method. Then the research results are presented, in particular, analysis of lean management strategy associations with management accounting practices and an examination of the relationships of MA practices to one another. At the end of the paper, the discussion and conclusions are presented.
Literature Review
To investigate how management accounting practices support lean management strategy, contingency theory is used (Gerdin & Greve, 2008). This theory suggests that if organizations are to perform well, they must adapt to contingencies such as the environment or a business strategy (Kennedy, Widener, 2008; Fullerton et al., 2013). As the purpose of the research is to examine how MA practices support LM, key elements of MAS have to be identified. Drawing on congruence model already used by Fullerton et al. (2013) to examine the association of MAS with LM, four elements of management accounting systems were identified for the purpose of the research:
employee empowerment – empowered employees can work more effectively, which makes it possible to achieve ambitious goals for lean management strategy execution (Kennedy & Widener, 2008), whiteboards – the use of the information on targets
and feedback in a simplified, visual form should be easier and more useful for ordinary employees to grasp (Glasworth, 1997),
individual process costing – most organizations employing lean management strategy are organized around value streams, not functionally, like traditional organizations, which influences their costing practices (Fullerton et al., 2013),
simplified management reporting – the lean MAS should minimize the difficulty and cost of using it and, at the same time, it should efficiently support lean management strategy execution.
MAS is understood in the paper as a system consisting of the information needed to make decisions and appraise
performance in the organization. In that meaning, MAS is not limited to obligatory reporting of the organization and consists not only of financial but also non-financial information used by managers to successfully implement the organization’s strategy. It is also connected with creating an environment which favours employee development.
According to Chenhall and Langfield-Smith (1998), a relationship exists between management accounting systems and strategy, i.e., the use of a certain strategy leads to changes in the management accounting system. What is more, a body of research (Baines & Langfield-Smith, 2003; Callen et al., 2005; Kennedy & Widener, 2008) suggest that the success of an organization’s strategy execution depends on the suitability of MAS supporting a given strategy (management accounting practices in organizations should be aligned with organizations’ strategies). Such MAS should be oriented both internally and externally, should not be limited to financial but also include non-financial information, and generally it should provide information which could be useful in formulating an organization’s strategies and monitoring their success, thus enabling managers a better execution of a given strategy (Cadez & Guilding, 2008).
Implementing a lean management strategy requires an adaptation process to take place in an organization through which managers’ decisions change the organization (Rao & Bargerstock, 2013). According to Womack and Jones (2003), the lean concept could be analyzed in terms of operational changes that are focused on reorienting the entire organization toward customer value creation. Rao and Bargerstock (2013) note that the extent of leanness in an organization could be measured by the extent to which: (a) values are defined by customers, (b) activities are streamlined on value streams, (c) operations use the principles of pull and flow (just in time – JIT), (d) visual controls are secured over shop-floor operations, (e) employees are empowered through full authority and information, (f) teams strive for higher levels of perfection through continuous improvement initiatives.
There is a body of research suggesting that traditional MAS is not appropriate for organizations implementing lean management (e.g. Kennedy & Brewer, 2006) and, what is even more probable, it could be an obstacle for lean management implementation (Fullerton & McWatters, 2002; Johnson, 2006; Maskell & Baggaley, 2006; Maskell & Kennedy, 2007; Fullerton & Kennedy, 2009). Research by Fullerton and McWatters (2002), Baines and Langfield-Smith (2003) or Kennedy and Widener (2008) support these observations and show that traditional management accounting systems cannot present the true picture of an organization’s performance and they have basic problems with showing the results of lean projects.
(Maskel & Kennedy, 2007). Lean accounting, or in other words, MAS oriented on lean strategy, should support three key aspects of lean organizations (Maskell & Kennedy, 2007): visual management, value stream management, and continuous improvement. The research by Fullerton et al. (2013) shows a direct positive relationship between the extent of the use of lean practices and a simplified strategic reporting system, value stream costing, visual performance measurement information, and employee empowerment.
According to Baines and Langfield-Smith (2003), Kennedy and Widener (2008), and Rao and Bargerstock (2013), as well as many others, it is evident that management accounting systems should adapt to a lean management strategy. Appropriate MAS should be built to support the successful implementation of LM. Based on the literature studies analyzed above, the first research question to address in the present study was formulated – it is:
Do management accounting system elements support lean management strategy in service organization?
Malmi and Brown (2008) state, that a MA package is a collection of controls and control mechanisms, and they emphasize that the term package means strong relationships existing between separate MA practices (methods). In their opinion, it is a fundamental difference than in the case that those practices work in isolation. The package elements are not defined, which means that in different situations (i.e., in different companies using different strategies), the content of the package could be different too.
According to prior literature (e.g. Widener, 2007), the use of information on targets and feedback in a visual form (whiteboards), organization costing procedures organized around value streams, and generally a simplified management accounting system, are visible signs of an organization’s commitment to lean strategy and they form a system (package) providing information for strategy execution. Consistent with the literature (e.g. Kennedy & Widener, 2008), a second research question to address in the present study was formulated – it is:
Are management accounting system elements, such as employee empowerment, whiteboards, individual process costing, and simplified management reporting, positively related to each other, forming a package in a service organization?
Research Method
The research was mainly exploratory and was organized in the form of a case study and followed the steps outlined for this type of research by Ryan et al. (2002) and Yin (2003). The choice of a case company was deliberate – the selected company extensively uses LM strategy, and therefore analysis of the interrelations between MAS and LM was possible. The research was based on a semi-structured interview guide followed by more in-depth interviews with management and employees and an extensive analysis of internal documentation and data from the information systems of the company (the case study utilized multiple data (Yin, 2003)). Information obtained by means of the interview guide was subsequently made more detailed in the course of interviews (the interviews were not
recorded as the case company did not allowed it; extensive notes were taken during the interviews). Interviews were conducted with employees from the operational and financial departments, and in particular, most of the time was given to people responsible for the functioning of MAS and LM. Altogether, 14 interviews with 9 interviewees were conducted, lasting from 1 to 2 hours each. The job position held by the interviewees (financial/operational department) and their work experience are as follows:
interviewee 1 (financial department) – 8 years, interviewee 2 (financial department) – 21 years, interviewee 3 (financial department) – 7 years, interviewee 4 (operational department) – 7 years, interviewee 5 (operational department) – 6 years, interviewee 6 (operational department) – 12 years, interviewee 7 (operational department) – 9 years, interviewee 8 (operational department) – 7 years, interviewee 9 (operational department) – 1 year. All the interviewees from financial departments were very experienced and they hold master degree in business/ economics so they knowledge on MAS was thorough. Also the interviewees from operational departments (except the last one) were very experienced as lean management methods use is concerned and all of them (including the last one) held master degree in business/economics.
The researcher used certain procedures to ensure the quality of the data gathered and among them: (a) the researcher was observant and critical during interviewees, (b) different data sources as notes made during the interviews and inside documentation were cross examined, (c) the researcher looked for patterns in how MAS and LM methods were used, (d) conclusions were drawn bearing in mind previous literature and research. After the empirical results were categorised, they were analysed while processing and compiling data from several interviews simultaneously.
As the aim of the research was to analyse whether service organizations use specific management accounting systems to support lean strategy, in addition to the interviews and documentation analysis, a special questionnaire was distributed and filled in by 19 employees (44 % response rate) from the case company (8 questionnaires were filled in by general managers (Team/Department Leaders) and 11 by employees directly involved in LM (Lean Drivers/Ambassadors/Expert)).
Questions 4 and 5 analyzed measurement of employee empowerment and visual performance measurement (whiteboards), and were based on a revised approach already used by Kennedy and Widener (2008) and Fullerton et al. (2013). The respondents indicated to what extent they agree with specified statements in their department as far as employee empowerment is concerned. Again a 5 point scale was used, where 1 – strongly disagree, 2 – somewhat disagree, 3 – indifferent, 4 – somewhat agree, 5 – strongly agree. An arithmetic average of the nine detailed questions included in Question 4 formed Employee empowerment index (EE-I) which was used as a proxy for employee empowerment. Similarly, an arithmetic average of the six detailed questions included in question 5 formed the Whiteboards index (W-I), which was used as a proxy for visual performance measurement.
Question 6 examined individual process costing procedures in the case company, but only the answers to the first two detailed questions were used to form the Individual process costing index (IPC-I) (the rest of the questions were used to understand some more detailed issues in the analyzed organization). Question 7 examined management accounting system simplicity in the case company, and three detailed questions were used to form the Management accounting system index (MAS-I). This measurement drew on Kennedy and Widener (2008), Maskel et al. (2012) and Fullerton et al. (2013). Questions 8 and 9 were used to form the Top management support index (TMS-I) and Attitude towards lean management index (ATLM-I) (only the first two questions were used to form the index). For questions 6-9, the scale was the same as for questions 4 and 5, from 1 to 5, where the meaning was: 1 – strongly disagree, 2 – somewhat disagree, 3 – indifferent, 4 – somewhat agree, 5 – strongly agree. Then an arithmetic average of the detailed questions formed the indexes which were used as proxies of studied phenomena.
The questionnaire concentrated on employees’ perceptions of LM and MAS interrelations. Conducting research based mainly on perceptions is an important limitation but other sources of information, like interviews, internal reports and so on, were used. The research, like all research in the form of a case study, is a partial one because it concentrates on the LM and MAS, which is only one part of the overall system of organizational control.
Research Results
Lean Management in the Case Company
The case company, FinCo1, is a branch of a large financial institution (WestBank). WestBank is an institution operating thousands of locations all over Europe, providing services to hundreds of thousands of corporate customers and millions of personal customers. It is among the largest European Banks. FinCo is the WestBank subsidiary branch which was established in Poland several years ago and has grown fast since them. Finco is a centralized back office unit doing daily tasks for WestBank locations with the focus on the continuous optimization of the business processes
1 FinCo and WestBank are not the real names of the studied company and
its parent company, as management did not consent to revealing the names or other, more detailed information about the company. General facts about
performed. FinCo is an extended value chain company, which means it performs ordinary back-office tasks but differently from typical business process outsourcing companies. FinCo does not perform whole processes but rather fragments, and only for the parent company – the processes originate in WestBank locations in Europe, then some of them are performed by FinCo and are subsequently finalized back in WestBank locations. FinCo generally performs registration and processing of bank contracts which were signed in the West (in WestBank branches), and these contracts include, among others, hire purchase, loan servicing, account services for individual and corporate clients, credit card servicing or leasing contracts. There are operational units and core departments which can be distinguished in the organizational structure of FinCo. The operational departments are those which provide direct services to WestBank locations and the core units are those which perform administrative and support work (e.g.
Accounting, Human Resources, Administration,
Information Technology, Safety Management). The FinCo organizational structure could be seen as a matrix in which the operational departments are directly subordinate to suitable units in the parent company, and indirectly to FinCo managers, whereas support and administrative units are solely subordinate to the managers of FinCo.
WestBank implemented LM as far back as 2004 with the aid of the McKinsey consulting company. From 2004 till 2012, in the headquarters of the company, a Lean Banking Department existed which was a typical internal consulting unit focusing on perfecting business processes in the organization. In the Polish branch of WestBank, LM was implemented from the beginning of the company’s operations in 2010, and at that moment a Lean Expert post was established (his role was to support different departments in lean strategy execution). In different FinCo units, lean strategy is utilized to a different degree. Generally, operational departments use LM to a much higher degree than the core departments of FinCo. The reason for the lesser importance of lean in the core departments stems (according to interviewees) from the difficulties in its implementation in those departments, whereas lean culture seems common in operational departments. One of the most important LM methods used in the studied organization are continuous improvement initiatives but what is interesting, there is no a simple remuneration system for suggested and implemented improvements. Rather, suggestions and implementations of innovations belong to the organizational culture (information about that can be already found in requirements for new employees).
Altogether, the following lean methods are used in different FinCo departments: (1) Value stream mapping, (2) Continuous improvement (Kaizen), (3) Six sigma, (4) 5S (sorting, streamlining, shining, standardize, sustain), (5) Whiteboards (performance management boards), (6) Standardization (a standardized way of working), (7) SMART goals (specific, measurable, ambitious, realistic, and time-bounded), (8) Poka-yoke (error proofing), (9) Root
cause analysis (in particular: Fishbone, Brain storm, 5 why), (10) Wastes (muda), (11) PDCA (plan, do, check, act), (12) KPI (key performance indicators), (13) Lead Time, (14) A3 report, (15) Skill Matrix, and (16) Time management system (Provide/others). The use of the lean management tools listed above in different departments on FinCo will be analyzed with the use of the questionnaire (the results will be shown in the next section).
The Management Accounting and Control
System in the Case Company
The management accounting system in FinCo originated in the parent company and was comprised of such elements as whiteboards, key performance indicators, and rolling financial forecasts and reports, among others, for departments or teams. Costs are collected at the high level of generality (for departments and teams), and it is not possible to provide information on the costs of individual products. Currently, there are about 40 cost centers separated in FinCo with about 50 costs by type selected in every cost center. Part of the information provided in the management accounting system of FinCo can be accessed from the SAP IT system and part is prepared and available in Excel spreadsheets or in other software (e.g. the Provide IT system).
At the time of establishing FinCo, the organization’s management accounting system was quite general, but over time its level of accuracy and detail increased. Presently, according to the consistent opinion of the managers, lean
leaders and accountants, there is a tendency to elaborate it even further. What is interesting, however, is that the initiative to make the management accounting system more detailed came from the managers; however, it seems to be a support for changes among the accounting people, too (according to the Chief Accountant, “greater accuracy of MAS could be useful and would encourage savings in operational activities”). The Chief Accountant noted: “elements of MAS are, on average, loosely coupled, with more integration in the substance of the information provided and less integration in the technical side of the integration (software integration).”
After the general overview of management accounting system in the case company, fundamental elements of this system will be analyzed. The most important elements in FinCo’s management accounting system are whiteboards, key performance indicators (KPI’s), budgets and control reports, and individual process costing. These elements will be analyzed in brief below.
The key instrument of FinCo’s performance measurement is the whiteboard, in which three parts can be distinguished: (a) targets and results, (b) improvement activities, (c) focus/activities/info. Each day, teams of several people meet at the whiteboard for 15 minutes to discuss the most important problems for the teams’ performance measurement, and they meet once a week in a conference room for a longer and more detailed discussion, lasting around one hour. The whiteboard format, with all the measurements and analysis of their calculations and interpretations, is presented in Table 1.
Table 1
FinCo’s Whiteboard Content (an Overview)
Performance
measures/information Description
I. Targets and results: 1. Business balanced
scorecard
Validation of the performance of the three main processes performed in a given team (percentage of correctly performed activities is a measure) – data imported from the Provide IT system.
2. PDA Review
Evaluation of timeliness of all the processes performed (each process individually) in a given team (percentage of services delivered on time in relation to the target is a measure – if, e.g., the target is 95 % and the result is 100 % then the status of the process is marked as OK). This ratio is analyzed for all the processes every two weeks.
3. Breakdown of worktime
Analysis of the proportion of time spent by team members on production (target 80 %) and deviant time (broken down into continuous improvement, education, managerial, projects, lend out, union work etc.).
This ratio is analyzed every month, all together for the whole team (data from the Provide IT system).
4. Productivity and efficiency
The efficiency ratio is calculated as follows: (actual number of products * standard unit time) / actual time (standard time is constantly reduced, e.g., twice a year – this gives a yearly reduction in full-time employees’ (FTE) needs by more or less X % each year – an X % yearly reduction is the target for each team). The efficiency ratio is reported once a month on a whiteboard, but it can also be seen daily in the Provide IT system.
The productivity ratio is calculated as follows: (actual number of products * standard unit time) / full-time employees’ production time (a ratio of, e.g., 110 % indicates that people working in a team (FTE production time) performed 10% more than the standard projections). The productivity ratio is reported daily.
5. Standard times
This report contains information for every process in the team on standard unit time, average last week unit time and this week unit time. Average unit times for processes are marked in green, meaning that team standards are met, or red, meaning that there is a problem with the process. This ratio is analyzed weekly.
6. Team barometer
This is a social ratio measuring the mood in each team and it contains nine separate indicators (monitoring areas such as employee satisfaction with the workload, their motivation for work, clearness of the work targets, etc.) plus total ratio indicating general team mood. This ratio is analyzed every two weeks.
II. Improvement activities
7. Registered and implemented improvements
In this section of the whiteboard, improvements in the team are registered. For each month, the number of
improvements is shown with a separation of: (a) registered improvements (with further division into incoming balance and registered this month), (b) implemented improvements (with further division into incoming balance and implemented this month) and (c) target line of improvements which makes it possible to compare how the team is doing compared to the target. An additional line demonstrates implementation degree (in percentages). III. Focus/activities/info
8. Workload Workload is a part of the whiteboard where the actual number of operations performed each day of the week for every
Performance
measures/information Description
9. Skill matrix
This is a two-dimensional matrix where each employee of the team is mentioned horizontally and each process performed in the team vertically. In the skill matrix, there are four skill levels: 0 – employee not engaged in the process yet (white field), 1 – employee is a beginner in the process (white field), 2 – employee can perform the process alone (green field), 3 – employee is an expert in the process (green field). In the last lines of the skill matrix, the number of trainers in the process is reported (a trainer is an employee with skill level 3) and also the skill level target, which is the required percentage of employees with skill level 2 or 3 in the total number of employees (if this target level is achieved, the number flashes green, and if not, it flashes red, meaning that training is needed). The skill matrix is used for, e.g., holiday planning and when an employee is leaving the company. The skill matrix is updated every three months.
10. Team information This section of the whiteboard contains information on team employees, beginning with the team leader through lean driver(s) and finishing with ordinary employees.
The second important management accounting tool in FinCo is the key performance indicators (KPI) system, which, in monthly intervals, presents data in three areas: processes (A-I), management infrastructure (J) and mind setting and behavior (H-K). KPI’s are collected and
analyzed separately for every team although not all of the indicators are typical lean indicators (e.g. business continuity plan, team barometer, performance barometer). For all the indicators, planned and actual data are presented (Table 2).
Table 2
Key Performance Indicators for Teams
KPI Commentary
A. Timely delivery Monitoring % of deliveries send on time.
B. Process efficiency Monitoring standard time reduction, e.g., a reduction in the time spent on documentation relating to a consumer loan. C. Improvement proposals Lean indicator monitoring number of proposals per team employee (min. X improvements per employee per year). D. Improvement
implementations
Lean indicator monitoring percentage of improvements implemented and benefits from these improvements (in hours and euros).
E. Quality Indicating general quality for a team (in %) and quality of the three most important processes in a team (in %).
F. Business continuity
plan Indicator monitoring company’s readiness to resume operations after a critical incident, e.g., an outage.
G. Split of available FTE Indicator monitoring % of time spent by employees on productive activities (target 80 %) and remaining activities (e.g. continuous improvements, education, managerial, projects, lend out, union work, internal).
H. Team barometer Lean indicator measuring mood in the team on a quarterly basis by means of a questionnaire (the mood in the team influences productivity).
I. Performance barometer Measuring employees’ opinion on their supervisor, done on a quarterly basis by means of a questionnaire. J. Employee satisfaction
index
Evaluated employee satisfaction in six-month intervals in areas such as: living the values, development, daily work, immediate manager.
K. Yearly turnover Monitoring % of employees leaving FinCo.
If the target values of the individual indicators are not met, team members propose actions that can be taken to improve the situation. These actions are implemented (in an identical, as far as possible, or modified manner) and KPI’s serve to measure the effect of their implementation. It should be emphasized that, among the key performance indicators in FinServ presented in Table 2, there are mainly non-financial indicators; the only financial indicator is the estimated amount of savings resulting from the implemented improvements.
The third important element of the management accounting system of FinCo is the budgeting and reporting system. Generally, budgets are prepared for 18 months (each month separately) in the form of rolling financial forecast, where every quarter is rolled for yet another quarter; a key budget change is done once a year, in the summer. Budgets and reports are prepared in the Accounting Department, although delivery managers and team leaders participate in their development. Every quarter, an annual profit forecast is prepared and, e.g., the forecast for July is the sum of the actual results for two quarters plus the budget for the next two. Team reports are generated every month and delivered both to the operational departments of FinCo and also to WestBank headquarters. The budgeted and actual results are presented separately for each team with the isolation of team revenue, direct costs and allocation of indirect costs. The revenue in the team
budget is projected for one item, and the difference between revenue and costs is team profit or loss. Generally, both the budgets and control reports are not very detailed.
The last fundamental element of FinCo’s management accounting system is individual process costing. The costs of individual processes/products are not currently calculated in the case company, only information about the general costs of a team, in which several processes/products are performed, is available (Value Stream Costing). The pricing of processes performed in FinCo (groups of processes in a given team) is done on the basis of the cost-plus formula, i.e., team costs plus X % markup (the markup % is different for various teams). It should be stressed that markup is calculated only for FinCo’s support departments’ costs (e.g. air tickets are without markup but the cost of FinCo’s support departments are with markup).
It was observed during the interviews that FinCo’s management accounting system changes continuously, adjusting to the changes in the organization’s strategy and processes. MAS, according to the interviewees who were managers and accountants, supports lean management to an average degree – it was noted that it is still, in part, a set of data and not a mode of action, which is contrary to the lean management philosophy.
Another interviewee maintains that “…managers have no problem with understanding the information from MAS.” Not all opinions on MAS are the same, however – one of the Service Delivery Managers claims that ”Information delivered by MAS is understandable, but too general; its refinement would enable more accurate control.”
Analysis of Lean Management Strategy
Associations with Management Accounting and
Control Practices
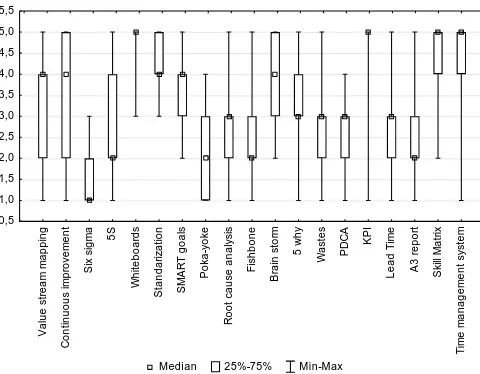
For a deeper analysis of the relationships between lean strategy and the MAS in FinCo, questionnaire research was conducted. As only 19 out of 43 managers and lean specialists responded, and also because the questionnaire was performed in one organization only, more sophisticated statistical testing was not done because no generalizations from the study are possible. The research is intended more to describe and explore the innovative management accounting practices in the interesting setting of an extended value chain company. Utilizing the questionnaire, it was possible to determine the extent to which different lean methods are used. The results are presented in Figure 1.
Median 25%-75% Min-Max
V a lu e st re a m m a p p in g C o n ti n u o u s i m p ro ve m e n t S ix s ig m a 5S W h it e b o a rd s S ta n d a ri z a ti o n S M A R T g o a ls P o ka -y o k e R o o t c a u se a n a ly si s F is h b o n e B ra in s to rm 5 w h y W a s te s P D C A K P I L e a d T im e A 3 r e p o rt S k ill M a tr ix T im e m a n a g e m e n t s ys te m 0,5 1,0 1,5 2,0 2,5 3,0 3,5 4,0 4,5 5,0 5,5
Respondents indicated to what extent their department was using each of LM methods, the scale was from 1 to 5 where the meaning was: 1 – not at
all, 2 – little, 3 – some, 4 – considerably, 5 – a great deal.
Figure 1. The Use of Different Lean Management Methods
The analysis of Figure 1 enables to draw some observation on the use of different LM methods in the case company. It is evident that the most often used methods are whiteboards, key performance indicators, the skill matrix and the time management system (the use of the first two was analyzed in the previous section of the paper). To a slightly lesser extent, methods like value stream mapping, continuous improvement, standardization, SMART goals and brain storm, are used (it has to be stressed, however, that these methods are used quite often). The use of other methods is even smaller with the smallest use of Six Sigma. Figure 2 shows the use of different management accounting practices in the case company. As described in the previous section of the paper (the research method), four MA practices were analyzed with the use of a questionnaire: employee empowerment (index EE-I, based on 9 questions),
whiteboards (index W-I, based on 6 questions), individual process costing (index IPC-I, based on 2 questions) and the management accounting system (index MAS-I, based on 3 questions). From what can be observed in Figure 2, it is clear that all four groups of management accounting practices are used in FinCo quite often, with the visual performance measurement system – whiteboards – being used most often.
Median 25%-75% Min-Max
EE-I W-I IPC-I MAS-I
0 1 2 3 4 5
Calculation of the indexes was explained in the previous section.
Figure 2. The use of Different Management Accounting Practices
An interesting issue which was identified on the basis of the conducted questionnaire was the insight into which department actually calculates individual process costs – the Accounting Department or operational departments. According to the respondents in the case company, calculations of the costs of individual processes are done, and should be done in the future, in the operational departments (mean value 3.7) rather than in Accounting Department (mean value 2.9). There was no substantial difference among Department Leaders and people more involved in lean (Lean Drivers/Ambassadors/Expert) regarding the perception of the current system of cost calculations of individual processes; a difference was noticeable, however, in the expectations of what should be done in the future. While Department Leaders were indifferent as to which department should calculate the costs
of individual processes, among the Lean
Drivers/Ambassadors/Experts, a dominant view was that it should be done not in the Accounting Department but in the operational departments. It seems to be a significant observation, which suggests that in organizations implementing lean strategy, tasks traditionally performed in accounting department are moving to operational ones.
LI-I
Position: Team/Department Position: Lean Driver/Ambassador/Expert
E
E
-I
0 1 2 2,5 3 4 5
0 1 2 3 4 5
2,5
Calculation of the indexes was explained in section 3.
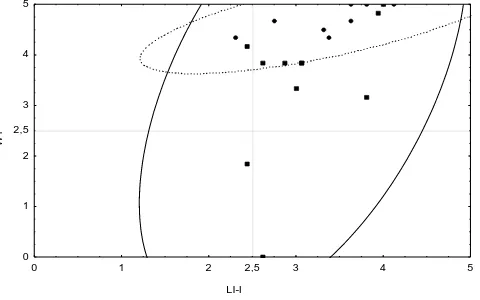
Figure 3. Scatterplots of EE-I Depending on the LI-I
LI-I
Position: Team/Department Position: Lean Driver/Ambassador/Expert
W
-I
0 1 2 2,5 3 4 5
0 1 2 3 4 5
2,5
Calculation of the indexes was explained in section 3.
Figure 4. Scatterplots of W-I Depending on the LI-I
LI-I
Position: Team/Department Position: Lean Driver/Ambassador/Expert
IP
C
-I
0 1 2 2,5 3 4 5
0 1 2 3 4 5
2,5
Calculation of the indexes was explained in section 3.
Figure 5. Scatterplots of IPC-I Depending on the LI-I
LI-I
Position: Team/Department Position: Lean Driver/Ambassador/Expert
M
A
S
-I
0 1 2 2,5 3 4 5
0 1 2 3 4 5
2,5
Calculation of the indexes was explained in section 3.
Figure 6. Scatterplots of MAS-I Depending on the LI-I
As a limited number of questionnaires was collected and in only one company, sophisticated statistical techniques were not used (the results are not generalizable). Only the correlation between lean implementation (LI-I) and management accounting variables (EE-I, W-I, IPC-I and MAS-I) were investigated using Spearman’s rank correlation coefficients (Spearman’s rho). The analysis revealed that there is a positive and significant association of LI-I with the use of EE-I, W-I, and IC-I (the correlation is significant at the p < 0.05 level – two-tailed). There was no positive and significant association, however, between LI-I and MAS-I. From the analysis, it can be observed that there is an association in the case company between 3 (out of 4) MA practices and lean implementation (LI-I). In other words, departments with a higher use of lean methods in the analyzed company also use management accounting practices more extensively. So, the answer to the first research question in the case company is rather positive – in different departments of the case company, the extensive use of lean tools goes together with the use of MA practices.
Further analysis (using Spearman’s rho) revealed that (at the p < 0.05 level – two-tailed) there is no positive and significant association between LI-I and top management support (TMS-I).
Examination
of
the
Relationships
of
Management Accounting and Control Practices
to one Another
Table 3
Spearman’s Rank Correlation Coefficients of MAS Practices
Ariable EE-I W-I IPC-I MAS-I
EE-I 1.000000 0.767254* 0.425604 -0.067829
W-I 0.767254* 1.000000 0.454367 0.062332
IPC-I 0.425604 0.454367 1.000000 -0.189036
MAS-I -0.067829 0.062332 -0.189036 1.000000
* correlation is significant at the p < 0.05 level (two-tailed)
On the basis of the conducted analysis, it can be observed that four out of the six correlations between MAS practices are positive (two out of the six are negative). From these four positive practices, one correlation is statistically significant, i.e., employee empowerment (EE-I) is positively and significantly associated with whiteboard use (W-I). There is, however, no positive and significant association (at the p < 0.05 level – two-tailed) between any other practices forming a management accounting methods package in the case company. The results of the study, as far as the answer to research question 2 is concerned, are not clear but it could be the effect of the small number of responses that were collected in the case company and possibly some unique characteristics of the case company. Further research is needed to study this relationship (some potential directions are enumerated in the conclusions).
An interesting issue that was also studied in the case company was whether there is an association between the use of management accounting practices and the level of top management support. According to Garcia-Morales et al. (2012), managers should be enthusiastic about change, to motivate and convince employees to change. Also, Ugboro and Obeng (2000) and Fullerton and McWatters (2004) stress the importance of managers’ commitment to successfully implementing TQM or JIT. Further analysis (using Spearman’s rho) revealed that (at the p < 0.05 level – two-tailed) there is a positive and significant association between two of the MA practices (EE-I and W-I) and top management support (TMS-I). There was no such association, however, between top management support (TMS-I) and individual process costing (IPC-I) and management accounting system (MAS-I).
The study also examined if lean implementation (LI-I) and top management support (TMS-I) explain the variability in the four management accounting practices examined: employee empowerment (EE-I), whiteboards (W-I), individual process costing (IPC-I) and the management accounting system (MAS-I). The analysis revealed that the only statistically significant relationship that can be observed is in the case of employee empowerment (EE-I). EE-I changes are 71 % (R2 = 71 %) explained by changes in lean implementation (LI-I) and top management support (TMS-I) (standard error = 0.52). The relationship can be shown by equation 1.
EE-I = 0.67 LI-I + 0.49 TMS-I – 0.15 + ε (Equation 1) (0.24) (0.13) (0.67)
From the conducted analysis, it cannot be concluded (with the exception of employee empowerment (EE-I) and whiteboards (W-I)) that, in the case company, MAS practices work together (as a package) to support lean strategy. Only in the case of employee empowerment
(EE-I) and whiteboards (W-(EE-I) were associations found between their use and top management support for lean initiatives (TMS-I).
Discussion and Conclusions
The conducted research was an attempt to examine management accounting system role in supporting lean strategy execution in the service organization while applying general economic principles in this analysis (Strumickas & Valanciene, 2010; Fullerton et al., 2013). Focusing on behavior of an organization in making decision concerning its strategy and MAS seems especially important from microeconomic point of view. Addressing the scientific problem and the purpose of the study, the research provides empirical evidence on the use of management accounting systems in a service company using lean strategy. It was observed that there is an association in the case company between 3 (out of 4) MAS practices and the use of lean methods, i.e., departments with a higher use of lean methods in the analyzed company also use management accounting practices more extensively. From the conducted research it cannot be concluded (with the exception of employee empowerment and whiteboards) that, in the case company, MA practices work together (as a package) to support lean strategy.
Accounting Department. It could be interpreted as the fact that management accounting tasks related to lean practices are moving from the Accounting Department to operational departments. The research also revealed that management accounting practices do not work as a package in the case company which is contrary to the literature (Malmi & Brown, 2008). MAS, according to both the managers and accountants who were interviewed, is still in part of a set of data and not a mode of action, which is contrary to the lean management philosophy.
The research has both theoretical and practical implications. From the practical point of view, it could help in understanding the relationships, between management accounting practices and lean management in a service organization setting and it also investigates how a management accounting system supports lean strategy. The research also shows that traditional responsibilities of management accountants (e.g. collecting and analysing financial and nonfinancial information) tend to partly shift to operational departments (especially nonfinancial part) and that management accountants role evolves toward designing organization’s MAS so it will be up to date and suitable for strategy execution. The theoretical influence of the research is threefold: (a) the research adds to the literature by responding to calls to provide empirical research on the functioning of MAS in a lean environment, especially in service organizations, (b) it suggests that service companies recognize the need to change MAS in response to changes in their strategy, (c) it also investigates associations between different management accounting practices, examining if they work as a package in support of lean strategy in a service organization. In sum, the study contributes to the literature by providing insights into how an MA package works in a lean service environment. These are important issues that keep MA research up to date with the practical problems of world-class organizations, and they move the knowledge of MA forward.
There are several limitations in the study which should be stressed, however. One should be careful when generalizing the results, for many different reasons. Firstly,
the research is based on one case study only, so care must be taken when interpreting the results. Secondly, it is exposed to the limitations of the case study method and, in particular, interviews, meaning that it was mainly based on perceptions. Conducting research based mainly on perceptions is an important limitation but other sources of information, like internal reports and so on, were used to confirm the findings. Thirdly, the research, like all research in the form of a case study, is not complete, because it concentrates on the use of MAS and LM tools in the analyzed organization, which is only one part of the overall system of organizational control.
The limitations of the study do open up the possibility for further research, however. The conducted research can be continued in the form of a longitudinal case study to better capture and evaluate changes in management accounting systems in service organizations using lean strategy. In a longitudinal case study, measurements of the use of LM and MAS tools year after year could be done to establish potential trends. A qualitative study could also explain the development process of MAS methods in response to LM strategy implementation in service organizations. With the use of a longitudinal case study, it could be possible to address the questions “how” and “why” the changes took place and “what” their results were. Also, surveys, which enable generalizations, could offer some possibilities for further research. Quantitative research could offer a basis to test the following hypotheses in future: H1 – management accounting system elements support lean management strategy in service organizations, H2 – management accounting system elements such as employee empowerment, whiteboards, individual process costing, and simplified management reporting are positively related to each other, forming a package in service organizations. With the use of a survey conducted among service companies with different levels of LM implementation, it could be possible to examine whether the use of different management accounting methods is correlated with the use of lean management techniques.
References
Baines, A., & Langfield-Smith, K. (2003). Antecedents to management accounting change: a structural equation approach. Accounting, Organizations and Society, 28, 675–698. https://doi.org/10.1016/S0361-3682(02)00102-2
Cadez, S., & Guilding, Ch. (2008). An explanatory investigation of an integrated contingency model of strategic management accounting. Accounting, Organizations and Society, 33, 836–863. https://doi.org/10.1016/j. aos.2008.01.003
Callen, J. L., Morel, M., & Faber, Ch. (2005). Productivity measurement and the relationship between plan performance and JIT intensity. Contemporary Accounting Research, 22(2), 271–309.https://doi.org/10.1506/GU78-6EDM-1G36-4YBQ Castellano, J. F., & Burrows, R. (2011). Relevance lost: the practice classroom gap. Management Accounting Quarterly,
12(2), 189–205.
Chenhall, R., & Langfield-Smith, K. (1998). Factors influencing the role of management accounting in the development of performance measures within organizational change programs. Accounting, Organizations and Society, 33, 361–386. https://doi.org/10.1006/mare.1998.0080
Cooper, R., & Kaplan, R.S. (1988). Measure costs right: make the right decisions. Harvard Business Review, September-October, 96–103.
DeBusk, G. K. (2012). Use lean accounting to add value to the organization. The Journal of Corporate Accounting & Finance, March/April, 35–41.https://doi.org/10.1002/jcaf.21751
Fullerton, R. R., & Kennedy, F. A. (2009). Accounting and lean strategy: an empirical analysis on the uses and effects of lean accounting. AAA Western Regionals, 36.
Fullerton, R. R., & McWatters, C. S. (2002). The role of performance measures and incentive systems in relation to the degree of JIT implementation. Accounting, Organizations and Society, 27, 711–735. https://doi.org/10.1016/S0361-3682(02)00012-0
Fullerton, R. R., & McWatters, C. S. (2004). An empirical examination of cost accounting practices. Advances in Management Accounting, 12(85), 85–113.https://doi.org/10.1016/S1474-7871(04)12004-2
Fullerton, R.R., Kennedy, F.A., Widener S.K. (2013). Management accounting and control practices in lean manufacturing environment. Accounting, Organizations and Society, 38, 50–72. https://doi.org/10.1016/j.aos.2012.10.001
Garcia-Morales, V. J., Jimenez-Barrionuevo, M. M, Gutierrez-Gutierrez, I. (2012). Transformational leadership influence on organizational performance through organizational learning and innovation. Journal of Business Research, 65, 1040– 1050.https://doi.org/10.1016/j.jbusres.2011.03.005
Gerdin, J., & Greve J. (2008). The appropriateness of statistical methods for testing contingency hypotheses in management accounting research. Accounting, Organizations and Society, 33, 995–1009. https://doi.org/10.1016/j.aos.2007.07.003 Glasworth, G. D. (1997). Visual systems: Harnessing the power of the visual workplace. New York: AMACOM.
Haskin, D. (2010). Teaching special decisions in a lean accounting environment. American Journal of Business Education, 3, 91–96.https://doi.org/10.19030/ajbe.v3i6.447
Hilker, C. (2011). Effective cost management for the lean enterprise. Cost Management, 25(4), 17–22.
Hines, P., Holweg, M., & Rich, N. (2004). Learning to evolve: a review of contemporary lean thinking. International Journal of Operations and Production Management, 24(10), 994–1011.https://doi.org/10.1108/01443570410558049
IMA, Statements on Management Accounting (SMA) (2006). Accounting for the lean enterprise: major changes to the accounting paradigm. Institute of Management Accountants, 1–35.
Johnson, H.T. (2006). Lean accounting: to become lean, shed accounting. Journal of Cost Management, available at: www.pmi.co.uk/files/pdf/Johnson_%20Lean AccountingCostManagement2006pdf.
Kennedy, F. A., & Brewer, P. C. (2006). The lean enterprise and traditional accounting. Is the honeymoon over? Journal of Corporate Accounting and Finance, Sept/Oct, 63–74.https://doi.org/10.1002/jcaf.20234
Kennedy, F. A., & Huntzinger, J. (2005). Lean accounting: measuring and managing the value stream. Cost Management, 19(5), 31–38.
Kennedy, F. A., & Maskell, B. H. (2006). Lean accounting fundamentals. Statement of management accounting. Institute of Management Accountants, 1–32.
Kennedy, F. A., & Widener, S. K. (2008). A control framework: insights from evidence on lean accounting. Management Accounting Research, 19, 301–323.https://doi.org/10.1016/j.mar.2008.01.001
Kinder, T., & Burgoyne, T. (2013). Information processing and the challenges facing lean healthcare. Financial Accountability & Management, 29(3), 271–290.https://doi.org/10.1111/faam.12016
Li, X., Sawhney, R., Arendt, E. J., & Ramasamy, K. (2012). A comparative analysis of management accounting systems’ impact on lean implementation. International Journal of Technology Management, 12(57), 33–48. https://doi.org/10.1504/IJTM.2012.043950
Lopez, P. R. A., Santos, J. F., & Arbos, L. C. (2013). Lean manufacturing: costing the value stream. Industrial Management & Data Systems, 113(5), 647–668.https://doi.org/10.1108/02635571311324124
Malmi, T., & Brown, D. (2008). Management control systems as a package: opportunities, challenges and research directions. Management Accounting Research, 19(4), 287–300. https://doi.org/10.1016/j.mar.2008.09.003
Maskell, B. H., & Baggaley, B. L. (2006). Lean accounting: what’s it all about? Target Magazine, 22(1), 35-43.
Maskell, B. H., & Kennedy, F. A. (2007). Why do we need lean accounting and how does it work? Journal of Corporate Accounting & Finance, 18(3), 59–73. https://doi.org/10.1002/jcaf.20293
Nicolau, A. (2003). Manufacturing strategy implementation and cost management systems effectiveness. European Accounting Review, 12(1), 175–199. https://doi.org/10.1080/0963818031000087871
Piercy, N., & Rich, N. (2009). Lean transformation in the pure service environment; the case of the call service centre. International Journal of Operations & Production Management, 29(1), 54–76. https://doi.org/10.1108/0144 3570910925361
Rao, M. H. S., & Bargerstock, A. S. (2013). Do lean implementation initiatives have adequate accounting support? The debate of duality. Management Accounting Quarterly, 14(4), 12–21.
Ryan, B., Scapens, R.W., & Theobald, M. (2002). Research method & methodology in finance & accounting, Thomson. Simpson, L. L., & Greenfield, A. C. (2012). Providing cost accounting support for lean initiatives. Review of Business
Research, 12(5), 30–39.
Strumickas, M., & Valanciene, L. (2010). Development of modern management accounting system. Inzinerine Ekonomika-Engineering Economics, 21(4), 377–386.
Ugboro, I. O., & Obeng, K. (2000). Top management leadership, employee empowerment, job satisfaction, and customer satisfaction in TQM organizations: An empirical study. Journal of Quality Management, 5, 247-272. https://doi.org/10.1016/S1084-8568(01)00023-2
Van der Merwe, A., & Thomson, J. (2007). The lowdown on lean accounting. Strategic Finance, February, 26–33. Widener, S.K. (2007). An empirical investigation of the levers of control framework. Accounting, Organizations and
Society, 32, 757–788. https://doi.org/10.1016/j.aos.2007.01.001
Womack, J. P., & Jones, D. T. (2003). Lean thinking: banish waste and create wealth in your corporation, Simon & Schuster, New York.
Yin, R. K. (2003). Case study research: design and methods, 3rd edition, California, Sage Publications Inc.