Vol.7 (2017) No. 3
ISSN: 2088-5334
Water Yield Analysis on Area Covered by Pine Forest at
Kedungbulus Watershed Central Java, Indonesia
Pramono, I,B
#,¥, M.T.S. Budiastuti*, T. Gunawan
€, and Wiryanto
£#
Environmental Science, SebelasMaret University (UNS), Jalan Ir. Sutami No. 36A, Jebres, Surakarta, 57126, Indonesia. ¥
Watershed Management Technology Center, Jl.A.YaniPabelan, P.O.Baox295 Surakarta 57102. Indonesia. E-mail: ibpramono@yahoo.com
*Faculty of Agriculture, SebelasMaret University (UNS), Jalan Ir. Sutami No. 36A, Jebres, Surakarta, 57126, Indonesia.
E-mail: budiastutiw@gmail.com
€
Faculty of Geography, GadjahMada University (UGM), Sekip Utara, Bulaksumur, Sinduadi, Sleman, Yogyakarta, 55281, Indonesia. E-mail: totokgunawan@yahoo.com
£Faculty of Mathematic and Natural Science, SebelasMaret University (UNS)
Jalan Ir. Sutami No. 36A, Jebres, Surakarta, 57126, Indonesia. E-mail: wuryanto_uns@yahoo.com
Abstract
—
The analysis of water yield is conducted to provide information on the availability of water resources at a particular location in a watershed. Kedungbulus watershed is located in an area with plantation of pine forest.
The pine forest area varies from 7% to 95% of the sub watershed areas. The plantation of this kind of vegetation (Pinusmerkusii) in some regions may cause water availability problem due to it may consume much more water rather than others. The objective of this study is to analyze the effect of pine forest area and its characteristics on the water yield in several of sub watershed at Kedungbulus Watershed. Direct measurement and prediction were used to estimate the water yield. A Thorthwaiteand Mather method was used in this study to estimate the water yield. It was completed with data of rainfall, air temperature, soil properties, and land cover. Stand density varies from 388 to 644 stand/hectare and diameter at breast height (DBH) varies from 20 to 40 cm. The annual rainfall during the year of 2015 at the location was 2525 mm. It was found that the water yield tends to decrease with the increase of pine forest area. The water yield of the watershed with pine forest covered with 7% was 1520 mm/year, while watershed with pine forest covered 95% was lower (1289 mm/year). In order to increase the water yield, the pine forest plantation is not recommended in a certain area with low rainfall. Modified Thorthwaite-Mather Water Balance method was successfully applied to this case with a significant increase in determination coefficient from 0.3 to 0.7.Keywords—Pinusmerkusii; Thornthwaite & Mather method; water yield; watershed
I. INTRODUCTION
In Java Island Indonesia, it is reported that pine forests are currently in the second rank as the largest forest, after teak. The teak forests occupied an area of 1,000,534 ha or 67.4%, while the pine forests cover 483 272 ha or 32.6% of the total forest area in Java [1]. The pine forests cover mountainous or the upstream of watersheds where is suitable for their growth. Due to its position in the upper watersheds, the pine forests become essential in regulating the water system underneath. In the rainy season, the existence of pine forests
is expected to control flood, while in the dry season it can drain the water that has stored during the rainy season.
Most of the catchment areas in the forest in Indonesia have not been equipped with hydrological stations. Therefore, a hydrology model should be applied in order to get information on forest and water yield.
A simple model of Thornthwaite and Mather can be used to estimate water yield. Thornthwaite & Mather method consists of two parameters i.e. soil moisture capacity and surplus water.
The method is chosen by concerning data scarcity in the forest area [7]. Zhuguo et al.[8] concluded that simple model was comparable or showing a better performance rather than complex models. It was suitable for monthly simulation of hydrological processes. The two parameters in the model used (Thornthwaite-Mather Water Balance) were sufficient to achieve a good result [8].
The Thornthwaite-Mather Water Balance model has been broadly applied in hydrology and climate applications. In many studies, it has been developed a monthly water balance model for identification climate change impact [9]-[12]. Meanwhile, Thornthwaite & Mather water balance model was also applied for evaluating monthly runoff in other research [13]-[14].
Most of the previous studies on the effect of pine forest on water yield were conducted in the various temperate zone [3]-[4], [15]-[18]. The characteristics of any zone are commonly different from others, particularly in a tropical area. Therefore, the study on the effect of pine forest on water yield in the tropical area is needed. In addition, a prediction of water yield from a watershed with different percentage of forest covers is also important to be conducted. It can proceed by a model.
II. MATERIAL AND METHOD
A. General Description of the Study Area
The study was carried out in Kedungbulus watershed. The location lies between 336,000-345,000 m at East and
9,162,500–9,170,000 m at South. Administratively, the area is located on Kebumen Regency, Central Java Province, Indonesia. The situation map on the study site is illustrated in Fig. 1.
The dominant land cover is Pine forest. This forest is managed by State Forest Corporation, namely Perum PERHUTANI. The deep soils of the study area at Ordo level are an association of Ultisols and Inceptisols. Based on data recorded in Somagede climate station in 2015 [19], it was found that the mean annual rainfall was 2525 mm/year.
B. Land Cover and Characteristics of Pine Forests
Land cover was derived from Wordview Image 2012 with a spatial resolution of 1 m. Land cover was classified based on on-screen digitizing using Geographic Information System (GIS) Software. The results of the land cover classifications were ground checked in 2015.
Thornthwaite and Mather model is known formerly as a model which was difficult to be applied, and it is still limited research on this method. In this work, the model is applied in order to study the impacts of the various percentage of pine forest on water yield in Central Java Watershed, Indonesia.
C. Prediction of Water Yield
Annual water yield was obtained by sum up of monthly water yield. The Thornthwaite-MatherWater balance model was applied to predict monthly water yield. The steps in calculating water balance are [20] :
1) Calculating the difference between precipitation (P) and Evapotranspiration (PE) each month.
2) In the months when P-PE <0 is calculated accumulation, this value is called Accumulate Potential Water Loss (APWL).
∑
−−
= (P PE) APWL
3) Soil moisture was calculated based on the value of the APWL and WHC (Water Holding Capacity) of the corresponding month with the formula:
WHC APWLi
WHCe
STi= (2)
which:
STi = Soil moisture at the corresponding month WHC = Water Holding Capacity
e = Natural number
APWLi = Accumulated Potential Water Loss at corresponding month
4) Changes in soil moisture between the corresponding month with the following month i,
(i + 1)
ST = STi - ST 1 + 1 (3) which:
ST = Soil moisture
STi = Soil moisture at the corresponding month
5) The actual monthly evapotranspiration (AE) was calculated:
If P-PE> = 0, thenAEi = Pi (4)
If P- PE <0 then AEi = Pi – ΔSTi (5) which:
P = Precipitation
PE = Potential Evapotranspiration AE = Actual Evapotranspiration
AEi = Actual Evapotranspiration at corresponding month
Pi = Precipitation at corresponding month
ΔSTi = Change in soil moisture at the corresponding month
6) Excess soil moisture (moisture surplus)
IfSTi = WHC then Si = (P-PE) – STi (6)
If STi ≠ WHC then Si = 0 (deficit) (7) which:
STi = Soil moisture at the corresponding month Si =Moisture surplus at the corresponding month
7) The shortage of soil moisture (moisture deficit)
Di = PEi – AEi (8)
which:
Di = Moisture deficit at the corresponding month
Pei = Potential Evapotranspiration at the corresponding month
AEi = Actual Evapotranspiration at the corresponding month
8) The surface runoff (RO) monthly. Calculation of runoff began shortly after the drought ends (S> 0), which in this case is used assuming 50% of the surplus will be added to the runoff next month.
ROi = (ROi - 1 + Si) x 50% (9) which:
ROi = Runoff at the corresponding month
D. Field Measurement of Water Yield
Field measurement of water yield was conducted by installing automatic water level recorder at the outlet of each watershed/sub watershed. The equipment has recorded stream water level for a certain period. Then the water level data was converted into water discharge using a rating curve. The rating curve was built based on the relationship between stream water level and discharge at several times of short measurements.
The monthly and annual water yield are obtained by summarizing the daily data. In order to estimate the accuracy of the water yield prediction using Thornthwaite and Mather, the prediction values were compared to the measured one.
III.RESULTS AND DISCUSSION
A. Land Cover Composition at EacSub Watershed
Based on the interpretation of World View, Google Earth, and field checking, pine forest areas in each sub watershed were varied from 7% to 95% of the watershed area, while dry land areas cover from 0% to 76%, settlements only cover 0% to 15% of the watershed area. The detail land cover composition is presented in Fig. 2.
Fig. 2 Spatial distribution of Land cover Kedungbulus watershed
B. Characteristics of Each Sub Watershed
The elevation in the watershed ranges from 37 to 526 msl (mean sea level), while the river slopes varied from 1 to 11%. Most of the sub watersheds have the same distribution area of slope steepness, for example, the area with slope steepness 25-45% occupied about 40% of the area in each watershed.
C. Characteristics of Pine Forest on Each Sub Watershed
D. Annual Water Yield with Different Pine Forest Covers
1) Predicted Annual Water Yield
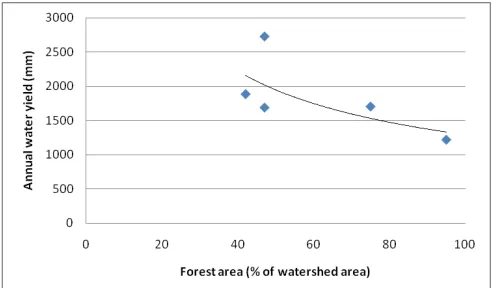
The annual water yield indicated that the increase in the percentage of pine forest area was followed by a decrease in the water yield on the watershed as presented in Fig. 3. The
highest annual water yield (1520 mm/year) was reached in 7% at the watershed with the lowest forest cover, as seen in Fig. 3. In contrast, the watershed with the highest forest cover (95%) contributed to the lowest annual water yield (1289 mm/year) as provided in Fig. 3.
TABLE I
THE CHARACTERISTICS OF PINE FOREST IN THE SUB WATERSHED
Sub watershed Area (ha) Pine forest (% of watershed area)
Mean tree height
Tree density Mean diameter
Old pine Young pine (m) (trees/ha) (cm)
Pesuruhan 74.89 28.15 1.18 16.01 480 22.2
Tapakgajah 55.33 7.44 0 24.93 342 40.22
Watujali 95.69 74.95 0 23.64 410 35.22
Kedungpane 294.28 38.91 0.3 21.98 644 29.14
Silengkong 119.76 66.3 9.2 19.61 520 25.64
Kalipoh 45.21 94.8 0 22 388 35.35
Lowereng 1411.19 40.25 3.19 20.2 585 26.85
Kalikemit 3394.35 36.43 7.61 15.29 715 19.64
Kedungbulus 3780.18 37.18 9.62 20.46 511 29.28
Fig. 3 The predicted of water yield from various pine forest area at Kedungbulus watershed in 2015
2) Measured Annual Water Yield
Field measurements of water yield have been conducted on the outlet of the sub watersheds, where 5 of 9 sub watersheds have been installed by using the automatic water level recorder. The results showed that the trend of the water yield on pine forest area is similar to the prediction. The higher percentage of pine forest area in the watershed led to the lower water yield produced. The measurement of water yield at various pine forest areas is presented in Fig. 4.
There are some possible reasons for a decrease of water yield as the increase of pine forest cover. The increase of pine forest area was in line with the increase in numbers of annual trees. It is related to a higher amount of water consumption compared to other vegetations as land covers (such as; paddy fields, mixed gardens, and agricultural dry
in eastern Mexico. It was found that annual water yield from pasture area was 10% higher than pine forest cover [22]. Another study was performed about tree watershed in Mediterranean Mexico. It was detected that the increase in the forested land by more than 16% caused a lower water yield [23].
Fig. 4 Measured water yield from various pine area at Kedungbulus sub watershed in 2015
Fig. 5 Predicted and measured annual water yield at various forest area within the watershed
In Argentine, a study was concluded that the consumptive use of pine forest were 64%. It was 33% higher than the native forest in wet and dry years, respectively. Meanwhile, measured rainfall and discharge and obtained that discharge from catchments for grassland, pine plantation, and cultivation was 49, 19, and 62 % of the rainfall, respectively [28].
Instead of the forest types, the water yield is also influenced by the structure of the forest stand [29]. The water yield could be lower when the stand and leaf area index (LAI) are higher. Regarding the tree size, it was stated that larger trees could access deeper soil water. It also consumed much water for its growth [30].
LAI has a positive correlation with crown cover and DBH [31]. Consequently, the higher LAI reflects a denser leaves or crowns. It may cause a higher evapotranspiration. The correlation between LAI values and evapotranspiration was also examined in [32]. They found that evapotranspiration was not only affected by climate factors but also depend on vegetation parameters including LAI. The higher value of LAI may cause a lower water yield [25]. In term of LAI, the evapotranspiration depends on solar radiation or the length of seasonal transpiration, stand density, and soil and water content [27], [33]-[34]. Pine forests in Kedungbulus watershed commonly have tree height between 15-24 m with DBH of 20 to 40 cm (as seen in Table I).
A closer examination of the data in Table I shows that the percentage of pine forest in Kalikemit sub watershed is lower than in Kedungbulus sub watershed. However, the water yield of Kalikemit sub watershed is somewhat lower than Kedungbulus sub watershed. The possible reason for this condition could be related to the increase of evapotranspiration. The stand density in the Kalikemit sub watershed is higher than in Kedungbulus sub watershed, and it automatically caused an increase in evapotranspiration. This finding was in accordance with the study conducted by [27] in northwestern Patagonia, Argentina. Meanwhile, another study was performing a high but with negative coefficient determination between stand density and water
yield [25]. In this research, the increase of pine forest covers at the observed sub watersheds was linked to the decrease of other land covers such as mixed gardens, agricultural lands, even settlements which less require water. Consequently, the water yield for the sub watersheds covered by high pine forest was reduced.
3) Predicted and Measured Water Yield
Results of water yield prediction showed that almost all of the results are smaller when compared to the direct measurement, except for Kalipoh sub watershed with a catchment area of 45 ha. In general, the Thronthwaite-Mather method can be used to predict annual water yield in the various forested area within the watershed as provided in Fig5.
Predicted and measured water yields on monthly base have interesting results. The relationship between predicted and measured water yield was also indicated by resulting coefficient of determination with a range from 0.14 to 0.58 (Fig6.a, 6.c, 6.e, 6.g, and 6.i). However, after modification, the monthly prediction values reversed to the previous month. The coefficient of determination was increased from 0,30 to 0,70 as shown in Fig6.b, 6.d, 6.f, 6.h and 6.j.
0 200 400 600 800 J a n F eb M a r A p r M a y J u n J u l A u g S ep O ct N o v D ec W a y er y ie ld ( m m ) a Watujali Measured Predicted 0 200 400 600 800 J a n F eb M a r A p r M a y J u n J u l A u g S ep O ct N o v D ec W a te ry ie ld ( m m ) b Watujali Measured Predicted 0 200 400 600 800 J a n F eb M a r A p r M a y J u n J u l A u g S ep O ct N o v D ec W a te ry ie ld ( m m ) c Lowereng Measured Predicted 0 200 400 600 800 J a n F eb M a r A p r M a y J u n J u l A u g S ep O ct N o v D ec W a te ry ie ld ( m m ) d Lowereng Measured Predicted 0 200 400 600 800 J a n F eb M a r A p r M a y J u n J u l A u g S ep O ct N o v D ec W a te ry ie ld ( m m ) e Kedungpane Measured Predicted 0 200 400 600 800 J a n F eb M a r A p r M a y J u n J u l A u g S ep O ct N o v D ec W a te ry ie ld ( m m ) f Kedungpane Measured Predicted 0 200 400 600 800 J a n F eb M a r A p r M a y J u n J u l A u g S ep O ct N o v D ec W a te ry ie ld ( m m ) g Kedungbulus Measured Predicted 0 200 400 600 800 J a n F eb M a r A p r M a y J u n J u l A u g S
ep Oct
N o v D ec W a te ry ie ld ( m m ) h Kedungbulus Measured Predicted 0 200 400 600 800 J a n F eb M a r A p r M a y J u n J u l A u g S ep O ct N o v D ec W a te ry ie ld ( m m ) i Kalipoh Measured Predicted 0 200 400 600 800 J a n F eb M a r A p r M a y J u n J u l A u g S ep O ct N o v D ec W a te ry ie ld ( m m ) j Kalipoh Measured Predicted
Fig. 6 Measured vs. predicted monthly water yield (mm) using the original Thornthwaite and Mather (a, c, e, g, and i) and its modification(b, d, f, h, and j)
IV.CONCLUSIONS
The water yield on Kedungbulus watersheds at Central Java Indonesia was analyzed in this study. It was found a decrease in water yield of the watershed as an increase in the pine forest area. The water yield of the watershed with pine forest covered of 7% was detected as 1,520 mm/year, while the watershed with pine forest cover with 95% was performing a lower water yield (=1,289 mm/year). In the improvement of water yield, the pine forest plantation is not recommended for
is successfully led to an increase of determination coefficient from 0.3 to 0.7.
ACKNOWLEDGEMENT
REFFERENCES
[1] Perhutani, Statistik Perhutani 2009-2013. Jakarta, 2014.
[2] W. T. Swank & J. E. Douglas, “Streamflow Greatly Reduced By Converting Deciduous Hardwood Stands To Pine,” Science (80-. )., vol. 185, no. 4154, pp. 857–859, 1974.
[3] J. M. Bosch and J. D. Hewlett, “A Review of cathment experiments to determine the effect of vegetation change on water yield and evapotranspiration,” J. Hydrol., vol. 55, pp. 3–23, 1982.
[4] H. Komatsu, T. Kume, and K. Otsuki, “The effect of converting a native broad-leaved forest to a coniferous plantation forest on annual water yield: A paired-catchment study in northern Japa.Mn,” For. Ecol. Manage., vol. 255, no. 3–4, pp. 880–886, 2008.
[5] C. Y. Xu and V. P. Singh, “A Review on Monthly Water Balance Models for Water Resources Investigations,” Water Resour. Manag., vol. 12, pp. 20–50, 1998.
[6] T. S. Steenhuis, “Scs Runoff Equation Revisited for Variable Source Runoff Areas,” Journal of Irrigation and Drainage Engineering, vol. 121. pp. 234–238, 1995.
[7] M.A. Zhuguo, D. Li, H.Yuewen, “The extreme dry/wet events in northern China during recent 100 years,” Geogr. Sci., vol. 14, no. 3, pp. 275–281, 2004.
[8] P.Bai, X.Liu, K.liang, and C.Liu. "Comparison of performance of twelve monthly water balance models in different climatic catchments of China". J.Hydrology vol.529 pp.1030.2015 .
[9] G. L. Vandewiele and N.-L. Win, “Monthly water balance models for 55 basins in 10 countries,” Hydrol. Sci. J., vol. 43, no. 5, pp. 687–699, 1998.
[10] S. Guo, “Impact of climatic change on hydrological water balance and water resource system in the Dongjiang Basin, China.,” Model. Manag. Sustain. Basin-scale Water Resoure (Proceedings a boulder Symp. July 1995)., vol. No. 231, no. 231, 1995.
[11] D. M. Amatya, R. W. Skaggs, and J. D. Gregoryb, “Effects of controlled drainage on the hydrology of drained pine plantations in the North Carolina coastal plain,” J. Hydrol., vol. 181, no. 1–4, pp. 211– 232, 1996.
[12] V. Bhagat, “Agriculture Water Balance of Micro-Watershed Using GIS Techniques,” J. Earth Sci. Res., vol. 2, no. 1, pp. 1–12, 2014.
[13] S.M. Westenbroek, V.A.Kelson, W. R. Dripps, R. J. Hunt, and K. R. Bradbury, “SWB — A Modified Thornthwaite-Mather Soil-Water- Balance Code for Estimating Groundwater Recharge,” U.S. Geol. Surv. Tech. Methods 6-A31, p. 60, 2010.
[14] L.A. Caballero, Z. M. Easton, B. K. Richards, and T. S. Steenhuis, “Evaluating the bio-hydrological impact of a cloud forest in Central America using a semi-distributed water balance model,” J. Hydrol. Hydromechanics, vol. 61, no. 1, pp. 9–20b, 2013.
[15] A.R. Hibbert, “Water yield changes converting forested catchment to grass,” Water Resour. Res., vol. 5, no. 3, pp. 634–640, 1969.
[16] A. E. Brown, L. Zhang, T. A. McMahon, A. W. Western, and R. A. Vertessy, “A review of paired catchment studies for determining changes in water yield resulting from alterations in vegetation,” J. Hydrol., vol. 310, no. 1–4, pp. 28–61, 2005.
[17] M. J. Waterloo, J. Schellekens, L. A. Bruijnzeel, and T. T. Rawaqa, “Changes in catchment runoff after harvesting and burning of a Pinus caribaea plantation in Viti Levu, Fiji,” For. Ecol. Manage., vol. 251, no. 1–2, pp. 31–44, 2007.
[18] C. B. Zou, P. F. Ffolliott, and M. Wine, “Streamflow responses to vegetation manipulations along a gradient of precipitation in the Colorado River Basin,” For. Ecol. Manage., vol. 259, no. 7, pp. 1268– 1276, 2010.
[19] T.M.Basuki, R.N.Adi, A.B.Supangat, W.W. Wijaya, N.P.Nugroho, Sudarso, and E.Sulasmiko "Surface water potential on various land cover" Research Report of Watershed Management and Technology Center.2016. Unpublished
[20] C.W.Thornthwaite. and J.R.Mather. 1957. Instructions and tables for computing potential evapotranspiration and the water balance. Drexel Institute of Technology, Laboratory of Climatology. Publication in Climatology Vol.X No. 3.1957.
[21] V. Sahin and M. J. Hall, “The effects of afforestation and deforestation on water yields,” Journal of Hydrology, vol. 178, no. 1–4. pp. 293–309, 1996.
[22] L. E. Munoz-Villers and J. J. McDonnell, “Land use change effects on runoff generation in a humid tropical montane cloud forest region,” Hydrol. Earth Syst. Sci., vol. 17, no. 9, pp. 3543–3560, 2013. [23] A. Iroumé and H. Palacios, “Afforestation and changes in forest
composition affect runoff in large river basins with pluvial regime and Mediterranean climate, Chile,” J. Hydrol., vol. 505, pp. 113–125, 2013. [24] A. Huber, A.Iroume, and J.Bathurst, “Effects of pinus radiata plantations on water balance in Chile,” Hydrol. Process., vol. 22, pp. 142–148, 2008.
[25] Y. Wang, W. Xiong, S. Gampe, N. A. Coles, P. Yu, L. Xu, H. Zuo, and Y. Wang, “A Water Yield-Oriented Practical Approach for Multifunctional Forest Management and its Application in Dryland Regions of China,” J. Am. Water Resour. Assoc., vol. 51, no. 3, pp. 689–703, 2015.
[26] B. Fahey and R. Jackson, “Hydrological impacts of converting native forests and grasslands to pine plantations, South Island, New Zealand,” Agric. For. Meteorol., vol. 84, no. 1–2, pp. 69–82, 1997.
[27] J. A. Licata, J. E. Gyenge, M. E. Fernández, T. M. Schlichter, and B. J. Bond, “Increased water use by ponderosa pine plantations in northwestern Patagonia, Argentina compared with native forest vegetation,” For. Ecol. Manage., vol. 255, no. 3–4, pp. 753–764, 2008. [28] W. Buytaert, V. Iñiguez, and B. De Bièvre, “The effects of
afforestation and cultivation on water yield in the Andean páramo,” For. Ecol. Manage., vol. 251, no. 1–2, pp. 22–30, 2007.
[29] Y. Wang, P. Yu, W. Xiong, Z. Shen, M. Guo, Z. Shi, A. Du, and L. Wang, “Water-yield reduction after afforestation and related processes in the semiarid Liupan Mountains, northwest China,” J. Am. Water Resour. Assoc., vol. 44, no. 5, pp. 1086–1097, 2008.
[30] L. P. Kerhoulas, T. E. Kolb, and G. W. Koch, “Tree size, stand density, and the source of water used across seasons by ponderosa pine in northern Arizona,” Geochim. Cosmochim. Acta, vol. 289, pp. 425–433, 2013.
[31] T. M. Basuki, “Leaf area index derived from hemispherical photograph and its correlation with above-ground forest biomass,” Indonesian Journal of Forestry Research.vol. 2, no. 1, pp. 31–41, 2015.
[32] B. J. Bond, F. C. Meinzer, and J. R. Brooks, “How Trees Infl uence the Hydrological Cycle in Forest Ecosystems,” Hydroecology Ecohydrol., pp. 7–35, 2007.
[33] T. Kumagai, M. Tateishi, Y. Miyazawa, M. Kobayashi, N. Yoshifuji, H. Komatsu, and T. Shimizu, “Estimation of annual forest evapotranspiration from a coniferous plantation watershed in Japan (1): Water use components in Japanese cedar stands,” J. Hydrol., vol. 508, pp. 66–76, 2014.
[34] T. Shimizu, T. Kumagai, M. Kobayashi, K. Tamai, S. Iida, N. Kabeya, R. Ikawa, M. Tateishi, Y. Miyazawa, and A. Shimizu, “Estimation of annual forest evapotranspiration from a coniferous plantation watershed in Japan (2): Comparison of eddy covariance, water budget and sap-flow plus interception loss,” J. Hydrol., vol. 522, pp. 250–264, 2015.