ISSN 1392-2785 ENGINEERING ECONOMICS. 2006. No 3 (48)
THEECONOMICCONDITIONSOFENTERPRISEFUNCTIONING
Business Cycle and Small Business
Valentinas Navickas
1, Reda Bagdonait
ė
1, Vytautas Juš
č
ius
21 Kauno technologijos universitetas Laisvės al. 55, LT-44309, Kaunas 2 Klaipėdos universitetas
Minijos g. 153, LT-93185, Klaipėda
The authors present the object of small business dur-ing the business cycle. The article deals with a deep analysis of the economic indicators of small business, and the behavior of small business during the business cycle. There are pointed out two main economic indica-tors – the GDP and the ratio of employment. There are used statistical data to compare the impact of small busi-ness on the whole economy in Lithuania and in the USA. This study focuses on the behavior of small business compared to large business and tries to discern if there are differences in their activities related to cyclical changes in economy. Consequently, this study will attend to isolate general cyclical relationships rather than focus narrowly on small business activity over the months of recession.
There is analyzed the period of 1999-2004 in Lithua-nian economy – there is made the analysis of part of the whole Lithuanian GDP created by small business in en-terprises with less than 250 employees; value added wealth created by small business relative to industry; also there is shown the relation of employees in small business related to different business sectors.
Different industries do react differently to cyclical changes. Some of the most cyclically sensitive indus-tries, such as construction, are predominantly small businesses. Services industries, which produce a large proportion of small business GDP, tend to be less sensi-tive to the cycle than most other sectors. It is well-known that certain industries are more prone to cyclical volatility than others. Since the distribution of small businesses across industries is more different than the distribution of large businesses across industries, the differences in the coefficients relating small and large business GDP to overall GDP could be the result of either a business-size or an industry differential.
In this article the authors made a conclusion, that small business is less sensitive than large business. The tendency for small businesses to show less sensitivity than large businesses could be explained in a couple of ways. First, this outcome could still be related to differ-ences in industrial mix. Even within these industrial sectors there are industrial sub-sectors that could be expected to react differently to cyclical behavior, and there may be difference in the small and large business shares in those sub-sectors. Secondly, there may be "capacity utilization" differences in how workers are
employed in small and large businesses. Large busi-nesses, having several people who do similar jobs, may be more able to remove some people from the payrolls than are small businesses that may have only one or a two people doing a specific job. Large businesses are also much more likely to have a variety of businesses in which they are involved. Therefore, in a downturn, for example, large businesses are more likely to shut down or sell an unprofitable division or sub-sector of their businesses than are small businesses. That results in relatively large changes in employment at one time. Keywords: business cycle, small business, movement of
GDP during the business cycle, employment.
Introduction
The cyclical behavior of economy is a focus of re-search. Research has focused on the impacts economic cycles may have on businesses of different sizes. The recent recession has made it clear that businesses of all sizes are impacted by an economic downturn. However, there is no reason to believe that the impacts of a down-turn are identical on large and small businesses. If large and small businesses do react differently to downturns or expansions in economy, is there an explanation of these differences? This study focuses on the behavior of small business compared to large business, and tries to discern if there are differences in their activities related to cycli-cal changes in economy. Consequently, this study will attempt to isolate general cyclical relationships rather than focus narrowly on small business activity over the months of recession. The primary variable that will be studied is GDP by business size, overall and by industry. Other variables, that could be expected to show some differences in cyclical behavior, will also be examined. Several cyclical indicators will also be studied to see if they are helpful in providing insights to the cyclical changes in small business, or if they can be used to pro-vide indications of change in small business GDP.
Economic cycles are defined primarily by fluctua-tions in employment and output.
macro-variables in an attempt to explain cyclical behav-ior. While the theoretical basis for what has traditionally been referred to as the business cycle is of interest in try-ing to understand cyclical impacts on small businesses. None of the most recent business cycle literature has fo-cused on impacts by business size. It is also important to note, that while the nomenclature of the "business cycle" seems to imply regularity in economic ups and downs, current theory would refute that idea. Current thinking is that the economic "cycle" is the natural pattern of an ad-justment process that is triggered by a variety of shocks to the economy. It is likely that the adjustment process does not work in the same way each time and that it may not impact businesses in the same way each time.
The theory of business cycles has evolved over the past few decades. For the most part, current business cy-cle theorists agree that cycy-cles result, not from a naturally recurring cycle in economic variables, but from unex-pected shocks to the economy. The appearance of a cycle comes from the tendency of economic variables to adjust to random shocks in a manner that results in a cyclical pattern. While economists may agree shocks are the main cause of cyclical behavior, they do not agree on which shocks will cause cyclical behavior in major macroeco-nomic variables. Nor do they agree on exactly how those shocks are transmitted throughout the economy. Real Business Cycle theorists believe that it is the deviation of productivity from its expected levels, also referred to as technological shocks, that leads to the cyclical adjustment pattern. However, that is not a universally accepted ex-planation. Even were it true, it leaves the reason for the productivity deviation unexplained. With the transmis-sion mechanism and the cyclical trigger(s) still unidenti-fied, there have been no studies that have broaden the theories to explain a differential impact on businesses by business size.
Problems of small business during the business cycle have been analysed by P. A. Muet (1993), W. Semmler (1994), E. Penrose (1995), J. Jacobs (1998), R. M. Hodgets (2000), D. Salvatore (2001), R. Grant (2002), B. Süssmuth (2003).
Lithuanian economy sooner or later will face the problem of business cycle. As a large part of GDP is cre-ated by small business, so it is very important to research the business cycle. Then having conclusions of such re-search it could be possible to predict possibilities for faster growth of Lithuanian economy.
Object of research – business cycle and small busi-ness.
Aim of the article – to determine the relation be-tween business cycle and economic indicators of small business; to compare small business during business cy-cle in Lithuania and in the USA.
Scientific innovation – the article develops and es-timates the role of small business during business cycle. It indicates significance of small business in all the econ-omy.
Methodology of research – systematic analysis of scientific economic and statistical literature, methods of mathematical comparison and generalization.
Movement of Small Business GDP during the Business Cycle
This study can only look at the relationship of the movement of small business and large business GDP dur-ing the overall business cycle. GDP by business size has been calculated for the period 1958 through 1999 for six major industrial categories.The calculations are done for industry GDP as a whole, and its major value added com-ponents: compensation, net interest, indirect taxes and nontax payments, capital consumption and profit-type income. The latter four are the noncompensation portion of GDP. Total GDP, compensation, and noncompensation are the data used for the first part of the analysis.
Several major questions could be asked. However, the main one is how does small business GDP compare to large business GDP during the business cycle? And, do the major subcomponents of GDP, compensation and noncompensation, exhibit patterns that provide informa-tion about the relainforma-tionship of the totals?
The first step in looking for possible cyclical rela-tionships is to look at what has happened to GDP by business size during the business cycles of the past few decades. Figure 1 shows the ratio of small private non-farm business GDP to large private nonnon-farm business GDP over the 1958-99 time period for which the data are available. Also marked on the Figure are the turning points of economic activity, the peaks and troughs of the business cycle, as identified by NBER.
0.2 0.4 0.6 0.8 1 1.2 1.4
1950 1960 1970 1980 1990 2000 2010
Figure 1. Ratio of Small Business GDP to Large Business GDP
Source: SBA Office of Advocacy
Note: The diamonds on the chart indicate years in which the NBER has identified cyclical peaks and the triangles are years in which there were cyclical troughs.
0.85 0.9 0.95 1 1.05 1.1 1.15
T T+1 T+2 T+3 T+4 T+5 T+6 T+7 T+8 1982 1991 1970
1958
1975
Figure 2. Private Nonfarm GDP (in dollars). Movement in the
Ratio of Small Business during recent Expansions
Source: SBA Office of Advocacy
When the ratio in Figure 1 is equal to 1, the nominal value of small business GDP is equal to large business GDP. The ratio was at a high of 1.3 in 1958, during a period of strong small business activity. Its low point is 0.96 in 1982, indicating that small business GDP was smaller than large business GDP. Since the early 1980s, the ratio has moved above one again. From Figure 1, there is no immediately noticeable pattern in the ratio related to the turning points of the business cycle. The longer – term trends in the ratio are the most dominant factors.
To better focus on potential cyclical patterns, the movement of the small to large business ratio is com-pared during the expansion phase of several recent busi-ness cycles. Figure 2 shows a comparison of the small to large business ratio for six of the business cycles of the past forty-five years.The ratio is set equal to 1.0 in the year of the trough of each business cycle and the relative movement in the ratio is tracked through the expands until the year of its peak. During 1958, 1961, and 1975 expansions, small business lost ground relative to large business. In 1970, 1982, and 1991 expansions, small business maintained its share or gained a bit.
The relationships in Figure 2 do not indicate a "typi-cal" pattern in small business activity relative to large business activity during periods of economic expansion. It would be helpful to also look at the recessions, but they are too short to analyze in this manner.
These results indicate somewhat less cyclical volatil-ity for small businesses, in that the magnitude of the changes in small business GDP is smaller than for the overall economy. However, the results also imply that, on average, a percentage point increase in the overall growth in the economy is associated with a smaller percent in-crease in small business output. Therefore, when current dollar growth rates are quite low, as they would be during a recession, small business growth rates would be even lower.When growth rates are quite high, such as during a rapid expansion, small business growth rates would again be lower than those of the economy overall.
As with Figures 1 and 2, it is not obvious from these results if the relationship is being influenced primarily by business size or by industry. It is well – known that cer-tain industries are more prone to cyclical volatility than others. Since the distribution of small businesses across industries is more different than the distribution of large businesses across industries, the differences in the coeffi-cients relating small and large business GDP to overall GDP could be the result of either a business-size or an industry differential. Consequently, a further analysis of these data is done in two-steps. The first step is to look at the relative fluctuation of each of the six industrial sec-tors to the cyclical movement in total private nonfarm GDP. This provides a basis for understanding which of the industrial sectors is more cyclical than the overall economy, and which are less cyclical. The second step is to look for cyclical patterns by business size within each industry sector. Therefore, the relative fluctuation of the large business and small business components in each of the six sectors are compared to the fluctuations in GDP for the industrial sector of which they are a part.
The importance of Lithuanian small business to the
whole economy could be seen in Figure 3.
60.2 62.6
68.2 69.1
59.1 59.3
50 55 60 65 70
1999 2000 2001 2002 2003 2004
Figure 3. Part of the whole Lithuanian GDP created by small
business in enterprises with less than 250 Employees, %.
Source: Public Institution “Statistical research”
In 2002 small and medium enterprises (less than 250 employees) made up 99.5 percent. And GDP created by them was only 62.6 percent of the whole GDP. Changes of small business GDP through the period of 1999-2002 were very unequal and there was no tendency to the growth of the whole GDP. The main reasons were struc-tural changes in Lithuanian economy and Russian crises.
The Relation of Business Size GDP to Industry GDP
From the industry analysis shown in Table (the re-sults are estimated for the period 1958-1999), it is already known that the construction industry is more cyclically sensitive than the overall economy. The coefficient on the large business component is less than one. It is a less cy-clically sensitive business size sector within this industry. The mining and manufacturing results show the opposite relationship, with large business being more cyclically sensitive than small business. Although in that industry both business sizes are within one standard deviation of unity.
Table
Movement of Small Business GDP and Large Business GDP Relative to the Industry of which they are part
SMALL BUSINESS
LARGE BUSINESS
R-Square
Mining and Manufacturing 0.7770 0.9622
Construction 0.9598 0.4116
Transportation, Communication
and Public Utilities 0.4192 0.9264 Wholesale and Retail Trade
Com-bined 0.8959 0.6522
Finance, Insurance and Real Estate 0.8129 0.4872
Services 0.9596 0.7851
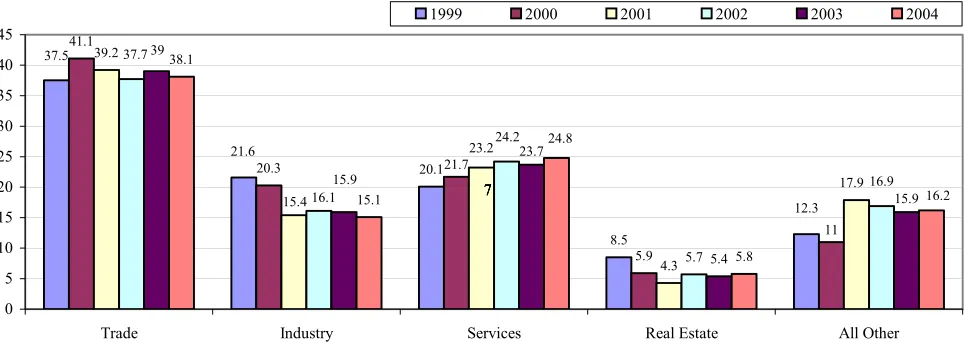
We can compare the results of Lithuanian small busi-ness related to industry in Figure 4.
over-all industrial sector in TCPU, trade, and services. Smover-all businesses are more cyclically sensitive than the sector overall in FIRE. That may reflect the dominance of small businesses in the real estate portion of that sector, while the
banking and finance portions of the industry are dominated by large businesses. However, it should also be noted that the slope coefficients for both business sizes in the FIRE and trade sectors fall within one standard deviation of unity.
20.1
8.5 41.1
20.3
5.9 39.2
4.3 5.7 5.4 38.1
15.1
5.8 12.3 21.6
37.5
11 21.7
17.9 23.2
15.4
16.9 24.2
16.1 37.7
15.9 39
23.7
15.9
16.2 24.8
0 5 10 15 20 25 30 35 40 45
Trade Industry Services Real Estate All Other
1999 2000 2001 2002 2003 2004
777
7
Figure 4. Value-added wealth created by Small Business relative to Industry, %.
Source: Public Institution “Statistical research”
The analysis of value-added sub-components high-lights a few peculiarities in the results. Looking first at the compensation components, the relationship in mining and manufacturing is very similar to the relationships seen for GDP overall. Small businesses are less sensitive, and large businesses are more sensitive than the overall industry. The coefficients in construction seem to defy the relationship discussed earlier, because the compensa-tion of both large and small businesses are shown to be more cyclically sensitive than is the overall sector. Both of the coefficients are close to one, however, indicating little difference by business size in this relationship. The coefficients for large business and small business in the trade sector are also relatively close to one, with large businesses being slightly more sensitive. Interestingly, the breakdown between wholesale and retail shows no differences by business size. Small businesses, in both the wholesale and retail sectors, are slightly less sensitive and large businesses are slightly more sensitive. The services sector shows relatively strong relationships. The move-ment in small business compensation is less volatile than is the movement in compensation for services overall, while large business compensation appears to be more sensitive. Since the services industry is less sensitive to cyclical changes than is the economy overall, this still does not mean that large service businesses should be considered cyclically sensitive, only that it seems to be more so than small service businesses.
The tendency for small businesses to show less sen-sitivity than large businesses could be explained in a couple of ways. First, this outcome could still be related to differences in industrial mix. Even within these in-dustrial sectors there are inin-dustrial sub-sectors that could be expected to react differently to cyclical behav-ior, and there may be a difference in the small and large business shares in those sub-sectors. Secondly, there may be "capacity utilization" differences in how
work-ers are employed in small and large businesses. Large businesses, having several people who do similar jobs, may be more able to remove some people from the pay-rolls than are small businesses that may have only one or a two people doing a specific job. Thus small busi-ness may react to slow busibusi-ness by that person having more slack time. Large businesses are also much more likely to have a variety of businesses in which they are involved. Therefore, in a downturn, for example, large businesses are more likely to shut down or sell an un-profitable division or sub-sector of their businesses than are small businesses. That results in relatively large changes in employment at one time.
Employment by Business Size during the Cycle
closes. (Although some establishments might move up to a group with more employees in expansionary times.) The pattern of the two groups is very similar during the cyclical changes in the economy.
Although the smaller business sizes do not seem to show declines in employment during the downturns, they
do show periods of no employment change at the troughs. Total employment does sometimes decline. This pattern may indicate that small businesses are more likely to hoard employees during a downturn than larger busi-nesses, rather than go to the expense of hiring and retrain-ing when times improve.
-0.06 -0.04 -0.02 0 0.02 0.04 0.06 0.08 0.1 0.12
1962 1966 1970 1974 1978 1982 1986 1990 1994 1998 2002 >500
<20
Figure 5.Annual Percent Change in Employment of Establishments with fewer than 20 Employees
and more than 500 Employees
Source: SBA Office of Advocacy
38.7
28.7 28.529.7 29
11.3 28
41.9
6 19.4
32.7
6.8 22.1
37.5
32.2
10.6
32.1
11.3 26.9
31.6
28.1 31.5
11.8 28.7
0 5 10 15 20 25 30 35 40 45
Trade Industry Real Estate All Other
1999 2000 2001 2002 2003 2004
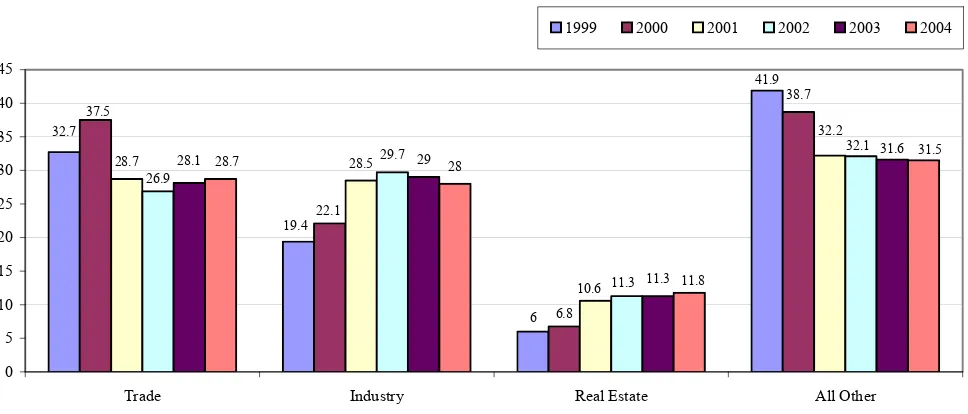
Figure 6. Employees in Small Business Related to different Business Sector, %.
Source: Public Institution “Statistical research”
In Lithuania there could be seen the tendency that most of employees are employed in small business work in trade, industry and services sectors (Figure 6).
The relationship between the percent change in the number of self-employed individuals and the percent change in small business GDP was also not strong. Nor, interestingly, was the relationship between the percentage change in the number of self employed and the percent-age change in proprietors' income. The cyclical pattern of
But, strong growth periods also provide more opportuni-ties for alternative employment. The GDP by business size data do not provide the necessary information to de-termine the set of circumstances triggering a specific di-rection of change in self-employment.
Conclusions
Different industries do react differently to cyclical changes. Some of the most cyclically sensitive industries, such as construction, are predominantly small businesses. Service industries, which produce a large proportion of small business GDP, tend to be less sensitive to the cycle than most other sectors.
Since downturns tend to increase job destruction more than it slows job creation, this could be one factor in the stability of service industries. Another factor is that services tied to health care are by their nature less sensi-tive to the ups and downs of economic activity.
Within the industry sectors, some industries show po-tential differences in how small businesses and large businesses are impacted by changes in the cycle, and some do not. In construction, small firms tend to be more negatively impacted by downturns than large firms, but do slightly better than large firms during expansion. Manufacturing/mining tends to show the opposite pattern from construction. Small businesses tend to do somewhat better in a downturn than large businesses; but, they do not grow as fast during an expansionary period.
References
1. Atamer, T. Diagnostic et decisions strategiques / T. Atamer, R. Calori. Paris: Dunod, 2002.
2. Cambell, A. Strategic Synergy / A. Cambell, K. Sommers Luch, B. P. Thomson, 1998.
3. Case, K. E. Economics / K. E. Case, R. C. Fair, M. Gartner, K. Heather. Prentice Hall, 1999.
4. Begg, D. Economics / D. Begg, S. Fisher, Dornbush R. McGraw– Hill, 2000.
5. Burda, M. Macroeconomics / M. Burda, Ch. Wyplox. Oxford Uni-versity Press, 1997.
6. Chesney, T. Competitive Information in Small Businesses / Springer, 2003. 194 p.
7. Daly, J. D. Managerial Economics / A Canadian Perspective. Illinois: Irwin. 1988, 383 p.
8. Durand, R. Enterprise et evolution economique / Paris: Belin, 2000. 9. Hodgetts, R. M. Effective Small Business Management / R. M.
Hodgetts, D. F. Kuratko. Wiley, 2000. 752 p.
10. Ханк, Д. Э. Бизнес – прогнозирование / Д. Э. Ханк, Д. Чимерн.
Вильямс, 2003. 656 с.
11. Фишер, С. Экономика / С. Фишер, П. Дорнбуш, П. Шлалензи.
Москва: Дело, 1993.
12. Grant, R. Contemporary Strategy Analysis. Oxford: Blackwell Busi-ness, 2002.
13. Hirshey, M. Managerial economics. Harcourt College Publishers, 2000. 796 p.
14. Hirshey, M. Fundamentals of managerial economics / M. Hirschey, J. L. Pappas. Chicago: The Dryden Press, 1998. 842 p.
15. Howard, D. Managerial economics: an analysis of business issues / D. Howard, L. Pun–Lee. Harlow: Pearso Education, 2001. 535 p. 16. Jacobs, J. Econometric Business Cycle Research. Springer, 1998. 238 p. 17. Mc Guigan, J. R. Managerial Economics / J. R. McGuigan, R. C.
Moyer. New York: West Publishing Company, 1989. 722 p. 18. Mankiw, N. G. Macroeconomics. Worth Publishers, 2000.
19. Мэнкью, Н. Г. Принципы экономики. Санкт-Петербург:
Питер, 1999.
20. Modelski, G. Leading Sectors and World Powers: The Coevolution of Global Economics and Politics / G. Modelski, W. R. Thompson. Columbia: University of South Carolina Press, 2000.
21. Muet, P. A. Croissance et Cycles. Theories Contemporaries. Paris: Economica, 1993.
22. Pappas, L. J. Managerial Economics / L. J. Pappas, E. F. Brigham, M. Hirshy. 2000.
23. Penrose, E. The Theory of the Growth of the Firm. Oxford University Press, 1995.
24. Peterson, W. C. Income, Employment and Economic Growth. New York: W. W. Norton & Company Inc., 1978. 631 p.
25. Salvatore, D. Managerial Economics in a Global Economy. Australia: South – Western Thomson Learning, 2001. 752 p.
26. Semmler, W. Business Cycles: Theory and Empirical Methods. Springer, 1994.
27. Süssmuth, B. Business Cycles in the Contemporary World. Springer, 2003. 165 p.
28. Truett, L. J. Managerial Economics: Analysis, Problems, Cases / L. J. Truett, D. B. Truett. South – Western Publishing Company, 1980. 415 p.
Valentinas Navickas, Reda Bagdonaitė, Vytautas Juščius
Ekonominis ciklas ir smulkusis verslas
Santrauka
Straipsnyje autoriai apibrėžia smulkųjį verslą ekonominio ciklo metu. Analizuojami pagrindiniai smulkiojo verslo vertinimo rodikliai. Nagrinėjami du pagrindiniai ekonomikos rodikliai – BVP ir užimtu-mas. Straipsnyje naudojami statistiniai duomenys vertinant ekonomi-nio ciklo įtaką smulkiajam verslui Lietuvoje ir JAV, lyginamas jo poveikis smulkiajam ir stambiajam verslui.
Skirtingos verslo šakos skirtingai reaguoja į ciklinius svyravimus. Kadangi smulkiojo verslo pasiskirstymas tarp verslo šakų visiškai skir-tingas negu stambiojo verslo pasiskirstymas tarp verslo šakų, tai koefi-cientai, nustatantys ryšį tarp smulkiojo ir stambiojo verslo BVP visame BVP gali parodyti skirtumą tarp verslo dydžio ir verslo šakos.
Šis tyrimas apima ekonomikos ciklinius svyravimus. Analizuoja-ma, kokiąįtaką ekonomikos svyravimas daro smulkiajam ir stambiajam verslui. Pastarųjų metų recesijos parodė, kad ekonomikos nuosmukis veikia ir smulkųjį, ir stambųjį verslą. Tačiau poveikis yra skirtingas, jis priklauso nuo verslo dydžio. Kadangi smulkusis ir stambusis verslas skirtingai reaguoja į ekonomikos nuosmukį ar pakilimą, kyla natūralus klausimas, ar paaiškinama, kodėl reakcija yra skirtinga. Straipsnyje atliktas tyrimas nagrinėja smulkiojo ir stambiojo verslo ekonomikos poveikio skirtumus ir aiškina skirtumus, atsirandančius skirtingo dydžio versle priklausomai nuo ekonomikos pokyčių. Pagrindinis straipsnyje analizuojamas veiksnys yra BPV priklausomai nuo verslo dydžio pra-monės šakoje; nagrinėjami ir kiti veiksniai, turintys įtakos ekonomikos svyravimams. Analizuojama keletas ciklinių rodiklių, norint nustatyti, ar jie daro įtaką cikliniams smulkiojo verslo pokyčiams, ar jie gali būti naudojami nustatant pokyčius smulkiojo verslo BVP.
Ekonomikos svyravimai nustatomi ir nusakomi pagal užimtumo ir gamybos svyravimus.
Literatūros, kurioje nagrinėjami cikliniai ekonomikos svyravi-mai priklausosvyravi-mai nuo verslo dydžio, nėra daug. Pagrindinė makroe-konominė literatūra, gvildenanti ciklinius svyravimus, lygina mikroe-konominius rodiklius su makroekonominiais rodikliais. Pastarųjų
metų literatūroje nėra išsamios analizės apie ekonominių svyravimų
poveikį smulkiajam ir stambiajam verslui atskirai. Dar svarbu pažy-mėti, kad nors terminas „ekonominis ciklas” lyg ir parodo ekonomi-kos nuosmukių bei pakilimų reguliarumą, tačiau šiuolaikinė teorija tai paneigia. Manoma, kad ekonominis „ciklas” yra natūralus prisitai-kymo procesas, veikiamas įvairių išorinių ekonomikos šokų. Teigia-ma, kad šis prisitaikymo procesas kiekvieną kartą vyksta skirtingai, ir vis kitaip paveikia verslą.
Ekonominio ciklo teorija išsivystė per pastaruosius dešimtmečius. Šiuolaikiniai ekonomistai sutaria, kad ciklai priklauso ne nuo natūraliai pasikartojančių ekonominių rodiklių cikliškumų, bet nuo netikėtų eko-nomikos šokų. Ciklo atsiradimą sąlygoja prisitaikantys prie šokų eko-nominiai rodikliai. Nors ekonomistai sutinka, kad pagrindinė ciklų
sukelia pagrindinių makroekonominių rodiklių cikliškumus. Jie taip pat nesutaria, kokį poveikį šokai daro ekonomikai. Realaus ekonominio ciklo teorijos šalininkai teigia, kad yra gamybos nukrypimas nuo lau-kiamo gamybos lygio, t.y. technologijos šokas, dėl kurio atsiranda cikliškumas. Tačiau tai nėra universalus paaiškinimas. Net jei tai ir tiesa, gamybos nukrypimas lieka nepaaiškintas. Nėra atlikta solidžių
studijų, kurios paaiškintųįtaką verslui priklausomai nuo verslo dydžio. Smulkųjį verslą ekonominio ciklo metu tyrinėjo P. A. Muet (1993), W. Semmler (1994), E. Penrose (1995), J. Jacobs (1998), R. M. Hodgetts (2000), D. Salvatore (2001), R. Grant (2002).
Lietuvos ekonomika anksčiau ar vėliau susidurs su ekonominio ciklo procesais. Kadangi didžioji dalis BVP sukuriama smulkiojo verslo, todėl labai svarbu tirti ekonominio ciklo įtaką jam. Turint tyrimo rezultatus, būtų galima sudaryti galimybes Lietuvos ekonomi-kai sparčiau vystytis.
Tyrimo objektas – ekonominis ciklas ir smulkusis verslas.
Straipsnio tikslas – nustatyti ekonominio ciklo ir smulkiojo verslo ekonominių rodiklių sąryšį; palyginti ekonominio ciklo įtaką
smulkiajam verslui Lietuvoje ir JAV.
Mokslinis naujumas – straipsnyje tiriami smulkiojo verslo eko-nominiai rodikliai ekonominio ciklo metu. Išryškinama smulkiojo verslo svarba ekonomikoje.
Tyrimo metodologija. Sisteminė mokslinės ekonominės ir sta-tistinės literatūros analizė, matematiniai palyginimo, apibendrinimo metodai.
Smulkiojo verslo BVP kaita ekonominio ciklo metu
Straipsnyje nagrinėjamas smulkiojo verslo ir stambiojo verslo BVP sąryšis ekonominio ciklo metu. Šiame tyrime šešių pagrindinių
sektorių BVP priklausomai nuo verslo dydžio JAV buvo skaičiuotas nuo 1958 iki 1999 metų.
2004 m. smulkiojo ir vidutinio verslo įmonės sudarė 99,5 proc. visųįmonių. Tačiau jų sukurtas BVP sudarė tik 62,6 proc. viso BVP. Smulkiojo verslo BVP 1999-2002 m. laikotarpiu labai nevienodas ir neišryškėja bendra BVP augimo tendencija. Pagrindinė priežastis buvo struktūriniai Lietuvos ekonomikos pokyčiai ir Rusijos krizė.
Verslo dydžio BVP sąryšis su pramonės šakos BVP
Smulkusis verslas yra mažiau jautrus negu visa pramonės šaka cikliniams pokyčiams transporto, komunikacijų, prekybos ir paslaugų
sektoriuose. Smulkusis verslas jautresnis negu visa pramonės šaka
finansų, draudimo ir nekilnojamojo turto šakose. Tai gali reikšti smulkiojo verslo dominavimą nekilnojamojo turto sektoriuje, o bankų
ir finansų sektoriuose pirmauja stambusis verslas.
Užimtumas ekonominio ciklo metu priklausomai nuo verslo dydžio
Nors užimtumas smulkiajame versle esant ekonomikos nuosmu-kiui ryškiai nemažėja, tačiau ekonomikos pakilimo sąlyginis užimtu-mo didėjimas nepastebimas. Vis dėlto, bendras užimtumo lygis kar-tais sumažėja. Tai rodo, kad smulkiajame versle išlieka maždaug vienodas užimtumo lygis ir ekonomikos nuosmukio, ir pakilimo lai-kotarpiais. Stambiajame versle – priešingai: ekonomikos pakilimo laikotarpiu pastebimas užimtumo didėjimas.
BVP augimo laikotarpiu smulkiajame versle sukuriamų darbo vietų kartais daugėja, kartais mažėja. Išryškėja du esminiai bruožai: BVP augimas sudaro palankias sąlygas smulkiajam verslui steigtis. Tačiau tuo pat metu BVP augimas suteikia daugiau glimybių alterna-tyviam įdarbinimui (ne vien smulkiajame versle). BVP pagal verslo dydį nesuteikia reikiamos informacijos apie smulkiojo verslo suku-riamų darbo vietų tendencijas.
Išvados
Skirtingi ekonomikos sektoriai įvairiai reaguoja į ciklinius po-kyčius. Kai kurie jautriai reaguojantys į ciklinius pokyčius ekonomi-kos sektoriai, tokie kaip statyba, yra smulkusis verslas. Paslaugų
sektorius, kuris sudaro didžiąją dalį smulkiojo verslo BVP, yra ma-žiausiai jautrus cikliniams pokyčiams, palyginti su kitais sektoriais.
Ekonomikos nuosmukiai užimtumo destrukciją didina labiau ne-gu lėtina darbo vietų kūrimą. Tai yra vienas veiksnių, lemiančių pa-slaugų sektoriaus stabilumą. Kitas veiksnys – paslaugų sektorius, susijęs su sveikatos apsauga, yra mažiau jautrus ekonomikos nuo-smukiams ir pakilimams.
Pramonės šakos sektoriuose pastebima skirtinga ekonominio ciklo pokyčiųįtaka smulkiajam ir stambiajam verslui. Statybos sekto-riuje smulkios firmos labiau neigimai veikiamos ekonomikos nuo-smukio nei stambios, tačiau jos daugiau išlošia ekonomikai pakilus. Kalnakasybos ir gamybos sektoriuje tendencijos yra priešingos negu statybos sektoriuje. Smulkusis verslas švelniau reaguoja į ekonomi-kos nuosmukį, palyginti su stambiuoju, tačiau jis auga lėčiau nei stambusis verslas ekonomikos pakilimo metu.
Raktažodžiai: ekonominis ciklas, BVP kaita ekonominio ciklo metu, užim-tumas.
The article has been reviewed.