Vol.7 (2017) No. 4
ISSN: 2088-5334
The Behaviour Study of Shear Wall on Concrete Structure
by Pushover Analysis
Hanafiah
#, Saloma
#, Yakni Idris
#, Julius Yahya
# #Civil Engineering Department, Faculty of Engineering, Sriwijaya University,
Jl.Raya Palembang-Inderalaya KM.32 Inderalaya, Ogan Ilir, Sumatera Selatan, 30662, Indonesia E-mail: [email protected], [email protected]
Abstract— Shear wall is applied to counter the effects of lateral load acting on a structure. Wind and seismic loads are the most common loads that shear walls are designed to carry in high rise building. This paper used four models of 10 floors building with three variations of shear wall position. The dimension of each floor is 18 m x 18 m. The building is located in Palembang with the soft soil condition and has a function as an office building. The purpose of this study is to analyze building performance, curve capacity and plastic hinge distribution from pushover analysis. The result of the study was obtained that model 4 is most effective in terms of ductility and strength building. Model 4 is able to reduce deviation 61.43% and reduce drift ratio 69.50%. Model 4 is also reduced deflection at the point of pushover analysis performance 72.64%. Model 3 has the smallest number of plastic hinges. The result of pushover analysis shows that the building performance of all model is immediate occupancy.
Keywords— shear wall; pushover analysis; drift ratio; base shear; plastic hinge
I. INTRODUCTION
The shear wall was designed to detain lateral force caused by the earthquake. Shear wall gave lateral strength which was needed to carry horizontal force from the earthquake. When shear wall received a seismic load, the shear wall will transfer lateral force to the foundation. Shear wall gave lateral ductility to prevent high rise building deformed excessively [1], [2], [3]. The different shear wall position will reduce different lateral force, a shear position that approached core position, more effective to withstand base shear than other positions [4], [5], [6].
In this study, reinforced concrete building structures with different positions of shear walls were analyzed with pushover method based on ATC-40. The building was ten floors located in Palembang. Each floor has 4 m high. There are four models of the building, i.e. the building with no shear wall and three variations of shear wall different positions.
The objective of this study is to analyze structural response caused by an earthquake on the building with shear wall position variation, to determine performance point performance level of building structure during plastic condition, to determine plastic hinge position on building structure, and to determine most effective shear wall position based on pushover analysis.
Pushover analysis is a static nonlinear analysis where earthquake influence to the building is regarded as static load, and the values were increased gradually beyond the imposition caused plastic hinge.
The objectives of pushover analysis were to predict the maximum load and maximum deformation occurred, and position a critical part of a building. Some studies show that pushover static analysis gave accurate result than nonlinear dynamic analysis [7], [8], [9], [10]. Pushover analysis produced curve capacity which described the correlation between base shear and deformation on the roof D. The graph relationship between base shear and roof deformation can be seen in Fig. 1.
Displacement
Fig. 1 Curve capacity
II. MATERIAL AND METHOD
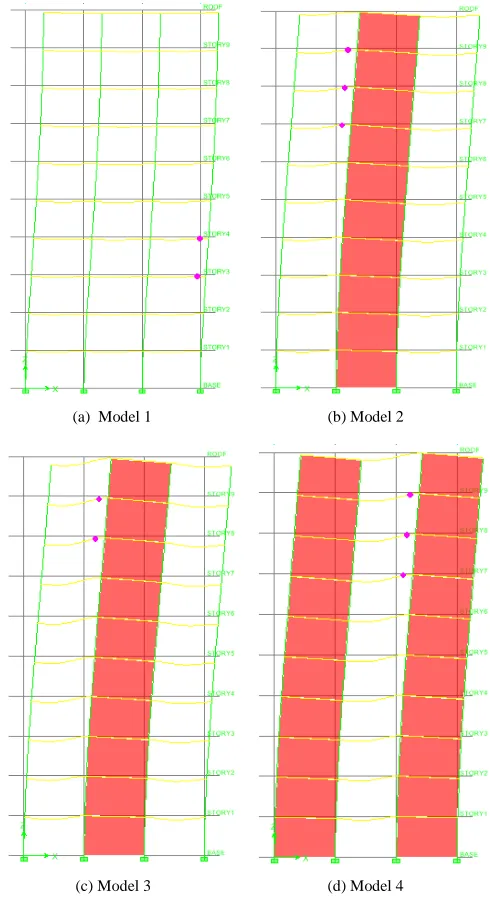
Model of building in this study was reinforced concrete building structure with three position variation of shear wall and one building without using the shear wall. Model of the building was presented in Fig. 2. Beam and column sections used in this study are shown in Table 1. The mechanical properties of concrete sections are Elastic Modulus, E = 20,000 MPa and fc’ = 50 MPa.
Building plans used is shown in Fig. 2, where red line shows that there is a shear wall in that position. Each beam span is 6 m, and each column height is 4 m. Structural frames used in this study is ten floors made in four structural model based on shear wall configuration, as shown in Fig. 2.
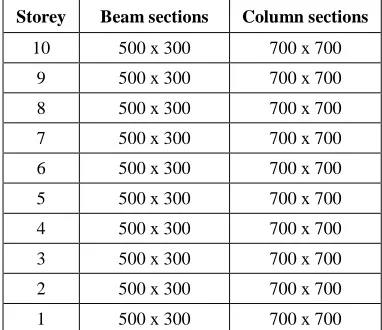
TABLEI BEAM AND COLUMN SECTIONS
Storey Beam sections Column sections
10 500 x 300 700 x 700
9 500 x 300 700 x 700
8 500 x 300 700 x 700
7 500 x 300 700 x 700
6 500 x 300 700 x 700
5 500 x 300 700 x 700
4 500 x 300 700 x 700
3 500 x 300 700 x 700
2 500 x 300 700 x 700
1 500 x 300 700 x 700
(a) Model 1 (b) Model 2
(c) Model 3 (d) Model 4 Fig. 2 Structure models
Ba
se
s
h
ea
The steps of pushover analysis in designing the structure of an earthquake resistant construction are [11], [12], [13]:
• Determining the control point to monitor the amount of displacement on the structure.
• Making the capacity curve based on various patterns of lateral force.
• Estimating the amount of lateral displacement during earthquake plan or displacement target.
• Evaluating the level of structure performance when the control point is located exactly on the target of displacement while using ATC 40.
III.RESULTS AND DISCUSSION
Based on the result of the analysis was obtained floor lateral displacement, drift ratio and the result of analysis pushover in the form of calculation of building performance based on the performance point and plastic hinge distribution.
A. Building’s Mass
The comparison of building’s mass of each model is Fig. 3. 0 500 1000 1500 2000 2500 3000 3500 4000 4500 5000
Model 1 Model 2 Model 3 Model 4
B u il d in g 's m as s (t o n )
Fig. 3 Building’s mass
B. Base Shear
The comparison of base shear of each model is shown in Fig. 4 dan Table 2.
0 50 100 150 200 250 300
Model 1 Model 2 Model 3 Model 4
B as e s h ea r (t o n )
Fig. 4 Base shear
TABLEII
THE COMPARISON OF BASE SHEAR
Model
Base Shear (ton)
VRSX (ton) VRSY (ton)
Model 1 71.582 71.582
Model 2 241.580 241.580
Model 3 247.440 247.441
Model 4 289.687 289.687
C. Lateral Displacement
Lateral displacement of the floor (storey level) in x and y direction in each model have the same value because the building has symmetrical dimension. The comparison of maximum floor lateral displacement in each model can be seen in Fig. 5 and Table 3.
TABLEIII
THE COMPARISON OF LATERAL DISPLACEMENT
Floor
δ max (mm)
Model 1 Model 2 Model 3 Model 4
10 29.445 24.249 14.905 11.357
9 28.394 21.301 13.091 9.950
8 26.774 18.276 11.227 8.514
7 24.507 15.213 9.344 7.069
6 21.622 12.164 7.479 5.641
5 18.181 9.211 5.681 4.269
4 14.271 6.452 4.008 2.996
3 10.027 4.009 2.527 1.874
2 5.712 2.015 1.311 0.958
1 1.904 0.619 0.435 0.308
Model 4 is the most effective model to reduce floor lateral displacement. That is, 61.432% compared to model 1. On the other hand, model 2 and 3 each reduced floor lateral displacement 17.647% and 50.618% compared to Model 1.
D. Drift Ratio
Fig. 6 and Table 4 shows drift ratio in each model with shear wall and without a shear wall. Model 1 is building without shear wall has most maximum drift ratio. Meanwhile, another three models used shear wall has lower drift ratio compared to model 1. The maximum point of drift ratio in the model which used shear wall is on floor 8. It indicated that shear wall caused drift ratio is on the higher floor. Therefore, the collapse of the base floor can be avoided.
Model 2 has maximum drift ratio 35.48% more effective than model 1. Model 3 has maximum drift ratio 60.35% more effective than model 1. Model 4 is most effective with drift ratio 69.50% compared to model 1.
TABLEIV DRIFT RATIO
Floor Drift ratio
Model 1 Model 2 Model 3 Model 4
10 0.00145 0.00368 0.00227 0.00176
9 0.00223 0.00378 0.00233 0.00179
8 0.00312 0.00383 0.00235 0.00181
7 0.00397 0.00381 0.00233 0.00178
6 0.00473 0.00369 0.00225 0.00172
5 0.00538 0.00345 0.00209 0.00159
4 0.00584 0.00305 0.00185 0.00140
3 0.00593 0.00249 0.00152 0.00115
2 0.00523 0.00174 0.00109 0.00081
1 0.00262 0.00077 0.00054 0.00038
Fig. 6 Drift ratio
E. Pushover Analysis
Fig. 7, Table 5, and Table 6 shows curve capacity, the relationship between base shear and displacement occurred in each model gradually when there was a static nonlinear pushover. Performance point model 1 the greatest deflection than other models. It shows that building without a shear wall is more susceptible to failure.
Based on the capacity to carry the lateral load, model 1 is the lowest. On the other hand, model 4 has the greatest capacity to carry the lateral load. Performance point model 4 is 72.64% more effective compared to model 1. Performance point model 2 is 55.97% more effective compared to model 1. Meanwhile, performance point model 3 is 68.25% more effective compared to model 1.
Plastic hinge distribution also can be seen based on certain level as shown in Table 7. Plastic hinge distribution of all models in x and y direction are the same because shear wall position is symmetrical. Performace level of each model is described in Table 8.
Fig. 7 Curve capacity
TABLEV
BASE SHEAR AND DISPLACEMENT FOR PERFORMANCE POINT
Model Base Shear (ton) Displacement (m)
1 212.914 0.29
2 930.970 0.14
3 1425.835 0.10
TABLEVI
BASE SHEAR AND DISPLACEMENT FOR FIRST PLASTIC HINGE
Model Base Shear (ton) Displacement (m)
1 37.868 0.019
2 117.060 0.012
3 153.351 0.009
4 229.115 0.009
TABLEVII BUILDING PERFORMANCE LEVEL
Symbol Explanation
Show the linear limit followed by first melt on structure
Occurred small damage on the structure. structure ductility is almost the same as before the earthquake Occurred damage from small to medium level. ductility structure was declining. but still, have big chance to collapse
Occurred serious damage on structure so that strength and ductility decreased a lot
The maximum limit of base shear was still able to withstand building
Occurred very big degradation of structural strength, so that structure condition was not stable and almost collapse
Structure was not able to withstand base shear and wrecked
TABLEVIII PERFORMANCE LEVEL
Model Maximum
total drift
Maximum inelastic drift
Performance level
1 0.0073 0.0068 IO
2 0.0035 0.0032 IO
3 0.0025 0.0023 IO
4 0.0022 0.0020 IO
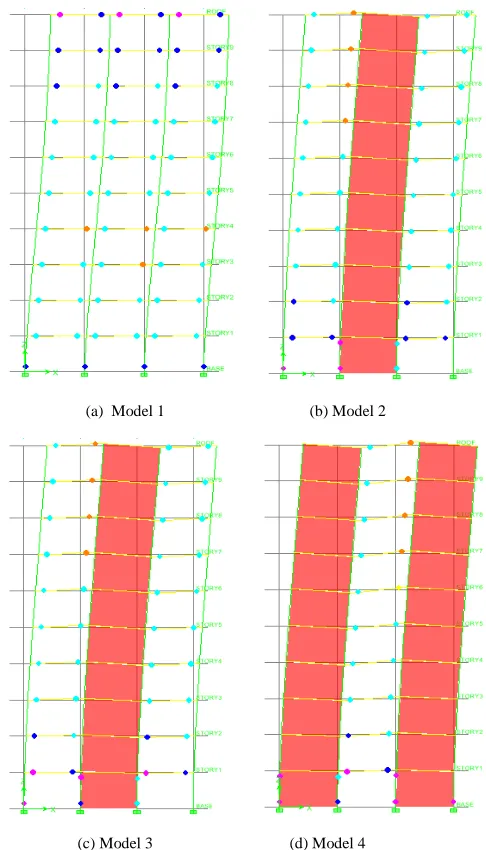
Fig. 8 (a) shows that the first plastic hinge model 1 occurred on the beam of floor 3 and 4. It means that the building was still usable.
Fig. 9 (a) shows the maximum limit of base shear which the building was able to carry. A beam of floor 4 shows the first collapse. In the last step of pushover analysis model 1, there was a collapse on floor 3 and 4 (Fig. 10(a)), while the column indicated that there was a small damage with the performance level of immediate occupancy. Collapses on floor 3 and 4 were very dangerous because it can cause total collapse.
Fig. 8(b) shows that first plastic hinge distribution on model 2. First plastic hinge occurred on floor 7 until floor 9. It shows that the usage of the shear wall can avoid collapse on the base floor. Plastic hinges occurrence shows the safety limit. In the last step of pushover analysis model 2, beam collapse was on floor 7 until floor 10 (Fig. 10(b)). In model 1, all of the columns shows building performance immediate occupancy. While model 2, the column still showed building performance operational. The usage of shear wall increased
base shear which was able to be carried by building compared to model 1 which did not use the shear wall.
First plastic hinge distribution model 3 is showed in Fig. 8(c). First plastic hinge model 3 only occurred on beam floor 8 and 9. The position of first plastic hinge occurred like model 2. That is, besides the shear wall. While in the column, plastic hinge did not occur yet. Fig. 9(c) shows the first collapse on beam floor 8 and floor 9. In the last step of pushover analysis model 3, beam collapse was occurred on floor 7 till floor 10, Fig. 10(c). The collapse of the column was in safe level with a maximum level which occurred in the column was life safety which means still far from collapse.
(a) Model 1 (b) Model 2
(c) Model 3 (d) Model 4
Fig. 8 First plastic hinge
didn’t show life safety level like model 2 and 3, but only immediate occupancy level. Meanwhile, the collapse occurred on beam floor 8 and 9 has shown the maximum limit of base shear which was able to be withstood. In the last pushover analysis, the collapse occurred on beam floor 6 to 10. Plastic hinges occurred on the column was greater than other models. Plastic hinges occurred on a column still showed life safety limit. Model 4 has lower base shear than model 3. Plastic hinge collapse occurred on model 4 was greater than model 3. Based on the plastic hinge, model 3 was the most effective model in reducing plastic hinge collapse than other models.
(a) Model 1 (b) Model 2
(c) Model 3 (d) Model 4 Fig. 9 First failure
TABLEIX PROCESS OF PLASTIC HINGE
Parameter Model 1 Model 2 Model 3 Model 4
The first plastic hinge occurs
Storey 3-4
Storey 7-9
Storey 8-9
Storey 7-9
The first collapse Storey 4
Storey 8-9
Storey 8-9
Storey 8-9 The collapse in
the last stage of analysis pushover
Storey 3-4
Storey 7-10
Storey 7-10
Storey 6-10
(a) Model 1 (b) Model 2
(c) Model 3 (d) Model 4
Fig. 10 The plastic hinges in the last step
IV.CONCLUSION
ACKNOWLEDGMENTS
The research presented in this paper was supported by a grant from Unggulan Kompetitif Universitas Sriwijaya, 2015.
REFERENCES
[1] P. P. Chandurkar and P. S. Pajgade, “Seismic analysis of RCC building with and without shear wall,” Journal of IJMER, vol. 3 pp. 1805-1810, 2013.
[2] M. D. Kevadkar and P. B. Kodag, “Lateral load analysis of RCC. Building,” Journal of IJMER, vol. 3, pp. 1428-1434, 2013.
[3] S. G. Satpute and D. B. Kulkarni, “Comparative study of reinforced concrete shear wall analysis in multistoreyed building with openings by nonlinear methods,” Journal of IJSCER, vol. 2, pp. 183-193, 2013.
[4] M. Atik, M. Sadek, and I. Shahrour, “Adaptive pushover procedure for seismic assessment of shear wall structures,” in Proc of 21th Mechanical French Congress, 2013. p.1.
[5] R. S. Mishra, V. Kushwaha, and S. Kumar, “A comparative study of different configuration of shear wall location in soft story building subjected to seismic load,” Journal of IRJET, vol. 2, pp. 513-519, 2015.
[6] A. G. Ghalimath, Y. M. Waghmare, A. A. Zadbuke, and A. R. Chaudhari, “Seismic comparative study of multistoried r.c.c building with shear wall in bare frame and masonry infill frame for various types of soil and seismic zones,” Journal of IRJET, vol.2, pp. 334-341, 2015.
[7] J. Patil and D. K. Kulkarni, “Performance based evaluation of framed reinforced concrete shear walls by pushover analysis.” Journal of IRJET. vol. 2, pp. 416-422, 2015.
[8] P. B. Oni and S. B. Vanakudre, “Performance Based Evaluation of Shear Walled RCC Building by Pushover Analysis,” International Journal of Modern Engineering Research (IJMER), vol. 3, pp 2522-2525, 2013.
[9] Q. Li and R.E. Gu, “Researches on Pushover Analysis Method of Masonry Structures with Frame-Shear Wall at the bottom,” 4th International Conference on Earthquake Engineering, Taiawan, 2006. [10] Saloma, Y. Idris, Hanafiah, N. Setiawan, “Structural Behaviour of Steel Building with Diagonal and Chevron Braced CBF (Concentrically Braced Frames) by Pushover Analysis” International Journal on Advanced Science Engineering Information Technology (IJASEIT), vol.2, pp. 716-722, 2017.
[11] Applied Technology Council 40, Seismic Evaluation and Retrofit of Concrete Buildings, Vol 1, California.
[12] FEMA 356, Prestandard and Commentary for the Seismic Rehabilitation of Buildings, Federal Emergency Management Agency, Washington DC, 2000.