DOI :10.21608/ejss.2018.5618
Introduction
Potato (
Solanum tuberosum
L.) is one of
the most important vegetables in Egypt which
gained a considerable importance as an export to
European markets (Eleiwa et al., 2012). Potato is
a short-cycle crop and present high production
capacity, it is highly influenced by the application
of different nutrients to the soil (Luz et al., 2013).
It has been usually applied high rates of
phosphate fertilizers in the cultivation, aimed at
achieving high levels of tuber yield and larger
tuber (Luz et al., 2013). Phosphorus has various
effects on tuber quality, such as tuber size and
percentage of dry matter (indicated by
specific
gravity) of the tuber (Freeman et al., 1998 and
Rosen et al., 2014).
Kafkafi (1994) considered fertigation as an
efficient method for providing and supplying
available forms of immobile elements such as P,
at a desirable level in root zone. Also successful
P-fertigation has been reported by Papadopoulos,
(2000). As regards to the effect of P source on
yield, Brito et al. (2000) revealed that the highest
commercial yield was obtained with H
3PO
4applied through trickle irrigation. Papadopoulos
and Ristimaki-Leena (2000) indicated that UP
as a source of P gave the highest yield compared
with DAP and MAP.
This study was initiated to evaluate the effect
of different sources and rates of phosphorous
fertilizers on yield and quality of potatoes tuber
grown in sandy soil under fertigation system.
Material and Methods
A field experiment was established at El-Sadat
City,
Menoufia Governorate, Egypt, during two
successive Fall (nili) seasons 2013 and 2014.
Potato (
Solanum tuberosum
L.). Cv. Diamante
was chosen as an indicator plant in this study. The
split plot design was used with three replicates
under drip irrigation system. The plot area was
17.5 m
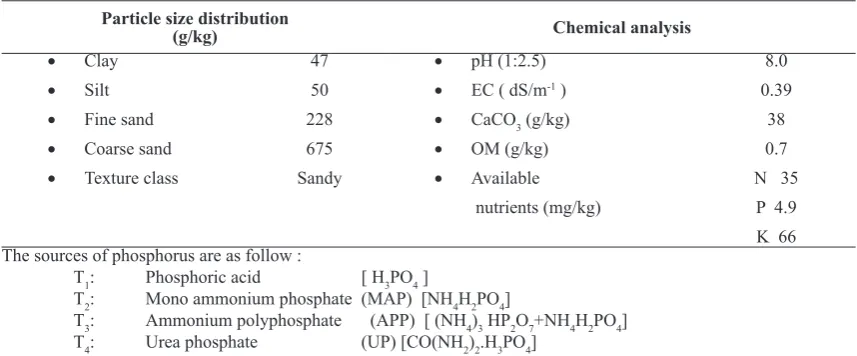
2(3.5 m x 5m). Some physical and chemical
properties of initial soil under investigation are
shown in Table 1.
A
FIELD experiment was performed in the sandy soil at El-Sadat City, MenoufieaGovernorate, Egypt, for two consuctive seasons (2013 and 2014) to investigate the effect of different sources and rates of phosphorus fertilizers on yield and tuber quality of potato (Solanum tuberosum L.) Cv. Diamante grown on sandy soil. The experiment was conducted under drip irrigation system in split design with three replicates. Four sources of phosphorus were used: phosphoric acid (H3PO4), mono ammonium phosphate (MAP), ammonium poly phosphate (APP) and urea phosphate (UP) with three rates, 50, 75 and 100 kg P2O5/fed applied
through irrigation water.The results showed significant differences among the sources and rates of phosphorus fertilizers on total yield, tuber weight, tuber diameter, specific gravity and starch
content of tuber. The data revealed that UP and APP were the best among other sources. Data also showed that yield and quality of tuber increased with increasing phosphorus rates up to 100 kg P2O5/fed. The data also presented that in both seasons, UP gave the highest P concentration in soil compared with other sources of phosphorus.
Keywords : Potato, Phosphorus fertilizers, Fertigation, Tuber quality.
Evaluation of Phosphorus Sources and Rates on The Yield and
Quality of Fertigated Potato Grown in Sandy Soil
S.T. Abou zeid and Amal L. Abd El-Latif
Three rates of phosphorus were used 50, 75
and 100 kg P
2O
5/Fed, assigned as R
1, R
2and R
3respectively. Both nitrogen and potassium were
applied according to recommendation of Ministry
of Agriculture and Land Reclamation. All P
sources H
3PO
4, MAP, APP and UP were applied
three times/week.
Whole seed tubers were planted in row 0.70 m
apart and 0.25 m within the row on October 15
th.
Soil analysis
Soil samples (0-30 cm) were taken from the
experimental site at the beginning and the end
of the experiment. Particle size distribution was
carried according to Gee and Bander (1986). Total
CaCO
3was dertermined using Collins calicimeter
(Sparks, 1996). pH, EC, organic matter , available
K, P and N were determined according to Sparks,
(1996).
Data for plant recorded
Each experimental plot was harvested after
120 days of planting, then total tuber yield (ton/
fed) were recorded. For each plot h arvested tubers
were graded into three categories according to
tuber weight i.e. small (< 30g), medium (30-60
g) and large tubers (> 60 g).
Specific gravity of
tubers was estimated, where :
specific gravity = weight in the air/weight in the
air-weight in the water.
Starch (%) was determined according to
the method described by Nandutu et al. (2002).
Phosphorus was determined in the fourth leaf from
the top after 75 days from planting and in tubers
according to the method described by Pierzynski
(2000). The obtained data were statically analyzed
according to Snedecor and Cochran (1990).
Results and Discussion
Yield
The tuber weight of each class category as
affected by phosphorus fertilizer sources at harvest
is presented in Tables 2 & 3. The data indicated
significant differences between the sources and the
rates of P fertilizer in terms of the grades of tuber
weight. In both seasons potatoes of APP treatment
had
significantly lower yield of small tuber
compared to that obtained with other sources.
Also, UP and APP had
significantly higher
tuber yield of medium and large size compared to
those supplied with other P sources. These results
were in agreement with Salem et al. (2004). The
data showed that, as the P rate increased, the
yield of medium (30-60g) and large (> 60 g ) size
tubers increased. In both seasons, potatoes of the
treatment of 100 P
2O
5/fed. had significantly lower
weight of small tuber size comparing to other P
fertilizer rates. These results agree with those of
Curless et al. (2004).
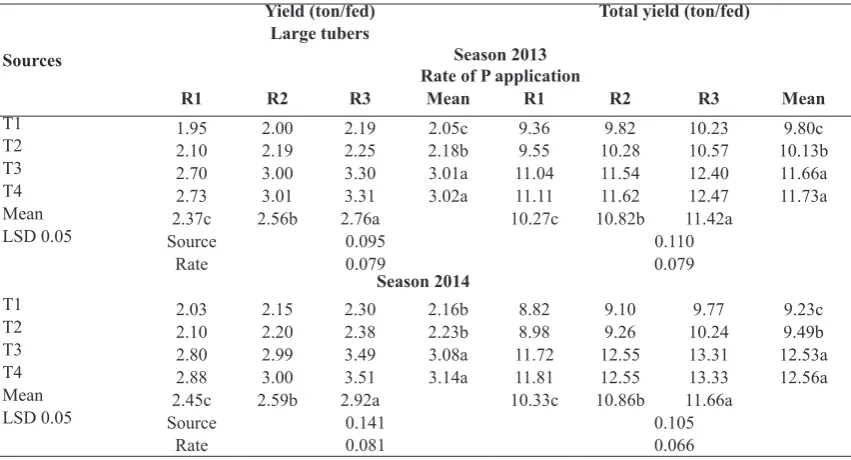
Data of Table 3 indicate that in both seasons,
total yield was
significantly affected by the P
fertilizer sources. Potato of the treatments of
APP and UP had significantly highest total yields
comparing to other sources. These results are in
agreement with Papadopoulos (2000) who found
that UP gave the highest yield.
The results showed that the increase of the
yield was proportionally with the increase of P
rate of application. Agreeing with these results,
Luz et al. (2013) mentioned that application of
high rates of phosphate fertilizers produced high
levels of both potatoes yield and larger tubers.
TABLE 1. Particles size distribution and chemical analysis of soil sample of the experimental siteParticle size distribution
(g/kg) Chemical analysis
• Clay
• Silt
• Fine sand • Coarse sand • Texture class
47 50 228 675 Sandy
• pH (1:2.5) • EC ( dS/m-1 ) • CaCO3 (g/kg) • OM (g/kg) • Available nutrients (mg/kg)
8.0 0.39
38 0.7 N 35
P 4.9 K 66 The sources of phosphorus are as follow :
T1: Phosphoric acid [ H3PO4 ]
T2: Mono ammonium phosphate (MAP) [NH4H2PO4]
Data in Table 4 indicated that all sources of
phosphorus had similar effect on tuber weight
and size in both seasons. Both UP and APP were
superior than the other P fertilizers sources.
In both seasons, increasing phosphorus rate
significantly affected tuber weight and size. For
all sources of P fertilizers, application of 100
kg P
2O
5/fed produced maximum tuber weight and
size. These results agree with those of
Alvarez-Snchez et al. (1999).
Tuber quality
The tuber
specific gravity is a measure of
quality of potato tuber which is related to the dry
matter content of the tuber, The specific gravity
was positively affected by P fertilization (Table 5).
The
specific gravity of potatoes of treatments of
the high rate of UP and APP were lower than
those recorded for other sources and rates of P
fertilizers treatments.
Significant differences
were obtained between both UP and APP and the
other sources in both seasons, while the differences
TABLE 2. Effect of source and rate of P fertilizers on yield of small and medium potato tubersSources
Yield (ton/fed)
Small tubers Medium tubers
Season 2013 Rate of P application
R1 R2 R3 Mean R1 R2 R3 Mean
T1 0.950 0.900 0.880 0.911a 6.46 6.92 7.16 6.85b
T2 0.942 0.890 0.870 0.901b 6.51 7.20 7.45 6.94b
T3 0.736 0.617 0.609 0.654c 7.60 7.92 8.49 8.00a
T4 0.730 0.610 0.600 0.647d 7.65 8.00 8.56 8.07a
Mean 0.839a 0.755b 0.740c 6.97c 7.51b 7.92a
LSD 0.05 Source 0.003 0.177
Rate 0.002 0.150
Season 2014
T1 1.01 0.950 0.880 0.947a 5.78 6.00 6.59 6.13c
T2 0.985 0.940 0.870 0.932b 5.90 6.12 6.99 6.34b
T3 0.785 0.710 0.660 0.718c 8.13 8.85 9.16 8.71a
T4 0.780 0.702 0.653 0.712d 8.15 8.85 9.17 8.72b
Mean 0.890a 0.825b 0.766c 6.99c 7.46b 7.97a
LSD 0.05 Source 0.002 0.014
Rate 0.003 0.025
TABLE 3. Effect of source and rate of P fertilizers on large tubers and total yield of potato
Sources
Yield (ton/fed) Total yield (ton/fed)
Large tubers
Season 2013 Rate of P application
R1 R2 R3 Mean R1 R2 R3 Mean
T1 1.95 2.00 2.19 2.05c 9.36 9.82 10.23 9.80c
T2 2.10 2.19 2.25 2.18b 9.55 10.28 10.57 10.13b
T3 2.70 3.00 3.30 3.01a 11.04 11.54 12.40 11.66a
T4 2.73 3.01 3.31 3.02a 11.11 11.62 12.47 11.73a
Mean 2.37c 2.56b 2.76a 10.27c 10.82b 11.42a
LSD 0.05 Source 0.095 0.110
Rate 0.079 0.079
Season 2014
T1 2.03 2.15 2.30 2.16b 8.82 9.10 9.77 9.23c
T2 2.10 2.20 2.38 2.23b 8.98 9.26 10.24 9.49b
T3 2.80 2.99 3.49 3.08a 11.72 12.55 13.31 12.53a
T4 2.88 3.00 3.51 3.14a 11.81 12.55 13.33 12.56a
Mean 2.45c 2.59b 2.92a 10.33c 10.86b 11.66a
LSD 0.05 Source 0.141 0.105
between UP and APP were
insignificant. In
this concern, Rosen et al. (2014) found that the
specific gravity levels were maximized by the
lowest rates of P applied. Also, Freeman et al.,
(1998) observed reduction in the specific gravity
of potato tuber as a function of P rates. These
results were in agreement with Khan et al. (2010)
where they reported that potatoes with low
specific gravity are preferred for preparation of
chips and French fries. Potatoes with low specific
gravity are used for canning. However, potatoes
of very high specific gravity (1.10 g/cm
3) may not
be suitable for French Fries production because
they become hard or biscuit like. So purpose of
growing potato should be kept in mind.
TABLE 4. Effect of source and rate of P fertilizers on weight and size of potato tubers
Sources
Average tuber weight (g) Tuber size (cm)
Season 2013 Rate of application
R1 R2 R3 Mean R1 R2 R3 Mean
T1 151.2 158.3 160.2 156.57b 6.24 6.30 6.48 6.37b
T2 152.3 159.9 162.3 162.17b 6.35 6.45 6.59 6.48b
T3 155.3 158.2 173.3 162.27a 6.65 6.70 6.80 6.72a
T4 157.6 160.2 174.5 164.10a 6.70 6.79 6.88 6.79a
Mean 154.1c 159.2b 167.57a 6.52b 6.56ab 6.69a
LSD 0.05 SourceRate 2.7391.298 0.1480.152
Season 2014
T1 152.1 158.3 162.2 157.53b 6.36 6.45 6.53 6.45b
T2 154.0 159.4 165.3 159.57b 6.40 6.55 6.66 6.54b
T3 160.3 168.2 174.3 167.6a 6.80 6.90 7.10 6.93a
T4 161.2 169.3 176.7 169.07a 6.85 6.99 7.20 7.01a
Mean 156.9c 163.8b 169.62a 6.60c 6.72b 6.87a
LSD 0.05 SourceRate 3.7021.117 0.1530.073
TABLE 5. Effect of source and rate of P fertilizers on specific gravity and starch content of potato
Sources
Specific gravity (gm/cm3) Starch (%) Season 2013
Rate of P application
R1 R2 R3 Mean R1 R2 R3 Mean
T1 1.092 1.089 1.082 1.088a 12.22 12.50 13.16 12.63c
T2 1.090 1.086 1.080 1.085a 14.11 14.30 15.25 14.55b
T3 1.075 1.063 1.061 1.066b 17.10 17.21 19.99 18.10a
T4 1.071 1.060 1.059 1.063b 17.25 17.36 20.48 18.36a
Mean 1.082a 1.074b 1.071b 15.17b 15.34b 17.22a
LSD 0.05 Source 0.006 1.163
Rate 0.007 0.622
Season 2014
T1 1.094 1.089 1.082 1.088a 12.71 13.10 13.82 13.21b
T2 1.090 1.085 1.080 1.085a 12.82 13.25 13.93 13.33b
T3 1.079 1.069 1.066 1.071b 18.23 19.85 21.70 19.93a
T4 1.073 1.066 1.061 1.067b 18.30 19.90 21.72 19.97a
Mean 1.084a 1.077b 1.072c 15.51c 16.52b 17.79a
LSD 0.05 Source 0.013 0.511
Rate 0.003 0.723
Data in Table 5 illustrate that starch in potato
tuber was significantly affected by both sources
and rates of P application. Among all P sources,
starch content of UP treatment was the highest.
influences of P on solids are expected as P tends
to increase starch synthesis and hasten crop
maturity. Also, Fernandes et al. (2015) found
that as the rate of P increased, the starch content
increased. Phosphorus participates in a number
of key enzymes involved in the regulation of
starch synthesis (sucrose phosphate synthase,
fructose- 1,6 – bisphosphatase and ADP-glucose
pyrophosphorylase) (Taiz and Zeiger, 2013) and
is also part of its composition, being connected to
the amylopection fraction of starch, in the form of
phosphate ester (Nielsen et al. 1994).
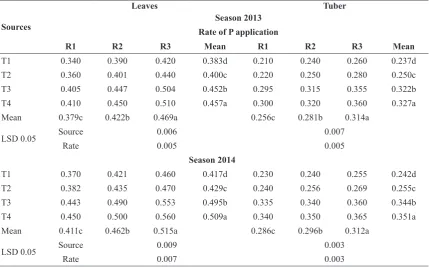
Phosphorus content in potato leaves and tubers
Data in Table 6 indicated that sources of P
fertilizer had significant effect on P percentage
of leaves and tubers at harvest (120 days after
planting). In both seasons, P percentage in leaves
and tubers of potatoes which supplied with UP
was significantly higher than those fertilized
with other sources. These results are similar to
those reported by Al-Showk et al. (1987). Eissa
(2014) also found that phosphate availability and
therefore, plant phosphorus absorption increased
with urea phosphate.
The data also indicated that increasing
phosphorus rate significantly affected P
percentage in leaves and tuber. Similar trend was
obtained by Fernandes et al. (2015).
Available phosphorus
Phosphorus content in soil at the beginning
and the end of experiment are presented in Table
7. The soil P content significantly increased as the
rate of applied P increased.
Regarding, P source, the data illustrated that
UP and APP give the highest values of P content
in soil comparing with other sources. Similar
results were obtained by Papadopoulos, (2000)
who found that more positive results obtained
with UP. Also, he reported that the concentration
of P in soil solution is increased due to the induced
acidification by UP. Eissa (2014) and Eissa et al.
(2010 ) reffered the superiority of urea phosphate
to the acidity of this fertilizer .
TABLE 6. Effect of source and rate of P fertilizers on phosphorus (%) of potato leaves and tubers
Sources
Leaves Tuber
Season 2013 Rate of P application
R1 R2 R3 Mean R1 R2 R3 Mean
T1 0.340 0.390 0.420 0.383d 0.210 0.240 0.260 0.237d
T2 0.360 0.401 0.440 0.400c 0.220 0.250 0.280 0.250c
T3 0.405 0.447 0.504 0.452b 0.295 0.315 0.355 0.322b
T4 0.410 0.450 0.510 0.457a 0.300 0.320 0.360 0.327a
Mean 0.379c 0.422b 0.469a 0.256c 0.281b 0.314a
LSD 0.05 Source 0.006 0.007
Rate 0.005 0.005
Season 2014
T1 0.370 0.421 0.460 0.417d 0.230 0.240 0.255 0.242d
T2 0.382 0.435 0.470 0.429c 0.240 0.256 0.269 0.255c
T3 0.443 0.490 0.553 0.495b 0.335 0.340 0.360 0.344b
T4 0.450 0.500 0.560 0.509a 0.340 0.350 0.365 0.351a
Mean 0.411c 0.462b 0.515a 0.286c 0.296b 0.312a
LSD 0.05 Source 0.009 0.003
TABLE 7 . Phosphorus content in soil (mg/kg) at the beginning and the end of experiment
Sources
At the beginning of experiment At the end of experiment Season 2013
Rate of P application
R 1 R2 R3 Mean R1 R2 R3 Mean
T1 7.50 9.12 11.50 9.37b 9.30 11.20 13.87 11.46b
T2 7.62 9.19 11.63 9.48b 9.40 11.31 13.90 11.54b
T3 8.05 10.45 12.18 10.22a 9.95 12.75 14.75 12.48a
T4 8.10 10.50 12.20 10.27a 10.00 12.83 14.80 12.55a
Mean 7.82c 9.81b 11.88a 9.67c 12.02b 14.33a
L.S.D 0.05
Sources 0.177 0.107
Rates 0.075 0.085
Season 2014
T1 7.90 9.38 11.61 9.53b 9.98 13.68 15.33 12.99 b
T2 7.95 9.45 11.70 9.70b 10.00 13.76 15.40 13.05b
T3 8.80 10.20 12.50 10.50a 10.70 13.80 15.60 13.37a
T4 8.89 10.25 12.54 10.56a 10.79 13.86 15.61 13.42a
Mean 8.31c 9.82b 12.09a 10.36c 13.78b 15.48a
L.S.D 0.05
Sources 0.184 0.079
Rates 0.162 0.083
References
Al-Showk, A.M., Westerman, R.L. and Weeks, D.L.(1987) Influence of phosphorus source and rates
on soil pH, extractaue phosphorus and DTPA-extractable micronutrients. J. Soil Sci. 144 (1), 36-42. Alvarez-Sanchez, E. Etchevers, J.D., Ortiz, J., Nunez,
R., Volke, V., Tijerina, L. and Martinez, A. (1999) Biomass production and phosphorus accumulation of potato as affected by phosphorus nutrition. Journal of Plant Nutrition, 22 (1), 205-217. Brito, L.T., Soarces, J.M.; Faria, C.M. and Costa, N.D.
(2000) Sources of phosphorus applied through fertigation in muskmelon. Revista Brasileira Engenharia Ambiental, 4 (1), 19-22.
Curless, M.A., Keith, A.K. and Phillips E.S. (2004) Nitrogen and Phosphorus availability from liquid dairy manure to potatoes. Amer. J. of Potato Res. 82, 287-297.
Eissa, M.A. (2014) Effect of low and high frequency of phosphorus fertigation on movement of different forms of phosphorus fertilizers in sandy calcareous soils world . Applied Sciences Journal, 31 (12), 2045-2050.
Eissa, M.A., Nafady, M., Ragheb, H. and Attia, K. (2010) Management of phosphorus fertigation for drip irrigated wheat under sandy calcareous soils. World journal of Agricultural Sciences, 6 (5), 510-516.
Eleiwa, M.E., Ibrahim, S.A. and Mohamed, M.F. (2012) Combined effect of NPK levels and foliar nutritional compounds on growth yield parameters of potato plants (Solanum tuberosum L.). African J. Microb. Res. 6, 5100-5109.
Fernandes, A.M., Soratto., R.P.; Moreno, L. A and Evangelista, R.M. (2014) Effect of phosphorus nutrition on quality of fresh tuber of potato cultivars. Bragantia Campinas, 74, 102-109. Freeman, K.L., Franz, P.R. and Jong, R.W. (1998)Effect
of phosphorus on the yield, quality and petiotar phosphorus concentrations of potatoes (cv. Russer Burbank and Kennebec) grown in the kransozem and duplex soils of Victoria. Australian Journal of Experimental Agriculture, 38, 83-93.
Gee, G.W. and Bander, J.W. (1986) Particle size analysis in: Klute A. (Ed.), Methods of Soil Analysis, Part 1: Physical and Mineralogical Methods.
Soil Sci.
Soc. Amer., Madison, WI, PP. 383-411.
Kafkafi, U. (1994) Combined irrigation and fertigation
in arid zones. Iserael. J. Plant. Sci. 42, 301-320. cited by Mohammed et al. (2004).
Khan, M.Z., Aktar, M.E., Safdar, M.N., Mahmoud, M.M., Ahmed, S. and Ahmed, N. (2010) Effect of source and level of potash on yield and quality of potato tuber. Pak. J. Bot. 42 (5), 3137-3145. Luz, J.M.Q., Queiroz, A.A., Borges, M., Oliverira,
of phosphate fertilization on phosphorus levels in foliage and tuber yields of the potato cv. Agata Semina: Ciencias Agrarias, 34, 649-656.
Nandutu, A., Carasco, J. and Hagenimana, V. (2002) Using sweet potato amylase extract for determination of starch in food stuffus. J Food. Technol. Afr. 5 (2) , 66-69.
Nielsen, T.H, Wischman, B. Envelodsen, K. and Moller, B.L. (1994) Strach phosphorylation in potato tubers proceeds concurrently with de nova biosynthesis of starch. Plant Physiology, 105, 111-117.
Papadopoulos, I. (2000) Fertigation: present situation and future prospects. In: plant nutrient management under pressurized irrigation systems in the Mediterranean region. Ryan, J. (Ed), Proceeding of the IMPHOS. International Fertigation Work Shop organized by the World. Phosphate Institute (IMPHOS). Amman Jordan. ICARDA, Aleppo, Syria, pp. 232-245.
Papadopoulos, I. and Ristimaki-Leena, M. (2000) Nitrogen and Phosphorus fertigation of tomato and eggplant. Acta Horticulturae (511), 73-79.
Pierzynski, G.M. (2000) Methods of phosphorus analysis for soils, sediments, residuals, and waters. Southern Cooperative series Bulletin No. 396, June.
Rosen, C.J., Kelling, K.A., Stark, J.C. and Porter, G.A. (2014) Optimizing phosphorus fertilizer management in potato production. American Journal of Potato Research, 91, 145-160.
Salem, A.T., Kilany, A.E. and Shaker, G.S. (2004) The influence of NPK, phosphorus source and potassium foliar application on growth and fruit quality of Thompson seedless grapevines. Acta Horticulturae, 640, 163-173.
Snedecor, G.W. and Cochran, W.G. (1990) "Statistical Methods". The lowa state univ. 7th ed. pp. 507. Sparks, D.L. (1996) "Methods of Soil Analysis. Part
3, Chemical Methods". Soil Science Society of America; and American Society of Agronomy. book series, no. 5, Madison.WI. USA.
Stark, J.C. and Love, S.L. (2003) Tuber quality : In: Potato Production Systems, Ed.: Stark, J.C. and Love, S.L. 329-343. Moscow: University of Idaho Extension.
Taiz, L. and Zeiger, E. (2013) Fisiologia vegetal. Porto Alegre: Artmed Universidade Estadual de camponas-UNICAMP. (2011). Tabela brasileira de composiçao de alimentos. Retrieved from August 8, 2014..
(Received:30/3/2016: accepted:15/5/2016)