Copy rights: © This is an Open access article distributed under the terms of Creative Commons Attribution 4. 0 International License.
(ISSN: 2472-6397)
SHORT COMMUNICATION
Nile Red Staining as a Subsidiary Method for Microplastic Quantification: A Comparison of Three Solvents and Factors Influencing Application Reliability
DOI: 10.15436/JESES.2.2.1
Matthias Tamminga
1, Elena Hengstmann
1, Elke Kerstin Fischer
1*
1 Center for Earth System Research and Sustainability (CEN), University of Hamburg, Bundesstraße 55, 20146 Hamburg,
Germany
RECEIVED DATE: 29-11-2016; ACCEPTED DATE: 02-12-2016; PUBLISHED DATE: 07-12-2016
CORRESPONDENCE AUTHORS: Elke Kerstin Fischer E-MAIL: [email protected]
CONFLICTS OF INTEREST
THERE ARE NO CONFLICTS OF INTEREST FOR ANY OF THE AUTHORS.
ABSTRACT:
The quantification of microplastics is a challenging task to the scientific community, especially as the existing analytical methods limit sample numbers due to difficulties associated with high expenses and time consuming procedures. Quantifying microplastics by staining with Nile Red can be helpful in distinguishing these particles from other inorganic (e.g. sediment) or organic (e.g. plant material) matter. In the present study, the benefits of acetone, chloroform and n-hexane as extraction solvents for Nile Red staining were investigated. For this study, various polymer types, namely high-density and low-high-density polyethylene (HDPE, LDPE), polypropylene (PP), polystyrene (PS), polyethylene terephthalate (PET), polyamide (PA), polyvinyl chloride (PVC) and cellulose acetate (CA), several post-consumer products (freezing bag, bottle cap, plastic bottle, styrofoam, fishing line, food container, pipe and cigarette butt) as well as biogenic material (algae, hard plant material, soft plant material) were used as test materials. Results indicated chloroform to be the most suitable solvent achieving recovery rates of 83.3% for the group of HDPE, LDPE, PP and PVC being the most demanded polymer types in Europe. However, the proposed method does not reach the reliable quantification capabilities of Raman-spectroscopy or Fourier transform infrared spectroscopy. Nevertheless, it can aid the assessment of microplastic abundances. In conclusion, staining with Nile Red does not require expensive equipment and allows the quick evaluation of a large number of samples for the assessment of microplastics.
KEYWORDS: environmental pollution, microlitter, microplastic identification,
INTRODUCTION
Microplastics, being defined as plastic particles smaller than 5 mm in their longitudinal orientation, gained rising scientific interest in the last decades.1-3 They can be
differentiated into primary (e.g. abrasive scrubbers) and secondary microplastics resulting from the fragmentation of larger particles, i.e. through UVB-degradation.2,4
Microplastic pollution of aquatic ecosystems can have a variety of ecological consequences. Among these the ingestion of plastic particles by aquatic species, including negative implications on their metabolis of plastics1,7 and
possible ecotoxicological impacts should be considered.8,9
The quantification of microplastics is based on the distinction of these particles from other inorganic (e.g.
sediment) or organic (e.g. plant material) matter. Various methods depending on the difference in density of particles have been applied in order to separate sediment from particularly lighter compartments of the sample.3, 10-12 The identification of microplastics as synthetic polymers
poses a major challenge due to interference issues associated 35
with organic particles.13,14 Currently, the assessment of the
polymer composition via (micro-)Fourier transform infrared (FTIR) spectroscopy,13,15,16
(micro-)Raman-spectroscopy6,17 and Pyrolysis-gaschromatography with
mass spectrometry18-20 are approaches commonly applied
composition of microplastics within a sample.21,22
However, these methods rely on expensive equipment and include time-consuming procedures.14,21
Besides spectroscopic techniques a quantitative differential staining approach based on the lipophilic dye Nile Red (9-diethylamino-5H-benzo[α]phenoxazine-5-one) has been applied.23-28 The phenoxazone Nile Red was first
used in the field of microbiology for detecting intracellular lipid droplets as well as for flow cytofluorometry29,30 and
has firstly been adapted for the purpose of microplastic analysis by Andrady.27 Though this approach does not
reveal information on the chemical structure of the particles, it allows a quick and inexpensive estimation of the microplastic load in a sample.26 The wavelength of the
maximum emission and the intensity of the fluorescence strongly depend on the specific solvent used for extraction.30 In terms of microplastic analysis acetone and
n-hexane were used so far.26-28 In microbiology, use of
n-heptane, chloroform, xylene, and ethanol solvents in Nile Red staining were additionally reported.29 Recently, Shim
et al. presented a comparison of eight possible solvents for Nile Red to improve the staining approach for the quantification of microplastics.28 Using n-hexane, recovery
rates of 98% for polyethylene (100-300µm) within a matrix of natural sand could be achieved.
This study evaluates the comparative benefits and efficiencies of acetone, chloroform and n-hexane as possible solvents for Nile Red concerning their suitability for microplastic quantification.
MATERIAL AND METHODS
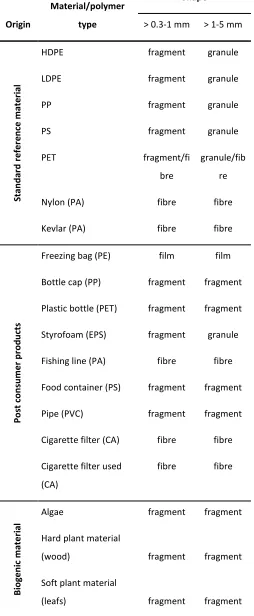
Six polymer-types (Goodfellow Inc.), nine post-consumer products made of or containing artificial polymers and three types of biogenic material were investigated regarding their condition when treated with Nile Red with varying solvents. Major characteristics in terms of size distribution of particles in different test material used for the staining experiments are displayed in table 1. All experiments were carried out for two size fractions (>0.3-1 mm and >1-5 mm). Particles belonging to the small size fraction or post consumer products were produced from larger material by cutting, grinding or carving. In total, four different shapes were considered: granules (approx. spherical, microbeads), fragments (irregular shape), fibres and films. In terms of the standard test material, irregular shapes mainly resulted from the grinding process of larger particles. The artificial polymers were transparent or whitish, except for bottle caps and fishing lines, which were coloured yellow, green or blue. For each sample ten particles were evenly placed on a filter membrane (413, VWR International, particle retention 5-13 µm) to allow the subsequent delimitation of single particles and the
detection of potential degradation caused by the solvent treatment. Since the single arrangement of small fibres (>0.3-1 mm) was challenging, small piles of these were placed at fixed spots on the filter. All filters were kept in glass petri dishes.
The Nile Red concentration was set to 1 mg/ml in chloroform and acetone.23 For the third solvent a 100 mg/l
stock solution in acetone was diluted ten times with n-hexane to generate a 10 mg/l working solution according to methods described by Song et al. (2014).26 The solutions
were thoroughly stirred until no visible particles of Nile Red remained. Each sample was treated with 1 ml of the respective solution and allowed to rest for 48 h covered with a watch glass under a fume cupboard until all moisture evaporated. Subsequently, the dyed membrane filters were photographed (Pentax K-30, exposure time 2’’, ISO 100, resolution 2420x2343) under UV-light (Omnilux UV 18W G13, 365 nm). Special care was given to avoid contamination during the whole analysis as far as possible (e.g. samples were covered whenever possible, humidity within the laboratory was increased to reduce aerial contamination).
All filters were examined for stained particles. In order to reduce the processor-imposed subjectivity a standard evaluation protocol, which utilizes image analysis techniques was applied. Fig 1 visualizes the workflow in an R environment31 using RSAGA.32 The RSAGA package
enables the usage of SAGA (System for Automated Geoscientific Analyses)33 in R. The RGB-composites were
separated into single channels. An index (I) based on the normalized difference of the red channel and the blue channel was used in this study for distinguishing microplastics from the background. The fluorescence showed to be the highest in red visible light and lowest in blue for all solvents (for the vast majority of samples). For n-hexane green fluorescence had a similar intensity as red fluorescence, in accordance to findings reported before.26,28 To allow an improved delimitation of stained
particles, a majority filter (eight surrounding pixels) was applied. This filter replaces cell/pixel values based on the majority of their adjacent cells/pixels (cells must share an edge) within a raster. As a last step, a reclassification using a threshold (Im) was carried out. Im was determined
manually and adapted for each solvent individually to avoid hindering the performance of the specific method (for acetone and chloroform Im = 0.05; for n-hexane Im =
0.03). These results were used for quantification by counting areas, that were classified as fluorescent (I ≥ Im).
Table 1: Reference material used for the staining experiment.
Origin
Material/polymer type
Shape
> 0.3-1 mm > 1-5 mm
Stan
d
ar
d
r
e
fer
en
ce
m
ate
ri
al
HDPE fragment granule
LDPE fragment granule
PP fragment granule
PS fragment granule
PET fragment/fi
bre
granule/fib re
Nylon (PA) fibre fibre
Kevlar (PA) fibre fibre
Post
c
o
n
su
m
e
r
p
ro
d
u
cts
Freezing bag (PE) film film
Bottle cap (PP) fragment fragment Plastic bottle (PET) fragment fragment Styrofoam (EPS) fragment granule
Fishing line (PA) fibre fibre
Food container (PS) fragment fragment
Pipe (PVC) fragment fragment
Cigarette filter (CA) fibre fibre Cigarette filter used
(CA)
fibre fibre
B
io
ge
n
ic
m
ate
ri
al
Algae fragment fragment
Hard plant material
(wood) fragment fragment
Soft plant material
Figure 1: Workflow for standardized evaluation of microplastic loads on a filter using SAGA-GIS in a R-environment.
RESULTS AND DISCUSSION
Table 2 shows the results of the staining experiment. In general, chloroform achieves the highest recovery rates for plastics (>1-5mm = 58.3% and >0.3-1mm = 47.8%) whilst having the lowest impact on biogenic matter (30.0% and 13.3%). The performance of n-hexane was similar, however fewer plastic (52.8% and 42.8%) and more biogenic particles (43.3% and 13.3%) got stained. The issue of co-staining biogenic matter by n-hexane was reported by Shim et al. as well.28 Compared to the other staining
methods, the results achieved by acetone do not match up with respect to the materials recovered. Differences in performance are not only related to material composition, but also highly to the shape of investigated particles, as reported previously by Shim et al.28
Fibres have proven to be especially difficult to stain with recovery rates being well below the mean of granules and fragments for all solvents. Considering the three most demanded plastic polymer types in Europe (PE, PP, PVC: 58.8% of total demand) chloroform performed better than the other solvents in obtaining good recoveries to estimate microplastic numbers.34
Furthermore, the size of each particular particle has a significant influence on recovery rates (Fig 2). While 95% of all particles larger than 1 mm could be stained, only 71.7% of their smaller counterparts were identified. This difference is very likely due to the criteria of recurring shapes. Smaller particles that were stained partially were more difficult to identify than larger ones. Thus, it is not the staining procedure itself, but rather the evaluation
method implemented that limits higher recovery rates for small particles.
Cellulose acetate in the form of cigarette butts had the tendency to (partly) melt when exposed to chloroform or acetone. This effect was even more severe for PS treated with chloroform, where the particles were completely dissolved. Hence, the quantification of cigarette butts was still possible in contrast to PS. We suspect the vulnerability of PS to be less significant when it is included in a field sample, as other compartments (e.g. sand, remaining biogenic material) should reduce the exposure intensity. Furthermore, styrofoam did not melt, indicating that surface properties play a major role in this context, as well.
In accordance to the findings of Shim et al.28 PE
and PP were effectively stained by Nile Red in solution with n-hexane, whereas PET and PA were not detectable. Concerning EPS, only the large fraction could be quantified in both n-hexane and chloroform. We hypothesize that this is due to the specific surface and density properties of the expanded material.
Compared to spectroscopic analysis methods such as (micro-)FTIR13,15,16 or Raman-(micro)spectroscopy6,17 the
could be processed within 48 hours, excluding 48 hours of drying.
The evaluation method with R based on image analysis techniques produced results being in good accordance with the visual impression of the true colour images in general (Fig 3). Additionally, edges were well
displayed, hence allowing the assessments of shapes and sizes in future investigations. Though chloroform was the only solvent showing the ability to stain fibres (Fig 4, c), these results could not be considered, as they did not match the criteria of the evaluation protocol.
Table 2: Recovery rates in percent (n = 10) of investigated reference material.
Solvent
Aceton Chloroform n-Hexan
Fraction (mm) >1 >0.3 >1 >0.3 >1 >0.3
St
andar
d
r
e
fe
re
n
ce
m
at
e
ri
al
HDPE 0 10 100 100 90 70
LDPE 100 100 100 90 100 90
PP 0 100 100 100 100 100
PS 100 100 - - 100 100
PET, granules 0 100 20 100 0 0
PET, fibres 0 0 0 30 0 0
Nylon (PA) 0 0 0 0 0 0
Kevlar (PA) 0 0 0 0 0 10
P
os
t
con
su
m
e
r
pr
od
uct
s
Freezing bag (PE) 20 0 70 30 0 0
Bottle cap (PP) 30 0 100 10 40 0
Plastic bottle (PET) 100 100 100 100 0 0
Styrofoam (EPS) 0 0 100 40 100 0
Fishing line (PA) 50 40 60 40 20 0
Food container (PS) 100 100 - - 100 100
Pipe (PVC) 100 100 100 100 100 100
Cigarette filter (CA) 60 0 90 50 100 100
Cigarette filter used (CA) 40 0 100 70 100 100
B
ioge
ni
c
m
at
e
ri
al
Algae 10 0 10 0 0 0
Hard plant material (wood, bark) 60 100 20 10 30 10
Soft plant material (leafs) 80 70 60 30 100 30
R
e
co
ve
ry
r
at
es
Plastics 39,4 41,7 58,3 47,8 52,8 42,8
Biogenic material 50,0 56,7 30,0 13,3 43,3 13,3
Granules 33,3 - 70,0 - 81,7
-Fragments 82,5 78,9 75,0 66,7 60,0 62,2
Fibres 25,0 6,7 41,7 31,7 36,7 35,0
Films 20,0 0,0 70,0 30,0 0,0 0,0
PE, PP, PVC 41,7 51,7 95,0 71,7 71,7 60,0
Figure 2: Images of selected stained particles photographed under UV-light.
Figure 3:Stained particles of PVC (pipe) using acetone (a), PS (food container) using n-hexane (b) and PET fibres using
chloroform (c).
CONCLUSIONS
In general, chloroform has demonstrated to be the most suitable solvent in quantifying microplastics by achieving recovery rates of 83.3% for the most demanded polymer types in Europe. Nevertheless, this method does not reach the reliability of spectroscopic approaches like (micro-)FTIR or Raman-(micro)spectroscopy. Still, quantifying
by analytical approaches. In such cases, the proposed method can support the investigation of the remaining sample volume to allow an ensured quantitative extrapolation of the findings. Moreover, it can be particularly useful when recovery rates of test material, blank samples and spiked reference samples are to be assessed in terms of quality assurance for laboratory processing and protocols applied. All solvents showed the tendency to at least partly stain biogenic matter, which emphasizes the necessity to embed a pre-treatment for the destruction of biogenic matter into the operational protocol for microplastic identification. The transferability of the proposed method towards the analysis of field samples needs further assessment.
AUTHOR'S CONTRIBUTIONS
Matthias Tamminga: Substantial contributions to conception and design, or acquisition of data, or analysis and interpretation of data. Involvement in drafting the manuscript or revising it critically for important intellectual content.
Elena Hengstmann: Substantial contributions to conception and design, or acquisition of data, or analysis
and interpretation of data. Involvement in drafting the manuscript or revising it critically for important intellectual content.
Elke Fischer: Involvement in drafting the manuscript or revising it critically for important intellectual content.
ACKNOWLEDGEMENTS
The authors would like to thank Constantin vom Bruch for kindly revising the language of this article.
REFERENCES
1) Galgani F. Marine litter, future prospects for research. Frontiers in Marine Science;2: 1-5. Available from:
http://dx.doi.org/10.3389/fmars.2015.00087. 2) Andrady AL. Microplastics in the marine environment.
Marine Pollution Bulletin. 2011; 62:1596-1605.
Available from:
http://dx.doi.org/10.1016/j.marpolbul.2011.05.030. 3) Thompson RC, Olsen Y, Mitchell RP, Davis A, Rowland SJ, John AW, et al. Lost at sea: where is all the plastic? Science [Internet]. 2004;304(5672):838–838. Available from: http://dx.doi.org/10.1126/science.1094559. 4) Moore CJ, Lattin GL, Zellers AF. Quantity and type of
plastic debris flowing from two urban rivers to coastal waters and beaches of Southern California. Journal of Integrated Coastal Zone Management. 2011;11(1):65-73.
5) Lusher AL, Hernandez-Milian G, O'Brien J, Berrow S, O'Connor I, Officer R. Microplastic and macroplastic ingestion by a deep diving, oceanic cetacean: the True's beaked whale Mesoplodon mirus. Environmental Pollution. 2015;199: 185-191.
6) Cole M, Lindeque P, Fileman E, Halsband C, Goodhead R, Moger J, et al. Microplastic Ingestion by Zooplankton. Environmental Science & Technology [Internet]. 2013 Jun 6 [cited 2015 Mar 21]. Available from: http://dx.doi.org/10.1021/es400663f.
7) Camedda A, Marra S, Matiddi M, Massaro G, Coppa S, Perilli A, Ruiu A, Briguglio P, de Lucia GA. Interaction between loggerhead sea turtles (Caretta caretta) and marine litter in Sardinia (Western Mediterranean Sea). Marine Environmental Research. 2014;100: 25-32. 8) Galloway TS. Micro- and nano-plastics and human
health. In: Marine Anthropogenic Litter. 2015: 343-366.
9) Fossi MC, Coppola D, Baini M, Giannetti M, Guerranti C, Marsili L, Panti C, de Sabata E, Cló S. Large filter feeding marine organisms as indicators of microplastic in the pelagic environment: the case studies of the Mediterranean basking shark (Cetorhinus maximus) and fin whale (Balaenoptera physalus). Mar. Environ. Res. 2014;100: 17-24. Available from:
http://dx.doi.org/10.1016/j.marenvres.2014.02.002. 10)Kedzierski M, Le Tilly V, Bourseau P, Bellegou H, César G, Sire O, et al. Microplastics elutriation from sandy sediments: A granulometric approach. Marine Pollution Bulletin [Internet]. 2016 Apr [cited 2016 Apr
15]; Available from:
http://dx.doi.org/10.1016/j.marpolbul.2016.03.041. 11) Claessens M, Van Cauwenberghe L, Vandegehuchte
MB, Janssen CR. New techniques for the detection of microplastics in sediments and field collected organisms. Marine Pollution Bulletin [Internet]. 2013 May [cited 2015 Mar 21];70(1-2):227–33. Available from:
http://dx.doi.org/10.1016/j.marpolbul.2013.03.009. 12) Imhof HK, Schmid J, Niessner R, Ivleva NP, Laforsch C.
A novel, highly efficient method for the separation and quantification of plastic particles in sediments of aquatic environments. Limnology and Oceanography: Methods. 2012;10(7):524–37.
13) Song YK, Hong SH, Jang M, Han GM, Rani M, Lee J, et al. A comparison of microscopic and spectroscopic identification methods for analysis of microplastics in environmental samples. Marine Pollution Bulletin [Internet]. Forthcoming 2015 [citied 2016 Aug 15].
Available from:
14)Hidalgo-Ruz V, Gutow L, Thompson RC, Thiel M. Microplastics in the Marine Environment: A Review of the Methods Used for Identification and Quantification. Environmental Science & Technology [Internet]. 2012 Mar 20 [cited 2015 Mar 21];46(6):3060–75. Available from: http://dx.doi.org/10.1021/es2031505.
15)Tagg AS, Sapp M, Harrison JP, Ojeda JJ. Identification and Quantification of Microplastics in Wastewater Using Focal Plane Array-Based Reflectance Micro-FT-IR Imaging. Analytical Chemistry [Internet]. 2015 Jun 16 [cited 2016 Mar 28];87(12):6032–40. Available from: http://dx.doi.org/10.1021/acs.analchem.5b00495. 16)Cole M, Webb H, Lindeque PK, Fileman ES, Halsband C,
Galloway TS. Isolation of microplastics in biota-rich seawater samples and marine organisms. Sci Rep [Internet]. 2014 31;4. Available from: http://dx.doi.org/10.1038/srep04528.
17) Van Cauwenberghe L, Vanreusel A, Mees J, Janssen CR. Microplastic pollution in deep-sea sediments. Environmental Pollution [Internet]. 2013;182:495–9.
Available from:
http://dx.doi.org/10.1016/j.envpol.2013.08.013. 18) Dekiff JH, Remy D, Klasmeier J, Fries E. Occurrence and
spatial distribution of microplastics in sediments from Norderney. Environmental Pollution [Internet]. 2014a Mar [cited 2015 Mar 21];186:248–56. Available from: http://dx.doi.org/10.1016/j.envpol.2013.11.019. 19)Nuelle M-T, Dekiff JH, Remy D, Fries E. A new
analytical approach for monitoring microplastics in marine sediments. Environmental Pollution [Internet]. 2014 Jan [cited 2015 Mar 21];184:161–9. Available from: http://dx.doi.org/10.1016/j.envpol.2013.07.027. 20)Fries E, Dekiff JH, Willmeyer J, Nuelle M-T, Ebert M, Remy D. Identification of polymer types and additives in marine microplastic particles using pyrolysis-GC/MS and scanning electron microscopy. Environmental Science: Processes & Impacts [Internet]. 2013 [cited 2015 Mar 21];15(10):1949. Available from: http://dx.doi.org/10.1039/C3EM00214D.
21)Ivleva NP, Wiesheu AC, Niessner, R. Microplastic in Aquatic Ecosystems. Angewandte Chemie International Edition [Internet]. 2016 Sep [cited 2016 Sep 20]: 1-50. Available from: http://dx.doi.org/10.1002/anie.201606957.
22) Löder MG, Gerdts G. Methodology used for the detection and identification of microplastics—A critical appraisal. In: Marine anthropogenic litter. Springer; 2015: 27-201.
23)Fischer EK, Paglialonga L, Czech E, Tamminga M. Microplastic pollution in lakes and lake shoreline sediments – A case study on Lake Bolsena and Lake
Chiusi (central Italy). Environmental Pollution. 2016 Mar 4;213:648-57.
24) Desforges J-PW, Galbraith M, Dangerfield N, Ross PS. Widespread distribution of microplastics in subsurface seawater in the NE Pacific Ocean. Marine Pollution Bulletin [Internet]. 2014 Feb [cited 2015 Mar
20];79(1-2):94–9. Available from:
http://dx.doi.org/10.1016/j.marpolbul.2013.12.035. 25)Shim WJ, Song YK, Hong SH, Jang M, Han GM, Rani M.
Microplastic as an emerging contaminant in marine
environment. 한국환경독성학회 2014
춘계국제학술대회초록집. 2014;288–303.
26) Song YK, Shim WJ, Jang M, Hong SH, Han GM. A Nile Red Staining Method for Microplastic Identification and Quantification. 제 52 회 한국분석과학회
춘계학술대회. 2014;143–143.
27) Andrady AL. Measurement and Occurrence of Microplastics in the Environment. In: Presentation at the 2nd Research Workshop on Microplastic Debris Tacoma, WA. 2010.
28)Shim WJ, Song YK, Hong SH, Jang M. Identification and quantification of microplastics using Nile Red statining. 2016. Marine Pollution Bulletin.
29) Greenspan P, Mayer EP, Fowler SD. Nile Red: A Selective Fluorescent Stain for Intracellular Lipid Droplets. The Journal of Cell Biology. 1985 Mar 1;100:965-73.
30)Greenspan P, Fowler SD. Spectrofluorometric studies of the lipid probe, Nile Red. Journal of Lipid Research. 1985;26:781-89.
31) R Core Team. R: A language and environment for statistical computing. Version R-portable 2.11.1 [software]. 2016 [cited 2016 Sep 10]. Available from: https://www.R-project.org/.
32)Brenning, A. Statistical geocomputing combining R and SAGA: The example of landslide susceptibility analysis with generalized additive models. In: Boehner J, Blaschke T and Montanarella L, editors. SAGA - Seconds Out (= Hamburger Beitraege zur Physischen Geographie und Landschaftsoekologie). 2008;19:23-32.
33)Conrad O, Bechtel B, Dietrich H, Fischer E, Gerlitz L, Wehberg J, et al. System for Automated Geoscientific Analyses (SAGA) v. 2.1.4. Geoscientific Model Development. 2015 Jul;8(7): 1991-2007.