Published online December 10, 2013 (http://www.sciencepublishinggroup.com/j/ajtas) doi: 10.11648/j.ajtas.20130206.21
Comparison of statistical methods for outlier detection in
proficiency testing data on analysis of lead in aqueous
solution
Sushree SwarupaTripathy
*, Rajiv Kumar Saxena, Prabhat Kumar Gupta
Analytical Chemistry, Sophisticated Analytical Support Division, CSIR- National Physical Laboratory, Dr K. S. Krishnan Marg, New Delhi-110012, INDIA
Email address:
[email protected] (S. S. Tripathy)
To cite this article:
Sushree SwarupaTripathy, Rajiv Kumar Saxena, Prabhat Kumar Gupta. Comparison of Statistical Methods for Outlier Detection in Proficiency Testing Data on Analysis of Lead in Aqueous Solution. American Journal of Theoretical and Applied Statistics. Vol. 2, No. 6, 2013, pp. 233-242. doi: 10.11648/j.ajtas.20130206.21
Abstract:
Proficiency testing is the regular testing of the performance of individual laboratories by an external agency. Stable and effectively homogeneous elemental solutions of different concentrations ranging were prepared at NPL and were certified by round robin test. These certified reference materials (CRMs) along with reports containing all information, where the laboratories were identified only by a reference number were being distributed to sixty seven participant laboratories. In this paper the data of lead (Pb) elemental solution of 1-5 mg/l is only presented for outlier detection. The results received from the sixty four numbers of laboratories for Pb elemental solution statistically evaluated with different approaches viz. Cochran’s test, Grubb’s test, Hampel’s test, classical z-score, median and NIQR method, robust statistical analysis : Algorithm A (ISO 13528) and NATA method. The robust estimate of average and uncertainty values derived from ISO 13528 method are very close to the reference value for the 1 and 2 mg/l of Pb elemental solutions. The performance of the laboratories was expressed by z-score and the laboratories having z< 2 are classified as satisfactory, 2 < z < 3 are classified as questionable and z> 3 are considered as unsatisfactory. Among all the methods, the highest number of outlier i.e. about 30 % obtained by NATA statistical analysis. As NATA method considers variance in both within and between laboratory results so it seems to be the most suitable method for outlier detection for the present data set evaluated in this study.Keyword:
Proficiency Testing, Statistical Analysis, Z-Score, Outlier1. Introduction
Growth in world trade has shown the ways to remove the technical barrier so that the goods can cross the frontiers without delay and added cost. The importing economy needs to ensure the quality of the product being imported as per their requirement. It should have full confidence in the technical competence of the exporter or their testing laboratory. The quality assurance and quality control of the product could be achieved by implementation of ISO/IEC 17025 [1] and use of certified reference materials in calibration of analytical equipment and validation of test methods is mandatory. Third party accreditation and participation in proficiency testing (PT) program enhance global acceptance of test reports.
According to ISO/IEC 17025, participation in
analysis, instructions and format of the test report. Each participating laboratory carried out analysis of the characteristics of the test material and reports the results on given format within fixed deadline. The data of the participants has to be compiled and statistically computed to calculate the values to assess the quality of the performance of the laboratories and to provide a score to the participant laboratories.
Certified reference materials of Pb, Cr, Zn mono elemental solutions of different concentration have been distributed to 67 NABL accreditated laboratories for measurement of metal in water under the PT program carried out by the NPL-I. In this paperdetailed of statistical analysis and description of the PT programme has been presented for Pb elemental solution of different concentrations ranging from 1-5 mg/l. Results obtained were evaluated by different statistical approaches viz. Cochran’s test, Grubb’s test, Hampel’s test, classical z-score, Median and NIQR method, robust statistical method and NATA method to establish the best method to present the performance of the participant along with the outlier detection. When the number of data is more and there is a great difference between the laboratories results, in that case the detection of outlier is a tough job. Thus, in the present paper emphasis has been given to establish a suitable method to find out the outlier in such a way that the extreme values provided by some PT participants would not influence the results of the participants close to the reference value.
Z-score is the performance score of one laboratory with the other laboratories. The quality of the measurement increases with the decrease in the z-score value. In this study the laboratories having z-score value between ± 2 to
± 3 are considered as questionable are advised to take close look at their results to rectify the fault. The cut off value of z-score evaluated by any method is selected as outside the range of ± 3 which indicates there is a problem with the measurement.
2. Statistical Techniques
The statistical evaluation of the data obtained from the participants has been illustrated in this paper using both numerical technique such as Cochran’s, Grubb’s, Hampel’s statistic and graphical techniques such as classical z-score, Median & NIQR, ISO 13528: Algorithm A, NATA statistical method [4-6].
2.1. Cochran’s Test
According to ISO 5725-2, Cochran’s test is recommended for the detection of outliers in a given set of intra laboratory variability test. It is a one – sided outlier test as the criterion of the test examines only the greatest standard deviation and allows to eliminate the problematic result with the within laboratories reproducibility / repeatability.
Cochran’s statistic C is calculated using the following
formula
∑
=
=
pj j
SD
SD
C
1 2 2 max
(1)
where,
SDmax is the maximum standard deviation among the investigated laboratories
SDj is the standard deviation of data from the laboratory p is the number of participated laboratories
The calculated C value can be compared with the critical value for a given n value i.e. the number of results given by each laboratory.
2.2. Grubb’s Test
Grubb’s test detects the outlier in the inter laboratory variability test in a given set of result differing significantly from others. In the Grubb’s test the highest and smallest values in the set of results ( Xj where j=1,2,...p ) are
to be tested for outlier.
The value of parameter Gp can be calculated for the
largest value in the set is given as follows
SD
X
X
G
p=
p−
(2)where,
Gp is the Grubb’s statistics for highest value in the set of result
Xp is the highest value
X
is the mean value SD is the standard deviationGp value can compare with the critical value for the “p”
number of laboratories
X
and SD can be calculated as1
1
pj j
X
X
p
==
∑
(3)(
)
2 11
1
p j j
SD
X
X
p
==
−
−
∑
(4)Grubb’s statistics for the lowest value in the set of result can be calculated as follows
SD
X
X
G
ll
−
=
(5)2.3. Hampel’s Test
The Hampel’s test [6] can be performed as
(
i e)
i
x
M
r
=
−
(6)Me is the median of the data set ri is the deviation from the median value
xi is the ith data of the data set where i = 1 to p, number of
all results
The outlier value from the data set can be obtained by comparing the ri value from the condition given below
i e
i
M
r
r
≤
4
.
5
(7)Me ri is the median for deviation
2.4. Z-Score Analysis
The z-score is the score given to the participant as per their performance.
The classical z-score can be calculated as follows
SD
X
X
z
=
(
lab−
mean)
/
(8)where,
Xlab is the result of the individual laboratory
Xmean is the mean value of the analyte obtained by the
participants result
SD is the standard deviation of the data
To simplify the interpretation of the z-scores, the following agreements were made as
z
< 2 imply the result is satisfactory 2 <z
< 3 imply the result is questionablez
> 3 imply the result is unsatisfactoryThe robust z-score obtained by median & normalized inter quartile range (NIQR) method can be calculated as follows
NIQR median
lab
X
SD
X
z
=
(
−
)
/
(9)where,
Xlab is the result of the individual laboratory Xmedian is the median value of the analyte
SDNIQR is the normalized inter quartile range of the data set
The z-score is interpreted in the similar way as described above
2.5. ISO 13528: Robust Analysis Algorithm A
The robust statistics can be calculated according to ISO 13528: Robust analysis Algorithm A. The robust average (x*) and the standard deviation value (s*) of the results of the participants could achieve by an iterative calculation as
described in ISO 13528 and is not affected by the results far from the reference value. The flow chart of the algorithm is shown in schematic diagram 1.
There are p data from participants: x1, x2, …, xi, …, xp
Schematic diagram 1. Flow chart of robust analysis algorithm A.
The assigned value of the analyte is the robust average value and the standard uncertainty (uX) of the assigned value of the analyte can be estimated using the robust standard deviation as follows
p
s
uX
=
1
.
25
×
*/
(10)Using the assigned value and the robust standard deviation the outlier detection may be assessed according to the z-score value.
2.6. NATA Method
The process of the performance evaluation of the participating laboratories is illustrated by the z-score values of the results obtained in the PT program in accordance to the National Association of Testing Authorities, Australia (NATA) guidelines [4]. The values of standardized sum (
S
i) and standardized difference (D
i) between two results of laboratory “i” have been calculated using equations (11) and (12).(
i i)
/
2
i
A
B
S
=
+
(11)(
)
/ 2i i i
Whereas
A
i andB
i are the two measurement values of the laboratory ‘i’Using the values of
S
i andD
i the values of both the Z-scores i.e within the laboratory (Zwi) and Z-score between the laboratories (Zbi) can be calculated using equations (13) and (14).( )
( )
0.7413i i
i
S Median S
Zbi
IQR S
− =
× (13)
( )
( )
0.7413i i
i
D Median D
Zwi
IQR D
− =
× (14)
The interquartile range (IQR) is the difference between the lower and upper quartiles of data. The lower quartile (Q1) is the value below, which a quarter of results laid and the upper quartile (Q3) is the value above, which a quarter of results laid. The quartiles are calculated analogously to the median and IQR = Q3 - Q1. The term “Normalized IQR” is comparable to a standard deviation and equals to IQR x 0.7413. The factor 0.7413 comes from the standard normal distribution, which has a mean of zero and a standard deviation equal to one. The width of the interquartile range of such distribution is 1.34898 and 1/1.34898 = 0.7413. z-score values Zbi and Zwi of laboratory “i” are the robust z-score of its
S
i andD
ivalues. Finally each participating laboratory will be assigned with two z-score values on the basis of their results. Generally laboratories having the value of any z- score value outside the range ± 3 are considered to be the outlier laboratories by NATA.
3. Sample Details of PT
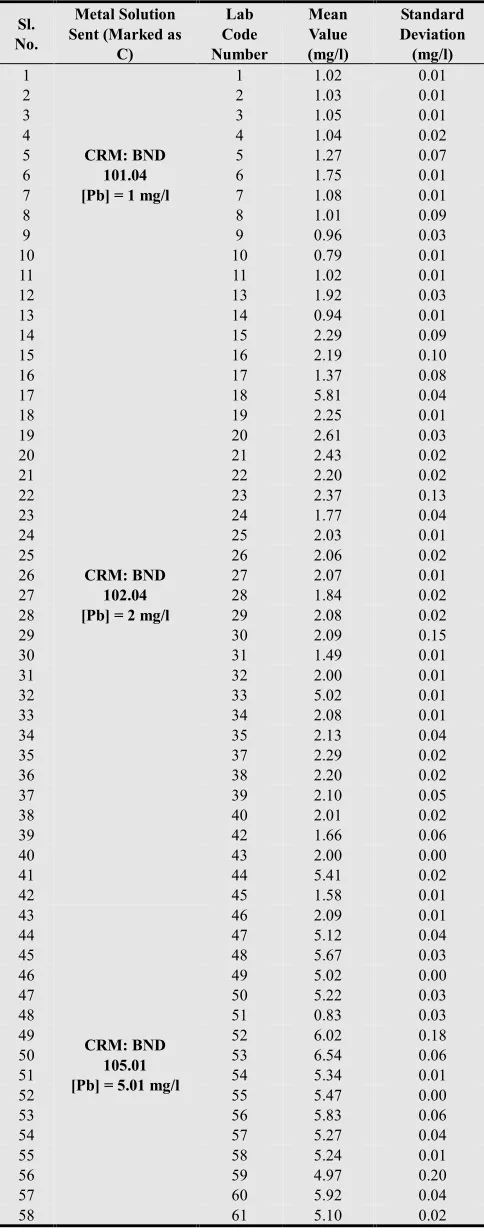
The solutions provided to the laboratories are the certified reference materials [named as Bharatiya Nirdeshak Dravyas (BNDs)] which had been certified with a reference value by round robin testing. Instruments like atomic absorption spectrometer (AAS), Inductively Coupled Plasma - Atomic emission spectrometer (ICP-AES) and Inductively Coupled Plasma -Mass spectrometer (ICP-MS) had been used for the analysis of these BNDs. Three numbers of elemental solutions (viz. Pb, Cr and Zn) of different concentration had been sent to 67 nos. of laboratories. In this paper only one metal i.e. Pb elemental solutions of 1 - 5 mg/l concentration is considered and evaluated the results of the participants with different statistical methods. Pb elemental solutions of 1, 2 and 5.01 mg/l were sent to 11, 34 and 22 numbers of laboratories respectively. Out of thirty four numbers of laboratories in case of 2 mg/l Pb solution, three numbers of laboratories did not acknowledge the receipt of the solution while other participants have been provided the results in triplicates. Details of the sample sent to various participating laboratories and results received from them are given in table 1. The participant laboratories have used different
analytical techniques such as AAS-Flame, AAS-Graphite Furnace, ICP-AES, ICP-MS, APHA-3111B method, APHA-3500D method and IS-3025 method to determine the concentration of Pb elemental solutions.
Table 1. Details of the sample recipient laboratories and their results
Sl. No.
Metal Solution Sent (Marked as
C)
Lab Code Number
Mean Value (mg/l)
Standard Deviation (mg/l)
1
CRM: BND 101.04 [Pb] = 1 mg/l
1 1.02 0.01
2 2 1.03 0.01
3 3 1.05 0.01
4 4 1.04 0.02
5 5 1.27 0.07
6 6 1.75 0.01
7 7 1.08 0.01
8 8 1.01 0.09
9 9 0.96 0.03
10 10 0.79 0.01
11 11 1.02 0.01
12
CRM: BND 102.04 [Pb] = 2 mg/l
13 1.92 0.03
13 14 0.94 0.01
14 15 2.29 0.09
15 16 2.19 0.10
16 17 1.37 0.08
17 18 5.81 0.04
18 19 2.25 0.01
19 20 2.61 0.03
20 21 2.43 0.02
21 22 2.20 0.02
22 23 2.37 0.13
23 24 1.77 0.04
24 25 2.03 0.01
25 26 2.06 0.02
26 27 2.07 0.01
27 28 1.84 0.02
28 29 2.08 0.02
29 30 2.09 0.15
30 31 1.49 0.01
31 32 2.00 0.01
32 33 5.02 0.01
33 34 2.08 0.01
34 35 2.13 0.04
35 37 2.29 0.02
36 38 2.20 0.02
37 39 2.10 0.05
38 40 2.01 0.02
39 42 1.66 0.06
40 43 2.00 0.00
41 44 5.41 0.02
42 45 1.58 0.01
43
CRM: BND 105.01 [Pb] = 5.01 mg/l
46 2.09 0.01
44 47 5.12 0.04
45 48 5.67 0.03
46 49 5.02 0.00
47 50 5.22 0.03
48 51 0.83 0.03
49 52 6.02 0.18
50 53 6.54 0.06
51 54 5.34 0.01
52 55 5.47 0.00
53 56 5.83 0.06
54 57 5.27 0.04
55 58 5.24 0.01
56 59 4.97 0.20
57 60 5.92 0.04
Sl. No.
Metal Solution Sent (Marked as
C) Lab Code Number Mean Value (mg/l) Standard Deviation (mg/l)
59 62 4.00 0.20
60 63 5.00 0.07
61 64 5.23 0.01
62 65 5.05 0.03
63 66 5.18 0.01
64 67 5.04 0.03
4. Result and Discussion of Statistical
Analysis of PB Elemental Solution
4.1. Numerical Statistical Analysis
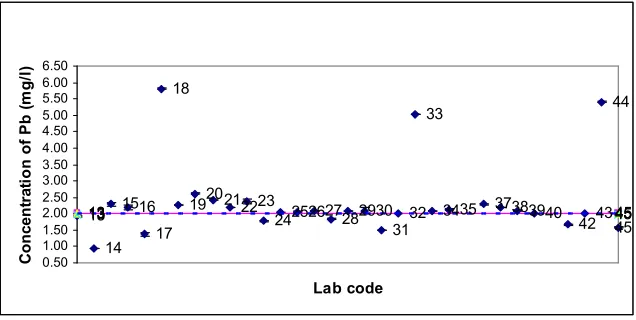
As in this PT program the CRMs of elemental solutions have been distributed to the participating laboratories, so the certified value of the CRMs are used as the reference value. To see the scattering of the data, the results of the participants with standard uncertainty are presented in Figure 1(a)-(c) with the CRM reference value. The central line represents the reference value and the dotted lines above and below the central line is the dispersion attributed to the reference value (given in Table 1) of the Pb elemental solution. The bar line shows the individual result of the participant with standard uncertainty. It can be seen from the figures that laboratory code 6; 18, 33, 44 and 46, 51 in
case of 1 mg/l, 2 mg/l and 5.01 mg/l of Pb solutions respectively are far from the reference value which give the impression as outliers. In case of 1 mg/l result, the bar line for lab code 5 & 6 are significantly high implies much variation in the replicates. In this paper emphasis has been given to find out the outliers so as to assess the participant performance but not to ascertain the assigned value. Hence the data received from the participating laboratories have been evaluated by both numerical and graphical method mentioned above and the assessment of the outcome of different methods applied to the results is presented in this section. The results obtained from the Cochran’s test were compared with the critical values of the Cochran’s table and found that the laboratory codes 5 & 8 in case of 1mg/l; 15, 16, 17, 23 & 30 in case of 2 mg/l and 52, 59 & 62 in case of 5.01 mg/l of Pb elemental solution measurement are classified as outliers. Cochran’s test considers only the within laboratories reproducibility/repeatability result so even though the laboratory results are quite far i.e. deviates 75 % from the reference value is not considered as outlier. Rather the result which deviates only 1 % from the reference value is found as outlier that can be reveals from the bar of the lab code 8 in figure 1(a). As Cochran’s test is the intra laboratory variability test, so this method is not reliable for the outlier detection.
Lab code 10 Lab code 1 Lab code 2 Lab code 3 Lab code 4 La b co
de 5 Lab code 6 Lab code 7 Lab code 8 Lab code 9 Lab code 11 0.77 0.85 0.92 1.00 1.07 1.15 1.22 1.30 1.37 1.45 1.52 1.60 1.67 1.75 C o n c e n tr a ti o n o f P b ( m g /l )
Figure 1(a). Reported result of the participant with lab code for Pb elemental solution 1 mg/l
13
14 1516
17 18
1920212223
24252627282930 31 32 33 3435 37383940 4243 44 45 13 45 13 45 13 45 0.50 1.00 1.50 2.00 2.50 3.00 3.50 4.00 4.50 5.00 5.50 6.00 6.50 Lab code C o n c e n tr a ti o n o f P b ( m g /l )
46 47
48 49 50
51 52
53
54 55 56
57 58 59
60
61
62
6364 65 666767
0.50 1.00 1.50 2.00 2.50 3.00 3.50 4.00 4.50 5.00 5.50 6.00 6.50
Lab code
Figure 1(c). Reported result of the participant with lab code for Pb elemental solution 5.01 mg/l
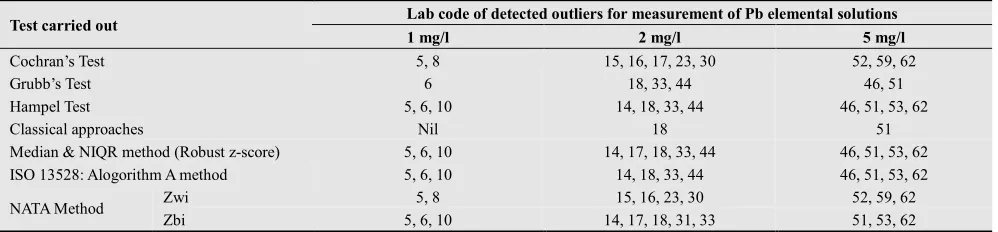
Table 2. Outliers detected by various statistical analysis
Test carried out Lab code of detected outliers for measurement of Pb elemental solutions
1 mg/l 2 mg/l 5 mg/l
Cochran’s Test 5, 8 15, 16, 17, 23, 30 52, 59, 62
Grubb’s Test 6 18, 33, 44 46, 51
Hampel Test 5, 6, 10 14, 18, 33, 44 46, 51, 53, 62
Classical approaches Nil 18 51
Median & NIQR method (Robust z-score) 5, 6, 10 14, 17, 18, 33, 44 46, 51, 53, 62
ISO 13528: Alogorithm A method 5, 6, 10 14, 18, 33, 44 46, 51, 53, 62
NATA Method Zwi 5, 8 15, 16, 23, 30 52, 59, 62
Zbi 5, 6, 10 14, 17, 18, 31, 33 51, 53, 62
Similarly, Grubb’s test is also not suitable method to find out outliers. This test was evaluated with considering two largest and two smallest values of the results and compared with the critical values of the Grubb’s table. There is one number, three numbers and two numbers of results in case of 1, 2 and 5.01 mg/l Pb elemental solution respectively were evaluated as outlier in Grubb’s test. In this test the highest deviation of the result of the laboratory code 6 is found to be 75 % above from the reference value for 1 mg/l Pb elemental solution where as the laboratories code 18, 33, 44, 46, 51 for other two concentrations are reported strange values which give an impression that these laboratories have been biased with the other laboratory. There is less number of laboratories found as outlier in Grubb’s test as compared to Cochran’s test. The laboratories detected as outliers by Cochran’s and Grubb’s test for all the concentrations of Pb elemental solutions are shown in the table 2.
Hampel’s test which is known as Huber test [7] was carried out following the condition i.e. the deviation value from the median with the median of deviation of the data set to find out outlier. Hampel’s test is more or less a robust test towards outlier detection as the median value of all the measurement is considered to find out outliers. The number of outlier detected by Hampel’s test is more as compared to Cochran and Grubb’s test in analysis of all the concentrations of Pb elemental solution. It was found that the result which is far from the reference value in the data set i.e. deviate at least 20 % were detected as outlier and
this method seems to be a good method for outlier detection. The outlier lab codes for all the concentrations of Pb are shown in table 2.
4.2. Graphical Statistical Analysis
PT results were arranged in an increasing order and the absolute deviation from the median was calculated. Then by iteration i.e. updating the robust average (x*) and robust standard deviation (s*) several times the process converges so that the value does not change from one iteration to the next iteration till the third digit. The robust average is considered as the assigned value and the uncertainty value was derived by putting the robust standard deviation in Eq. 10. The consensus/assigned value with the standard deviation/uncertainty value derived by different methods
along with the reference value are tabulated in Table 4. The z-score was calculated using the robust estimates. The laboratory result which deviates up to 30 % lower and higher from the reference value is not considered as outlier. The laboratories found as outlier by this method are similar with the laboratories found in case of Hampel’s test. It is observed from the evaluation of the data; this is the best method to derive assigned value when the reference value of the analyte distributed for PT is not known.
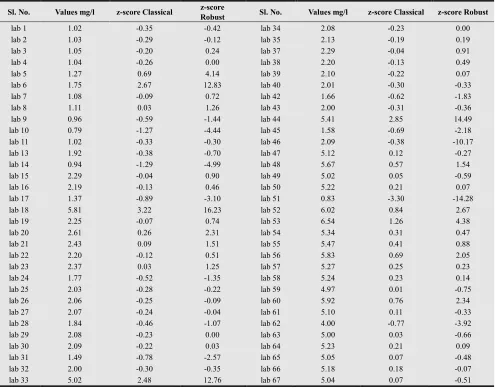
Table 3. z-score obtained by classical and robust method
Sl. No. Values mg/l z-score Classical z-score
Robust Sl. No. Values mg/l z-score Classical z-score Robust
lab 1 1.02 -0.35 -0.42 lab 34 2.08 -0.23 0.00
lab 2 1.03 -0.29 -0.12 lab 35 2.13 -0.19 0.19
lab 3 1.05 -0.20 0.24 lab 37 2.29 -0.04 0.91
lab 4 1.04 -0.26 0.00 lab 38 2.20 -0.13 0.49
lab 5 1.27 0.69 4.14 lab 39 2.10 -0.22 0.07
lab 6 1.75 2.67 12.83 lab 40 2.01 -0.30 -0.33
lab 7 1.08 -0.09 0.72 lab 42 1.66 -0.62 -1.83
lab 8 1.11 0.03 1.26 lab 43 2.00 -0.31 -0.36
lab 9 0.96 -0.59 -1.44 lab 44 5.41 2.85 14.49
lab 10 0.79 -1.27 -4.44 lab 45 1.58 -0.69 -2.18
lab 11 1.02 -0.33 -0.30 lab 46 2.09 -0.38 -10.17
lab 13 1.92 -0.38 -0.70 lab 47 5.12 0.12 -0.27
lab 14 0.94 -1.29 -4.99 lab 48 5.67 0.57 1.54
lab 15 2.29 -0.04 0.90 lab 49 5.02 0.05 -0.59
lab 16 2.19 -0.13 0.46 lab 50 5.22 0.21 0.07
lab 17 1.37 -0.89 -3.10 lab 51 0.83 -3.30 -14.28
lab 18 5.81 3.22 16.23 lab 52 6.02 0.84 2.67
lab 19 2.25 -0.07 0.74 lab 53 6.54 1.26 4.38
lab 20 2.61 0.26 2.31 lab 54 5.34 0.31 0.47
lab 21 2.43 0.09 1.51 lab 55 5.47 0.41 0.88
lab 22 2.20 -0.12 0.51 lab 56 5.83 0.69 2.05
lab 23 2.37 0.03 1.25 lab 57 5.27 0.25 0.23
lab 24 1.77 -0.52 -1.35 lab 58 5.24 0.23 0.14
lab 25 2.03 -0.28 -0.22 lab 59 4.97 0.01 -0.75
lab 26 2.06 -0.25 -0.09 lab 60 5.92 0.76 2.34
lab 27 2.07 -0.24 -0.04 lab 61 5.10 0.11 -0.33
lab 28 1.84 -0.46 -1.07 lab 62 4.00 -0.77 -3.92
lab 29 2.08 -0.23 0.00 lab 63 5.00 0.03 -0.66
lab 30 2.09 -0.22 0.03 lab 64 5.23 0.21 0.09
lab 31 1.49 -0.78 -2.57 lab 65 5.05 0.07 -0.48
lab 32 2.00 -0.30 -0.35 lab 66 5.18 0.18 -0.07
lab 33 5.02 2.48 12.76 lab 67 5.04 0.07 -0.51
Table 4. Comparison of reference value with the mean, median, robust assigned value obtained by various statistical methods
Reference value of Pb elemental solution (mg/l) at 95 % confidence level
Mean value Median value
Consessus value (after elimination of outlier obtained by Hampel’s test)
Assigned value (ISO 13528 method)
Mean value (mg/l)
Standard uncertainty
(mg/l)
Median value (mg/l)
NIQR (mg/l)
Consensus value (mg/l)
NIQR (mg/l) Assigned value (mg/l)
Standard uncertainty
(mg/l)
1.00 ± 0.01 1.10 0.07 1.04 0.06 1.03 0.02 1.05 0.03
2.00 ± 0.01 2.33 0.19 2.08 0.23 2.08 0.18 2.07 0.06
-7.00 -6.00 -5.00 -4.00 -3.00 -2.00 -1.00 0.00 1.00
8 5 9 4 1 7 11 2 3 6 10
Lab code
Z
w
i
Figure 2(a). z-score within laboratories (Zwi) obtained by NATA method
for Pb elemental solution 1 mg/l
-8.00 -4.00 0.00 4.00 8.00 12.00 16.00 20.00
10 9 8 1 11 2 4 3 7 5 6
Lab code
Z
b
i
Figure 2(b). z-score between laboratories (Zbi) obtained by NATA method
for Pb elemental solution 1 mg/l
-6.00 -5.00 -4.00 -3.00 -2.00 -1.00 0.00 1.00 2.00
3023 161517 4239 182435 2013 4426 29 4038 2821 22 37253431 4527 141932 3343
Lab code
Z
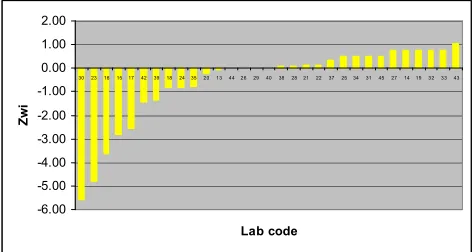
w
i
Figure 2(c). z-score within laboratories (Zwi) obtained by NATA method
for Pb elemental solution 2 mg/l
-10.00 -5.00 0.00 5.00 10.00 15.00 20.00
14 1731454224281343324025 262729 34303935163822191537 232120 334418
Lab code
Z
b
i
Figure 2(d). z-score between laboratories (Zbi) obtained by NATA method
for Pb elemental solution 2 mg/l
-6.00 -5.00 -4.00 -3.00 -2.00 -1.00 0.00 1.00 2.00
62 59 52 63 53 56 57 60 47 65 67 51 48 50 61 64 54 58 46 6649 55
Lab code
Z
w
i
Figure 2(e). z-score within laboratories (Zwi) obtained by NATA method
for Pb elemental solution 5.01 mg/l
-16.00 -12.00 -8.00 -4.00 0.00 4.00
514662 59 6349 67 6561 476650 64 58 57 54 5548 56 60 52 53
Lab code
Zb
i
Figure 2(f). z-score between laboratories (Zbi) obtained by NATA method
for Pb elemental solution 5.01 mg/l
Data received from the participating laboratories have been evaluated quantitatively for their quality of measurement using NATA method also. For this purpose the PT data was processed to calculate two types of z-scores such as z-score within the laboratory (Zwi) and between the laboratories (Zbi) by integration of the seven summary statistics - number of the laboratories, median, normalized interquartile range (IQR), robust coefficient of variation (CV), minimum, maximum and range [4]. A value of the z-scores within the laboratory indicates the variance in the data produced in the same laboratory and z-score between the laboratories indicates the variance in the data produced by different participating laboratories. The quality of the measurement increases with the decrease in the
the median value of all the participating laboratories [Figure 2(b), (d) and (f)]. Hence these laboratories having z-score outside the range ± 3 are an indication of a problem with their results and are considered to be outlier laboratories for the analysis of Pb solution. The laboratory with code no. 17 in case of Zwi and 20, 42, 45, 52, 60 in case of Zbi exceed the cut off value of the z-score i.e. outside the range of ± 2 and below ± 3; which are advised to have a look into their result. There are 19 numbers of laboratories found as outlier by this method considering both the within and between laboratory data variability.
4.3. Comparison of Statistical Methods Applied for Laboratories Performance
The overall result of the statistical evaluation of the analysis of all the concentrations of Pb elemental solutions is compared in figure 3 which gives a clear idea about the percent of outliers found by each statistical method. Except lab code 17, the other laboratories found as outlier in the Cochran’s test is totally matches with the outlier result of the within laboratory variance of NATA method. The percent of outlier in case of classical approach for calculation of z-score is very less i.e. 0, < 4 and < 5 % for 1, 2 and 5.01 mg/l Pb solution respectively and it seems to be not suitable method for outlier detection as the mean of the data set is biased by the extreme result of the participant. There is much similarities in the outlier result obtained by Hampel’s test, Median & NIQR method, ISO 13528 method and only the between laboratory variance of NATA method in which the median value was considered for the z-score calculation. The median value does not affected by the absurd result given by the participant. More or less 30 % of the results in all the concentrations of Pb solutions are found as outlier by NATA method.
5 mg/l 2 mg/l 1 mg/l 0
10 20 30 40
%
o
u
tl
ie
rs
Cochran Grubbs Hampel z-Classical z-Robust A logorithm A
NA TA
Methods
[Pb]
Figure 3. Comparison of statistical methods used for all the
concentrations of Pb elemental solutions
Usually when the reference value of the measurand is not known in that case elimination of the outlier is a crucial task to set the assigned value. In that case the consensus value can be set after elimination of the outlier obtained by Hampel’s test. The measurement results have been checked for the consensus value after eliminating the outliers obtained from Hampel’s test and found very close to the reference value for the 1 and 2 mg/l of Pb solutions. The
mean, median, assigned values of the data set are calculated as described above and presented in the table 4. For 1 and 2 g/l Pb solution; the median, consensus and assigned values are almost same as the reference value but the mean value is quite far from the reference value for the same concentrations of Pb solution. This reveals that the mean value might be biased by more number of absurd results in the data set. In case of 5.01 mg/l Pb solution, except the mean value, the set values obtained by other method are quite far from the reference value. The uncertainty value derived from ISO 13528: Algorithm A is very low for all the concentration of Pb solutions. From the comparison of the different statistical methods evaluated in this paper, it is revealed that NATA method is the most suitable method for the outlier detection for the present data set. However, it is difficult to predict a suitable statistical method for the determination of outlier as several factors depends on it such as structure of the data set, type of outliers, number of outliers in the dataset etc.
5. Conclusions
materials will be strongly recommended. The outcome of this proficiency testing clearly reveals that Pb elemental analysis of aqueous solution can be performed in many laboratories with high accuracy.
Acknowledgement
Authors are thankful to National Accreditation Board of Testing and Calibration Laboratories (NABL), India for providing financial support. Thanks are due to the Director, NPL for giving permission to publish this paper.
References
[1] ISO/IEC 17025, General Requirements for the Competence of Testing and Calibration Laboratories, International Standards Organization (ISO), Geneva, 1999.
[2] ISO/IEC 17043:2010(E) Conformity assessment-General requirements for proficiency testing. International Standards Organization, Geneva. First edition 2010-02-01.
[3] ILAC-G13: Guidelines for the requirements for the competence of proficiency testing schemes, 2000.
[4] New statistics for NATA’s Proficiency Testing Programs, National Association of Testing Authorities (NATA), Australia, 1996.
[5] ISO 13528:2005(E) Statistical methods for use in proficiency testing by interlaboratory comparisons, International Standards Organization, Geneva. First edition 2005-09-01.
[6] Nordtest project No. 1483-99; 2000:35 methedology of inter-comparison Tests and statistical analysis of test results. [7] Quality assurance and quality control in the analytical