Cartographic Tools for Mapping Dreams
Cristina M. Iosifescu Enescu
a,*, Lorenz Hurni
aa ETH Zurich, Institute of Cartography and Geoinformation, [email protected], [email protected]
* Corresponding author
Abstract: Creating maps for their dreams enable dreamers to better attend to them. However, mapping dreams is not an easy task due to the particularities of the dream space. Therefore, there is a need of specific cartographic tools for this purpose. This work illustrates the process of creating a Web platform for mapping dreams, functional requirements are stated, and different possible implementations are discussed. By means of a dream example, a dream map and other related visual elements are created, presented and explained. The theoretical framework is based on the Dream Cartography project and the specific diagrammatic visualization tools were developed in its frame.
Keywords: Dream Maps, Dream Cartography, Interactive Web Mapping Platform
1.
Introduction
Dreams are very personal experiences, which enrich our world. Visual elements such as maps can facilitate a better recalling of a dream, leading also to seeing it from another perspective, eventually understanding more. It has been argued (C. M. Iosifescu Enescu & Hurni, 2017), that dreamers themselves should create maps for their dreams, as they have at their disposal the most complete information. However, creating a dream map is not an easy task. We propose an interactive Web platform, where dreamers can log their dreams and are then provided with specific cartographic tools for creating dream maps.
2.
Background
The research area on dream cartography proposes a view on dreams, where the dream settings or the dream locations play a greater role than they used to in the traditional dream analysis. This is analogous to the spatial turn in humanities, whereas the focus does not shift from time to space (Warf & Arias, 2008), but form the social dimension to the spatial dimension.
Research on dreams has revealed that a great share of the dream elements originate in autobiographical memories, like in the use case presented in section 6; however, a dream rarely replays an awaken experience entirely with all its elements (Malinowski & Horton, 2014). The thought that the brain goes to a (place) memory library before starting to dream is inspiring. Yet in the dreams, there are some places, which are highlighted, such as the childhood home (C. M. Iosifescu Enescu, 2016) or other meaningful places, to which more memories lead. Moreover, it has been observed that dreams reflect waking-life concerns of people, which is the basis of the continuity theory of dreams (Hall & Nordby, 1972). Some activities (e.g. walking outside, talking with friends) are more probable to appear in dreams (Schredl & Hofmann, 2003), compared to other, cognitive ones
(e.g. reading, working on the computer). Whereas the dream cartography project relates more to the cognitive theory of dreams, studying the manifest content of dreams, the traditional preoccupation with dreams in the psychoanalysis of Freud, Jung or Lacan cannot be ignored. A connection point can be seen in the visual reformulation of a dream, performed by the dreamers themselves, or by collecting data about how the dream elements relate to the previous experiences of the dreamers (designating dream elements with their meaning, e.g., Zurich as a familiar place or Mr. Jones as a close friend, a caring person). This implies a kind of “interpretation” of the manifest dream content, leading to a better self-understanding. Moreover, this “abstraction” of real geographical places or person names is similar to using relative coordinates instead of absolute, and makes in the end dreams of different persons comparable to each other by the specific characteristics of the dream elements.
descriptions, because of the same reason that the dream cartography project turned to relative locations, centred on the experience of a person, instead of using (only) geographical locations. The relative description can suit everyone, not only a specific culture or place.
Sharing dreams on social media or on blog sites is a common practice nowadays, but there are no tools yet to visualize dream elements or to systematically assess meaningful statistics related to dream settings. However, visualization could help getting new insights on dreams. Dealing with the visualization and with the additional data needed for it, makes the dreamer be aware of dream elements, which could otherwise get lost. There are benefits of attending to dreams, such as increasing self-understanding, overcoming fears, enhancing creativity or problem-solving strategies (Garfield, 1995).
The target group of the present article comprises cartography scholars, who may be more aware of their surroundings then other people. Therefore, the space, the topography and the atmosphere of a place may play a greater role in their dreams. The results of the research project on dream cartography were implemented in a prototype Web application. In the following, the requirements of such a Web Platform are discussed.
3.
Requirements for the Web Platform for
Mapping Dreams
The workflow for dream cartography consists of data acquisition, data modelling, setting visualization, the visualization of other psychologically relevant dream aspects and the visualization of dream series (C. M. Iosifescu Enescu, Montangero, & Hurni, 2015, p. 227). Based on these topics, the requirements for the Web Platform for mapping dreams are:
a) upload and save dream reports and additional information related to dreams
b) create and adjust maps for the dream space, even if this space is mixed or distorted
c) visualize dream space, even if it has no geographical reference
d) visualize social interactions, emotions present in dreams, and goal-related behaviour
e) create diagrams for visualizing dream series. f) offer background information about dream research and cartography, or links to such information
Besides these technical requirements, for a fully functional Web platform there are also non-functional requirements, such as security, reliability or cost-effectiveness. These will not be specifically handled here. Point a) from the functional requirements includes a hidden challenge: How to know which additional elements are important to be saved beside the dream report? This requires the modelling of the dream data into clear aspects such as settings, emotions, or social interactions, so that specific questions may be formulated and eventually be answered by the dreamer about each of these aspects.
Yet the most challenging requirements refer to the visual elements mentioned in points b) to e). Dream space may show particularities, which make the representation on standard geographical maps (point b) difficult. For the representation of mixed geographical spaces, different methods were pondered, such as location morphing, puzzle, map collage, superimposing of geographic places and cartograms. Morphing in this case could be used to seamlessly join different regions forming the dream space. Cartograms, deforming the geographic space according to whether locations are mentioned in a dream or not, could be used to stress the importance of some locations over others. Moreover, the uncertainty visualization proposed by Reuschel und Hurni (2011) may be used or further adapted for dreams. The authors use, for example, a centred point symbol with fading radial lines extending to the boundaries of the approximate region, where the dream setting could have been located. Another idea is to use customized symbols on the map. These could be sketches created automatically from photographs using, e.g. line jittering with open source software such as GIMP1 or Handy2. If a dreamed place is not brought in connection with any real place (point c), then the creation by the user of a map from scratch to fit the place description should be possible, using drawing tools. Even the absence of a proper map may be considered. However, in every case, alternative visualization methods such as diagrams or graphs may be created for describing the characteristics of dream space.
Point d) refers to the visualization of elements obtained from the modelling of dream data. Depending on the aspect, the representation may take different forms such as a graph-like-network or a timeline. Specific diagrams such as pie-charts or bars, which incorporate a multitude of aspects, can also be a solution.
For example, the time may be considered in multiple granularities: the time flow inside one dream (the storyline guide) and the timeline for a dream series (point e), which can be differentiated in real time and in time related to the number of recorded dreams. Moreover, metadata about time can be recorded and visualized: the story can play in a contracted, expanded or fluent way and it might take place in the present, past or future of the dreamer.
The social interactions in a dream are very important and they may be visualized in a valued directed graph, where the edges represent the value of an interaction (intensity and /or valence) and the nodes are the characters occurring in the dream. The nodes could also encode variables describing the characters (e.g. human / animal, familiar / not familiar).
An important element in dreams is the leading emotion. In the search for a visual representation of emotions, some options are to use for example emoticons, or to change the map style or theme depending on the emotions.
1 https://www.gimp.org/
The style of a Web map (colour, form, size or orientation of symbols, opacity, etc.) can be adapted for a specific requirement (I. Iosifescu Enescu, 2011). Figure 1 shows an example of predefined styles (e.g., in the middle, the “treasure map” style) applied from the user-interface with Styled Layer Descriptor (SLD) to a set of data provided (from the own geo-server) as a Web Map Service (WMS). The resulting maps contain the same amount of information, yet they convey a very different message regarding their purpose. Whereas high customization can be achieved nowadays applying e.g. Mapbox GL JS style specification3 on vector tiles, more common is the use of pre-rendered (pre-styled) raster tiles. This latter approach is faster from the point of view of the end-user, but it is limited to the available services. Examples are the well-known artistic “Watercolor” or “Toner” from Stamen4.
Figure 1 Predefined styles for GIS data visualization in a Web application (Probst, 2013)
Another idea for representing emotions is to use a frame for the map, similar to the way in which, for example, a painting can subtly change its perceived qualities by using a beautiful antique craved wooden frame instead of a modern, simplistic one. Different frames can be designed for basic emotions. Both colour and form of the frame can be used to convey the leading emotion. A source of inspiration can be the study of Pixar (2017) for their movie “Inside Out”, where emotions are personified by different characters living inside the head of a child. Although the dreamers are supposed to create visual elements partly themselves, a text analysis of the dream report is indispensable. In this respect, two methods can be used: asking the dreamers to analyse the dream text themselves or applying external tool for text analysis, such as the machine-learning tool indico.io5 or the text reading and analysis environment from Voyant Tools6. First, the dreamer should have the possibility to annotate the dream report, choosing words (or word sequences) and classifying these into specific categories: e.g., settings, characters, objects or emotions. These annotations can be used for creating a word cloud. Alternatively, an external tool specialized in visually analysing text corpus can be used for creating word clouds or other statistical visualization of the text. Figure 2 shows a word could for the text of the dream represented in section 6, generated with Voyant Tools.
3 https://docs.mapbox.com/mapbox-gl-js/style-spec/ 4 http://maps.stamen.com
5 https://indico.io/blog/docs/indico-api/text-analysis/ 6 https://voyant-tools.org/docs/#!/guide/about
Another important contribution of the dreamer is answering additional questions, such as the questionnaires for creating the event spider and the setting spider (C. M. Iosifescu Enescu, Bär, Beilstein, & Hurni, in press), which visualize metadata regarding the dream elements, respectively the dream setting.
Figure 2 Word cloud generated with Voyant Tools
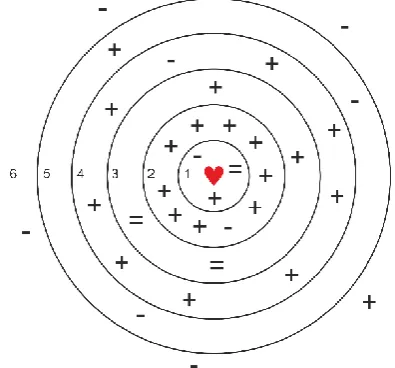
Representing dream series (point e) invokes again the different aspects of dreams, which may be quantitatively represented in charts and could offer a different insight in the dreams of a person. For example, the character occurrence for a dream series may be presented in a diagram-like manner, which allows an overview of most frequent character types together with the number of characters occurring in each dream, like in the ThemeRiver, proposed by Havre, Hetzler and Nowell (2000). Moreover, if possible, a trajectory of dream spaces on a map may be shown. A place cookie (defined in (C. M. Iosifescu Enescu et al., in press)) can reveal the distribution of dreams in a dream series based on the familiarity of a dream setting (from 1 very familiar to 6 not known). Figure 3 shows an example of a place cookie for a dream series, featuring also the emotional valence of the dream (positive +, negative – or neutral =).
Different (visual) analysis, e.g. on the place cookie, could be performed in different granularities: for a single dream, for a selection of dreams, for a whole dream series, or for a selection of dreams of different dreamers. Regarding the last functional requirement, point f), important information on dream research and dream cartography can be linked as publications or summarized on the platform.
4.
Initial Design of the User Interface
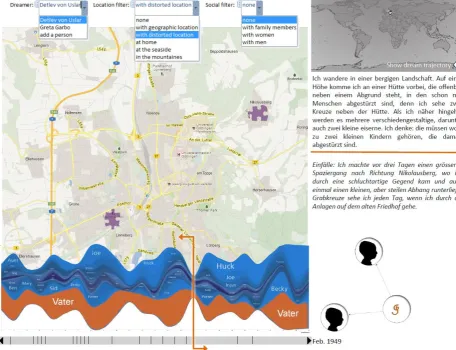
In order to create a Web platform for mapping dreams, the functionality was defined (see the previous section with the requirements), then a proof-of-concept design was build, followed by choosing the technologies and a first implementation in form of a functional prototype. Based on the requirements, a mock-up user interface was created at the beginning of this project (Figure 4). Some of the above listed possibilities were already included, but some came later and were only considered for the prototype phase.
The largest area is occupied by a geographical map, with two point symbols on it referring to the geographical locations occurring in the dream. The point symbols are in form of puzzle pieces that fit together, to reflect the fact that, in the represented dream, the two geographic places were actually combined into one place. Additional elements are the filters at the top, allowing to choose a
dream from an open dream database, filtering on the dreamer, on the type of the landscape or on types of characters occurring in the dream. To the top right, a small overview map is placed. The dream report and a text with remembered information related to the dream are represented on the right. An orange line in the dream text gives the impression that it may be moved into the dream report and the thought was to represent the places and the social interactions depending on the dream sequence recognized from the text. At the bottom right, a network-graph represents the characters and the social interactions. At the bottom, a big ThemeRiver flow represents the quantitative occurrence of characters in the dream series and under it, a grey line represents the real time with the black lines on it meaning the recorded dreams. This could be navigated with the small black arrows at the ends of the grey line or with the orange line, which also shows the position of the current displayed dream.
5.
A Functional Prototype
The prototype phase of the project consists in the implementation of the most important requirements into a functional Web platform.
The first requirement for the Web Platform for mapping dreams is to be able to upload and save dream reports and additional information related to dreams. This is achieved using a PostgreSQL Database on the server side and connecting the HTML and JavaScript form to it with Java servlets and JDBC through an Apache Tomcat Web Server.
Moreover, user registration is introduced, for being able to later edit dream elements, or to create a dream series, but also due to privacy concerns (the non-functional requirement of security was mentioned earlier). The authentication is implemented in Java on the server side using the Blowfish password hashing algorithm (Provos & Mazieres, 1999); the client’s browser communicates with the server over a secure https connection. Users have therefore the possibility to manage their account, to add or delete dreams, or to edit a previously created dream map.
Regarding the text analysis, first, users can use an annotation tool implemented on the platform for classifying words or word sequences from the dream report into four categories: settings, characters, objects and emotions. Second, the machine-learning tool indico.io is used for determining the input language of the dream text. If the dream report is written in English (the analysing tool is only available for English), then the text is analysed on place names, person names, emotions and general theme. The emotions are used to suggest a frame in the map application.
The dream setting map is conceived as a do-it-yourself map. The map contains three to four HTML canvas layers, situated on top of each other, which can be reordered by the user. These are one or two geographical map canvases, a frame canvas and a free drawing canvas. The map canvases are powered by the OpenLayers7 library. The advantage of using two map canvases is that it is possible to have different zoom levels, centres and rotations for each canvas, which is useful for creating map collages. The platform allows also to drag-and-drop external vector files containing geographical data (KML, JSON, GPX or IGC) onto the map, if needed.
The frame canvas contains frames such as picture frames, special form frames or meaningful coloured frames. The main role of these frames is, beyond the nice finish effect, to convey the emotion of the dream. Different frames were designed, using different colours and forms, for the following basic emotions: sadness, fear, joy, disgust, anger and excitement, based on a Pixar study mentioned in section 3.
In the following lines, the implemented graphical tools, the implemented analytical tools and the graphical elements available for the prototype of the Web mapping platform are listed.
7 https://openlayers.org/
Implemented graphical tools related to map creation Draw on map (georeferenced)
Draw on canvas (not georeferenced) Add own vector geodata
Add own thumbnails
Cut and combine maps (produce map collages) Select frame
Manage layers and canvases Implemented analysing tools
Text annotation (user-performed)
Text analysing with machine learning (external service)
Geocoding (external service) Questionnaires for detailed profiles Manage dreams in a dream series List of representation types on the dream platform
Dream map (Do-It-Yourself) Word cloud
Event Spider Profile Setting Spider Profile
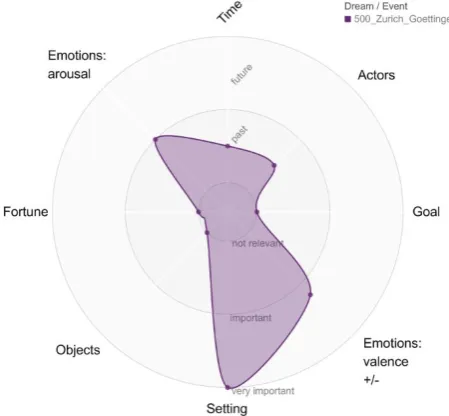
The event spider (Figure 5) is a visual method for summarizing a dream based on the importance of four factor-pairs occurring in dreams: characters and objects, time and setting, emotion valence and intensity, goal pursuing and fortune. The setting spider (Figure 6) details the factor setting from previously mentioned event spider and is automatically constructed after answering 26 questions. These define the setting in terms of its relation to geospace and the role of space, society and morphology, individual and general exposure, attention and environment. The two spider profiles offer an overview of important dream characteristics and make the comparison or aggregation of dreams form a dream series possible.
Figure 6 Setting Spider Profile of the selected dream, generated on the Web platform for mapping dreams
The dreamers are also asked to state the place where they were at the time of the dream, and the given place is geocoded using the Geonames database on cities (points) and Nominatim Openlayers (points, lines and areas); in the end, the users perform the disambiguation themselves, choosing from the suggested places. The geocoded place may be selected to appear on the map or not.
Not all ideas listed in the previous section(s) are implemented in the current Web platform for mapping dreams, as it is the case usually for a prototype. However, the existence of a Web platform for mapping dreams was successfully tested. In the following, it is illustrated by way of an example dream, respectively by the creation of
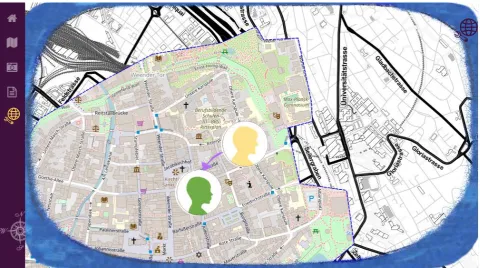
its map (Figure 7), which innovative features there were integrated into our Web platform
6.
Application Example: Use Case
The dream to be mapped (see the word cloud of its dream report in German in Figure 2) takes place in Zurich, Switzerland, but a part of the dream city is actually Goettingen, Germany. The dreamer (von Uslar, 2003) lived at the point of the dream in Zurich and at an earlier time point in Goettingen. The general dream tone is rather sad, and the dreamer talked to one other person in the dream. This dream has a geolocation; however, this is a mix between two real places. Moreover, the dream has an emotion, characters and social interactions. All these dream elements have to be represented on the dream map. The dream report is uploaded into the platform like in a dream diary. The text of the dream is automatically analysed using the external machine-learning tool (indico.io, see section 3), which recognizes the leading emotion and the place names. The system suggests for this dream a rounded blue frame for the map, which stays for sadness. In addition, the user has the possibility to annotate the dream text and to create a word cloud. Place names in the dream text are geocoded; in the end, the user performs the disambiguation herself, choosing from the suggested places (e.g. Zurich, Switzerland and not Zurich, Kansas, USA).
After the text processing, the user is presented with a map stub. On this map, the places chosen in the previous step, Zurich Switzerland and Goettingen Germany, are marked.
Setting the map canvas active, the user drags from the initial list with available layers the desired layers to compose her map: the WMS layers Stamen Toner and Openstreetmaps. The locally defined vector layers
“geojsonplaces” (contains the markers for the two cities) and “playground” (for user-defined features) are already added to the map. Using the map features tools, the user draws a new feature on the map: an area containing the city center of Goettingen; then she clips this area out of the Openstreetmaps WMS layer. Adding a new map canvas from the map layers tool, the user moves the newly resulted layer to the new map canvas. Now she zooms the first map canvas to Zurich and, making the second map canvas active, she then pans the clipped city-centre of Goettingen so that it covers a part of Zurich on the first map canvas.
Setting the free drawing canvas active, the user drags and drops two images as thumbnails on the map: two profile pictures from her local computer, representing the characters present in the dream. On this canvas, it is possible to draw like in a paintbrush program, choosing different colours or brush size and types, in order to personalize the dream map as desired. In this case, the user draws an arrow between the two profiles, representing the one-way social interaction. With this, all relevant dream elements are visualized on the map (see Figure 7): it is a sad dream, with a one-way social interaction between two persons, taking place at a geographically mixed location. The textual and visual elements are saved into the database on the server. Each dream can be visualized or edited later, and all dreams uploaded by the same user are saved into a dream series. As additional visualization diagrams, the user chooses to create the dream spider (Figure 5) and the setting spider (Figure 6), by answering the two specific questionnaires about the dream, respectively dream setting.
In this section it was illustrated that the prototype of the Web platform for mapping dreams presents already many of the desired functionalities.
7.
Conclusions and Outlook
Proposing a tool for mapping dreams encourages the registration of its geographical aspects. The cartographic tools for mapping dreams could be used also for mapping narratives. Both mapping dreams and mapping narratives present the challenge of mapping fictional worlds. However, a dream is an experience lived by the dreamer, and the dream report is much shorter then a piece of narrative. The latter one is more elaborated and might include more elements to be used for mapping. However, usually a literary expert performs the mapping and has only access to the narrative itself and to external sources of information related to it. On the other side, for a dream, the most interested client is the dreamer herself, and the dreamer might be willing to answer questions related to the dream, preferably shortly after the dream experience. Through specific questions, e.g. the dream setting can be well described by the setting spider. The dreamer is the incontestable authority on the subject, which is different for narratives, if not the authors themselves are performing the mapping. Reflection on dream elements and introspection are methods applied by the dreamer in order to understand a dream and mapping
one’s dreams foster these by offering tools for visualization and organization.
Recalling the discussion in the beginning, which states that relative descriptions of places are better suited for dream places, it could be nevertheless interesting to relate a dream to a geolocation. This may be possible in the Web platform for mapping dreams. For example, all dreams of everyone who ever dreamed of the Tour Eiffel in Paris, France could be listed and statistics could be displayed on who these people are and what was their real-life experience in this location.
With the help of such a Web platform for mapping dreams, beyond mapping dreams, it may be revealed, for dream a series, which are the most meaningful places, to which the memories and dreams of a person lead, and what emotions are usually experienced in the dreams that take place in these locations.
8.
References
Garfield, P. (1995). Creative Dreaming: Plan And Control Your Dreams To Develop Creativity Overcome Fears Solve Proble. Simon and Schuster.
Griffith, R. M., Miyagi, O., & Tago, A. (1958). The universality of typical dreams: Japanese vs. Americans. American Anthropologist, 60(6), 1173–1179.
Hall, C. S., & Nordby, V. J. (1972). The individual and
his dreams. New York: New American Library.
Havre, S., Hetzler, B., & Nowell, L. (2000). ThemeRiver: Visualizing theme changes over time. Information Visualization, 2000. InfoVis 2000. IEEE Symposium On, 115–123.
Iosifescu Enescu, C. M. (2016). Impact of Migration on the Dream Setting (Master’s thesis for the degree of Master of Science in Psychology UZH). University of Zurich, Zurich, Switzerland.
Iosifescu Enescu, C. M., Bär, H. R., Beilstein, M., & Hurni, L. (in press). Place Cookies and Setting Spiders in Dream Cartography. Transactions in GIS.
Iosifescu Enescu, C. M., & Hurni, L. (2017). Fictional volunteered geographic information in Dream Cartography. International Journal of Cartography, 3(1), 76–87. https://doi.org/10.1080/23729333.2017.1301627 Iosifescu Enescu, C. M., Montangero, J., & Hurni, L. (2015). Toward Dream Cartography: Mapping Dream Space and Content. Cartographica, (50.4), 224–237. Iosifescu Enescu, I. (2011). Cartographic Web Services (Dissertation for the degree of Doctor of Sciences). ETH Zurich.
Malinowski, J. E., & Horton, C. L. (2014). Memory sources of dreams: the incorporation of autobiographical rather than episodic experiences. Journal of Sleep Research, 23(4), 441–447.
Nielsen, T. A., Zadra, A. L., Simard, V., Saucier, S., Stenstrom, P., Smith, C., & Kuiken, D. (2003). The typical dreams of Canadian university students. Dreaming, 13(4), 211–235.
Academy website: https://www.khanacademy.org/partner-content/pixar Probst, T. (2013). Benutzerdefinierte Symbolisierung von
OpenStreetMap-Daten mit QGIS-Server
[Interdisciplinary Project]. Retrieved from ETH Zurich, Institute of Cartography and Geoinformation website: http://www.ika.ethz.ch/studium/masterprojektarbeit/2013 _probst_bericht.pdf
Provos, N., & Mazieres, D. (1999). A Future-Adaptable Password Scheme. USENIX Annual Technical
Conference, FREENIX Track, 81–91.
Reuschel, A.-K., & Hurni, L. (2011). Mapping Literature: Visualisation of Spatial Uncertainty in Fiction. The Cartographic Journal, 48(4), 293–308.
Schredl, M., Ciric, P., Götz, S., & Wittmann, L. (2004). Typical dreams: stability and gender differences. The Journal of Psychology, 138(6), 485–494.
Schredl, M., & Hofmann, F. (2003). Continuity between waking activities and dream activities. Consciousness and Cognition, 12(2), 298–308.
von Uslar, D. (2003). Tagebuch des Unbewussten :
Abenteuer im Reich der Träume. Würzburg:
Königshausen & Neumann.