Development and validation of a
socioculturally competent trust in
physician scale for a developing
country setting
Vijayaprasad Gopichandran,1Edwin Wouters,2,3Satish Kumar Chetlapalli1
To cite:Gopichandran V, Wouters E, Chetlapalli SK. Development and validation of a socioculturally competent trust in physician scale for a developing country setting.BMJ Open 2015;5:e007305.
doi:10.1136/bmjopen-2014-007305
▸ Prepublication history for this paper is available online. To view these files please visit the journal online (http://dx.doi.org/10.1136/ bmjopen-2014-007305).
Received 26 November 2014 Revised 6 April 2015 Accepted 12 April 2015
1School of Public Health, SRM University, Kancheepuram, India 2Centre for Longitudinal & Life Course Studies, University of Antwerp, Antwerp, Belgium 3Centre for Health Systems Research & Development, University of the Free State, Bloemfontein, South Africa
Correspondence to Dr Vijayaprasad Gopichandran;
vijay.gopichandran@gmail. com
ABSTRACT
Trust in physicians is the unwritten covenant between the patient and the physician that the physician will do what is in the best interest of the patient. This forms the undercurrent of all healthcare relationships. Several scales exist for assessment of trust in physicians in developed healthcare settings, but to our knowledge none of these have been developed in a developing country context.
Objectives:To develop and validate a new trust in physician scale for a developing country setting. Methods:Dimensions of trust in physicians, which were identified in a previous qualitative study in the same setting, were used to develop a scale. This scale was administered among 616 adults selected from urban and rural areas of Tamil Nadu, south India, using a multistage sampling cross sectional survey method. The individual items were analysed using a classical test approach as well as item response theory. Cronbach’sαwas calculated and the item to total correlation of each item was assessed. After testing for unidimensionality and absence of local dependence, a 2 parameter logistic Semajima’s graded response model was fit and item characteristics assessed. Results:Competence, assurance of treatment, respect for the physician and loyalty to the physician were important dimensions of trust. A total of 31 items were developed using these dimensions. Of these, 22 were selected for final analysis. The Cronbach’sαwas 0.928. The item to total correlations were acceptable for all the 22 items. The item response analysis revealed good item characteristic curves and item information for all the items. Based on the item parameters and item information, a final 12 item scale was developed. The scale performs optimally in the low to moderate trust range.
Conclusions:The final 12 item trust in physician scale has a good construct validity and internal consistency.
INTRODUCTION
Healthcare is a dynamic social institution, and trust forms an integral part of human interactions with the healthcare system. Trust
in healthcare is all the more important given the state of vulnerability inherent in illness. Patient trust in the physician has been defined as a collection of expectations that patients have from their doctor.1 Certain other researchers have defined patient trust as a feeling of reassurance or confidence in the doctor.2Another interesting definition of trust, which is apt for the healthcare setting, is “an unwritten agreement between two or more parties for each party to perform a set of agreed upon activities without fear of change from any party.”3
Trust in physicians is of inherent value in healthcare. Ample research has demon-strated the positive association between trust and individual health outcomes; it is implicit and integral to healthcare relationships.4 Several studies have indicated that greater trust is associated with greater adherence to treatment and better self management of chronic illnesses such as diabetes.5–8 Patients who have greater trust in physicians show better follow-up and continuity of care.9 Strong patient-physician relationships of trust have been shown to be associated with
Strengths and limitations of this study
▪ This is the first study, to the best of our knowl-edge, to have developed and validated a scale to assess trust in physicians in a developing country context.
▪ The scale to assess trust has organically devel-oped from qualitative assessment of trust in the same region in India.
▪ This study has utilised the strengths of a clas-sical test as well as item response analyses for scale development and validation.
▪ This study has performed only construct, content validity and internal consistency. There is a need to further validate this scale for predict-ive validity.
on September 22, 2020 by guest. Protected by copyright.
greater self efficacy of patients.10 Trust in physicians is also associated with open disclosure even of sensitive information, which helps in care.5 A patient’s self-rated health status is also better when there is better trust.11 However, it has to be mentioned that while trust is asso-ciated with several of these outcomes, a strong causal inference cannot be made.
However, trust is a difficult construct to measure. To the best of our knowledge, scales that have been oped to measure trust have emerged from the devel-oped world. Six tools to measure trust in the healthcare setting have been described in a review by Goudge and Gilson. These are, Trust in Primary Care Physician Scale by Hallet al,12 Trust in Physician Scale by Anderson and Dedrick,1 Physician Trust Scale by Kao et al (1998), Medical Professions Trust Scale by Hall et al,12 Health Insurance Organization Trust Scale by Zhenget al13 and Whole Health System Trust Scale by Straten et al.14 Out of these six tools,five have been developed in the USA, and one tool by Straten et al in the Netherlands. They measure different aspects of trust. Three of these tools have been developed in Wake Forest University, North Carolina.15 Egede and Ellis developed a Multidimensional Trust in Health Care System Scale that simultaneously measures trust in physician, trust in insti-tutions and trust in insurer or payer. This 17 item scale has good psychometric properties and also correlated well with patient centred care, patient satisfaction, adher-ence to medication and social support.16 Dugan, Trachtenberg and Hall developed an abridged trust scale that simultaneously measures trust in physician, health insurer and the medical profession. It has five items in each subscale. The scale has good psychometric properties.17 Goold et al18 developed a scale to measure trust in the health insurer. This tool is a patient centred measure of trust in insurers. Administrative competence, clinical competence, advocacy, beneficence, fairness, honesty and openness, are some of the domains covered in this trust scale. A unique scale was developed to measure distrust in healthcare. This scale has 10 items: 4 measuring honesty, 2 measuring confidentiality, and the other 2 domains being fidelity and competence. This scale also has good psychometric properties.19 The Primary Care Assessment Survey (PCAS) by Safran et al is another tool covering seven important domains of healthcare. One of the domains covered is trust. It has a very high reliability of all the seven domains.6 Leisen and Hyman developed Patient Trust in their Physician Scale in 2001. It comprises of two overarching dimen-sions of trust, namely, technical competence and ben-evolence. Evaluating problems, providing appropriate and effective treatment, predisposing factors and struc-tural/staffing factors, are components of the compe-tence domain, and understanding the patient’s individual experiences, expressing caring, communicat-ing clearly and completely, buildcommunicat-ing partnership, demon-strating honesty and keeping information confidential, are components of the benevolence domain.20
The dimensions and determinants of trust in health-care in developing countries are likely to be very differ-ent. In many developing healthcare settings there is deprivation of resources, lack of universal health access, low public expenditure on healthcare, high out of pocket expenditure on health and poorly regulated private practice.21 Economic factors, uncertainties in access to health, emotional factors and implicit accept-ance of paternalism in clinical care are all likely to impact the social interactions in the healthcare setting, thus leading to different dimensions. A qualitative exploration of trust in healthcare undertaken from India showed that the important dimensions of trust are perceived competence, assurance of treatment, loyalty and respect.22 Of these, only competence is a dimension that has been identified before. The other three are cul-turally unique to developing country settings. A cross sectional community-based survey was carried out to val-idate the Trust in Physicians scale developed by Anderson and Diedrick1 in this local setting. The ques-tionnaire was translated to Tamil and back translated to English to ensure validity of translation. Thefindings of this survey are presented elsewhere.23 The exploratory factor analysis showed that the scale was unidimensional, and did not separate into the original three dimensional factor structure of the trust in physician questionnaire described by Anderson and Dedrick. Further, it was noticed that some of the components of the Anderson and Dedrick scale, such as doubts about the doctor’s competence and confidentiality, were not relevant to the local context where the questionnaire was administered. This study underscored the importance of a new scale for trust in physicians in this context.
Therefore, there is a need to assess trust in healthcare in these settings, with a culturally and socially appropri-ate scale developed and validappropri-ated in the context. This study was carried out to develop and validate a trust in physician scale relevant to the developing country context in India.
METHODS Study setting
All parts of the study were carried out in Tamil Nadu, a state in south India. India has a large public health system; the system runs through a decentralised state budget allocation. With the advent of the National Rural Health Mission, a flagship health system strengthening programme of the government of India, started in 2005, the public health system received a fillip in terms of decentralisation, better platforms for community engage-ment with healthcare, better accountability mechanisms and greater fund allocation.24 Alongside this strong public health system there is also a powerful private sector in healthcare. Private health providers, who deliver healthcare services for a fee, are the highest contributors to health services in India. There is a growing corporate healthcare industry in the metropolitan cities that
on September 22, 2020 by guest. Protected by copyright.
provides international quality health services to the people in the country and also serves as hubs for health tourism. In addition to the private and public health systems, there is a large network of unorganised,
unquali-fied medical practitioners providing all levels of health-care.25The overall health expenditure is about 4% of the gross domestic product (GDP) and the government budget allocation for healthcare is less than 1% of the GDP.26 The remaining health expenditure is largely out of pocket. This leads to significant impoverishment, and catastrophic health expenditure is one of the commonest reasons for indebtedness in the country.27 Tamil Nadu is one of the high performing states in India with respect to health indicators. It has one of the well-functioning models of healthcare in the country but still several pockets, especially poor rural areas and migrant urban populations, remain largely underserved.28 The ineffi -cient public health system, burgeoning private health-care, rising cost of healthhealth-care, and irrational and unregulated practices, make the study setting very differ-ent and unique from the other countries from where studies of trust in healthcare have previously emerged. Henceforth, we will refer to these health settings as devel-oping health systems.
Qualitative study to identify dimensions of trust in physicians
The qualitative study to explore the dimensions of trust in physicians has been described in detail elsewhere.22 In-depth interviews were conducted among vulnerable groups of people in various parts of the state of Tamil Nadu. A grounded theory approach was used to identify the emerging themes from these interviews. The main dimensions of trust that were identified were: perceived competence of the physician, assurance of treatment, confidence in the physician, respect given to the phys-ician and loyalty to the physphys-ician. While the first three were formative dimensions of trust, the latter two were reflective.
Development of items for the scale
Statements were generated to represent each of the dimensions of trust identified in the qualitative study. To capture the domain of perceived competence of the physicians’ statements such as appropriateness of medi-cines given, laboratory tests performed, quick relief, recommendations by friends and relatives, and lack of adverse effects of medicines, were included. Treatment assurance was represented in statements pertaining to assurance of treatment, irrespective of the time of day, ability to pay or the type of illness experienced. The statement “I feel that all of my illness will become all right when I go to this doctor”represented confidence. There were items representing loyalty, which included, going to the doctor for any illness, taking other treat-ments only after getting approval from the doctor, and referring all family and friends to only this doctor. There were also unique items that represented respect
for the physician. The questionnaire items were circu-lated to 10 people: 3 physicians, 2 public health profes-sionals and 5 lay persons, to get their opinion on the face validity of the questionnaire. These individuals were asked to rate each question on a scale of 1 to 5 on the extent to which they represent the dimensions of trust in physicians with score 1 being least representative and 5 being most representative. The items that scored least were removed from the final scale. The questionnaire was developed in English and translated to the local lan-guage, Tamil, by the researcher. An uninvolved person back translated the Tamil version of the questionnaire to English. This back translated version was checked for val-idity of the translation. Appropriate changes to the trans-lation were made to ensure validity of the transtrans-lation. There were a total of 31 items reflecting thefive dimen-sions of trust in physicians.
Sampling
The sample size of 600 was calculated according to the heuristics for sampling in multivariate modelling, which requires that there should be at least 20 observations per variable of analysis.29 Four districts werefirst selected by a simple random sampling method from the 32 districts of Tamil Nadu. Two of these districts are predominantly urban and two are predominantly rural. Three urban wards and eight rural blocks were selected from each district by a probability proportion to size method. From each selected block/ward, 50 adult men and women were interviewed if they reported having a regular primary care physician/facility to whom/where they went for their common minor illnesses.
Measurement
The study was conducted between June and October 2012. The selected participants were requested to answer the questions based on the primary care phys-ician whom they consulted for their minor ailments. For example, the interviewer would state “I get the confi -dence that all my illness will get alright when I go to the doctor” (domain—perceived competence), “The doctor gives appropriate medications for my diseases” (domain —perceived competence) reflecting attributes of trust. The respondents rated the statements on a five point Likert scale between “Strongly agree” to “Strongly dis-agree”. To reduce selection bias, the sample was selected using a multistage technique. Hospital based sampling was avoided. The researcher administered the question-naires along with two other trained investigators. Though the researcher is a physician by profession, this was not made explicit to the respondents during the interviews, in order to avoid reporting bias. Though the responses could have influenced the attitudes of the researcher, this is unlikely to have influenced the study, as the questionnaire administration process was standar-dised and there was very little scope for interpretation or reactions at the time of the interview. However, it is likely that the non-verbal communication signals
on September 22, 2020 by guest. Protected by copyright.
between the physician–researcher and the participants could have altered the responses. This needs to be kept in mind while interpreting the results of the study. By using a standardised questionnaire and standardisation of the questionnaire administration process, the chance of interviewer bias was controlled.
Psychometric analysis
There are two distinct theoretical frameworks for devel-opment and validation of psychometric instruments, namely, classical test theory and item response theory. In classical test theory, the analysis focuses on the total test score. The validation and scaling of a tool using classical test theory is highly sample dependent. The properties of difficulty or discrimination of the individual items are not constant across samples. Another major disadvan-tage of the classical test theory is that the total scores and thus the estimate of the true ability are also related to the choice of questions in the test. Therefore, the ability levels may not be comparable across different scales. The greatest advantage of using classical test theory is that the assumptions for the theoretical models are very lenient and easy to meet. In contrast, the Item response theory is based on strong assumptions that are difficult to meet. Therefore, fitting an item response model is a challenge in itself. But the IRT model is very useful because it looks at the probability of getting an expected response to a question at various levels of the ability under study. The parameters that are estimated
are sample invariant and, also, the ability that is esti-mated is a close measure of the true ability, independent of the questions used.30 This study has used the strengths of the classical test theory and item response theory. The data were managed using SPSS Statistics V.17.0.1, IBM SPSS Amos V.20 and Item Response Theory for Patient Reported Outcomes (IRTPRO) V.2.1.31–33 All the 31 items in the questionnaire relating to the dimensions of trust in the physician were assessed in this analysis. Classical test analysis of the items was carried out by performing an internal consistency test using Cronbach’s α, item-to-total correlation and inter-item correlations. Confirmatory factor analysis (CFA) was carried out to assess dimensionality of the 22 selected items from the total of 31. Standardised root mean squared residuals (SRMR) of less than 0.08, com-parative fit index (CFI) greater than 0.95, Tucker Lewis index (TLI) greater than 0.95 and root mean square error approximation (RMSEA) less than 0.06, were used for assessing fitness of the CFA model.34 Local depend-ence was checked by performing the bifactor LD-X2 values considering a value of greater than 10 to indicate local dependence.35 After confirming unidimensionality and local independence, Samejima’s Graded Response Model was fit for the selected 22 questions.36 Two types of models werefit, one parameter logistic (1PL) and two PL (2PL). The Akaike information criterion (AIC) and Bayesian information criterion (BIC), and −2log likeli-hood, were computed for the two models.37 The model
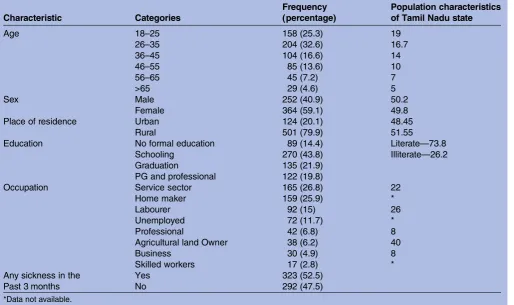
Table 1 Characteristics of the study participants
Characteristic Categories
Frequency (percentage)
Population characteristics of Tamil Nadu state
Age 18–25 158 (25.3) 19
26–35 204 (32.6) 16.7
36–45 104 (16.6) 14
46–55 85 (13.6) 10
56–65 45 (7.2) 7
>65 29 (4.6) 5
Sex Male 252 (40.9) 50.2
Female 364 (59.1) 49.8
Place of residence Urban 124 (20.1) 48.45
Rural 501 (79.9) 51.55
Education No formal education 89 (14.4) Literate—73.8
Schooling 270 (43.8) Illiterate—26.2
Graduation 135 (21.9)
PG and professional 122 (19.8)
Occupation Service sector 165 (26.8) 22
Home maker 159 (25.9) *
Labourer 92 (15) 26
Unemployed 72 (11.7) *
Professional 42 (6.8) 8
Agricultural land Owner 38 (6.2) 40
Business 30 (4.9) 8
Skilled workers 17 (2.8) *
Any sickness in the Past 3 months
Yes 323 (52.5)
No 292 (47.5)
*Data not available.
on September 22, 2020 by guest. Protected by copyright.
that showed lower values for the AIC, BIC and −2 log likelihood, was the appropriate one. Based on the model, the item parameters were calculated. The item
characteristic curves and item information functions were plotted. The level of overlap of the graded responses in the Likert scale, the extent of
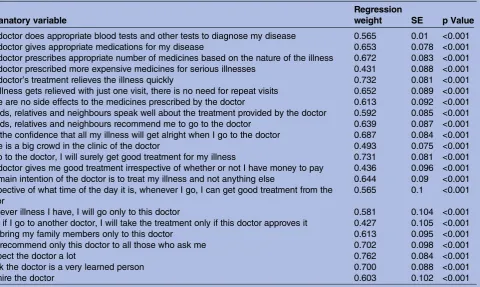
Table 3 Confirmatory factor analysis of the 22 items confirming a unidimensional structure
Explanatory variable
Regression
weight SE p Value
The doctor does appropriate blood tests and other tests to diagnose my disease 0.565 0.01 <0.001 The doctor gives appropriate medications for my disease 0.653 0.078 <0.001 The doctor prescribes appropriate number of medicines based on the nature of the illness 0.672 0.083 <0.001 The doctor prescribed more expensive medicines for serious illnesses 0.431 0.088 <0.001 The doctor’s treatment relieves the illness quickly 0.732 0.081 <0.001 The illness gets relieved with just one visit, there is no need for repeat visits 0.652 0.089 <0.001 There are no side effects to the medicines prescribed by the doctor 0.613 0.092 <0.001 Friends, relatives and neighbours speak well about the treatment provided by the doctor 0.592 0.085 <0.001 Friends, relatives and neighbours recommend me to go to the doctor 0.639 0.087 <0.001 I get the confidence that all my illness will get alright when I go to the doctor 0.687 0.084 <0.001
There is a big crowd in the clinic of the doctor 0.493 0.075 <0.001
If I go to the doctor, I will surely get good treatment for my illness 0.731 0.081 <0.001 The doctor gives me good treatment irrespective of whether or not I have money to pay 0.436 0.096 <0.001 The main intention of the doctor is to treat my illness and not anything else 0.644 0.09 <0.001 Irrespective of what time of the day it is, whenever I go, I can get good treatment from the
doctor
0.565 0.1 <0.001
Whatever illness I have, I will go only to this doctor 0.581 0.104 <0.001 Even if I go to another doctor, I will take the treatment only if this doctor approves it 0.427 0.105 <0.001
I will bring my family members only to this doctor 0.613 0.095 <0.001
I will recommend only this doctor to all those who ask me 0.702 0.098 <0.001
I respect the doctor a lot 0.762 0.084 <0.001
I think the doctor is a very learned person 0.700 0.088 <0.001
I admire the doctor 0.603 0.102 <0.001
Table 2 Classical test properties of the selected 22 items of the new trust in physician scale
Item
Item to total correlation
Cronbach’sα if item deleted
The doctor does appropriate blood tests and other tests to diagnose my disease 0.532 0.924
The doctor gives appropriate medications for my disease 0.619 0.923
The doctor prescribes appropriate number of medicines based on the nature of the illness 0.636 0.922 The doctor prescribes more expensive medicines for serious illnesses 0.406 0.927
The doctor’s treatment relieves the illness quickly 0.684 0.922
The illness gets relieved with just one visit, there is no need for repeat visits 0.617 0.923 There are no side effects to the medicines prescribed by the doctor 0.589 0.923 Friends, relatives and neighbours speak well about the treatment provided by the doctor 0.581 0.923 Friends, relatives and neighbours recommend me to go to the doctor 0.613 0.923 I get the confidence that all my illness will get alright when I go to the doctor 0.660 0.922
There is a big crowd in the clinic of the doctor 0.469 0.925
If I go to the doctor, I will surely get good treatment for my illness 0.675 0.922 The doctor gives me good treatment irrespective of whether or not I have money to pay 0.455 0.926 The main intention of the doctor is to treat my illness and not anything else 0.637 0.922 Irrespective of what time of the day it is, whenever I go, I can get good treatment from the
doctor
0.491 0.925
Whatever illness I have, I will go only to this doctor 0.591 0.923
Even if I go to another doctor, I will take the treatment only if this doctor approves it 0.457 0.927
I will bring my family members only to this doctor 0.620 0.923
I will recommend only this doctor to all those who ask me 0.695 0.921
I respect the doctor a lot 0.720 0.921
I think the doctor is a very learned person 0.662 0.922
I admire the doctor 0.605 0.923
on September 22, 2020 by guest. Protected by copyright.
T able 4 Bifa ctor Local Dependence Ma trix for the items in the ne w trus t in phy sician scale Domains repr esent ed by the items Marginal Item X 2 1 2 3 4 5 6 7 8 9 1 0 1 11 2 1 31 41 5 1 61 7 1 81 9 2 02 1 1 C ompete nce 1 1.5 2 C ompete nce 2 4.1 9 3 C ompete nce 3 3.9 8.9 17.1 4 C ompete nce 4 1 5.5 10.8 16.6 5 C ompete nce 5 8.4 6.1 4.1 5.6 6.4 6 C ompete nce 6 3.2 2.5 4.4 3.3 8.5 5.1 7 C ompete nce 7 2.2 8.5 4.2 8.6 8.6 7.7 5.8 8 C ompete nce 8 3.9 6.8 8.6 5.3 8.7 5.9 8.8 10.8 9 C ompete nce 9 5.7 5.9 5.5 4.9 12.7 2.9 6.6 13.5 20 10 C ompete nce 10 6.7 5.1 6.2 4.2 9 9.8 9.4 9.1 12.9 7.2 11 C ompete nce 11 3 10.5 6.7 7 5.8 8.9 4.1 8.8 3.6 8.4 7.9 12 T rea tment assur ance 1 10.5 3.9 6 3.2 12.5 4.1 4.8 8.2 7.4 7 10.7 6.9 13 T rea tment assur ance 2 1 8.1 8 6.7 7.4 10.6 8.7 9.4 7 9.7 9.2 8.3 8.3 14 T rea tment assur ance 3 8.3 5.2 6.1 7.8 10.2 7 12.5 6.9 8.7 6.9 9.6 7.4 9.5 15.3 15 T rea tment assur ance 4 2.6 5.7 4.9 6.5 10.6 9.9 9.1 18 8.1 13.2 10 14.4 10.8 12.4 14.1 16 Loy alty 1 4.8 8.8 9.9 11.6 8.4 7.6 11.3 8.7 15.5 15.9 10.9 10.3 8.6 8.5 6.6 20.3 17 Loy alty 2 2.1 7.2 10.7 11.8 14.1 5.7 10.2 13.1 11.3 9.6 7.1 12.8 11.5 8.7 14.1 13.3 15.4 18 Loy alty 3 5.1 5.8 9 6.6 16.4 9 4.1 8.4 10.2 10.8 11.2 12.6 10.7 7 6.8 16.4 12 11.4 19 Loy alty 4 10.8 6.7 6.7 7.8 10.6 10.1 7.8 8.5 11.1 10.4 14.3 11 9.1 16.5 14.3 15.3 15 18.1 14.2 20 R es pect 1 16.1 5.4 5.5 3.1 11.1 6.6 8.3 10.4 9.8 7.6 10.1 10 5.9 11.1 14.6 14.4 10.1 14.6 9 9.1 21 R es pect 2 7.7 3.7 6.5 4.6 5.9 3.7 6.2 9.6 4.6 2.8 7.5 5.4 7.1 10.5 10.8 13.2 8.9 14.6 9.7 11 10.7 22 R es pect 4 3.4 4.6 8.5 4.7 8.6 4.3 6.4 8.9 5.3 11.1 10.7 9.4 5.9 6.3 10.5 11 6.3 15.6 7.2 7 13.8 7.9
on September 22, 2020 by guest. Protected by copyright.
discrimination of each response and the item informa-tion values were used to select the appropriate quesinforma-tion- question-naire items. Test information function was also assessed.
Ethical considerations
The Institutional Ethics Group assessed the study proto-col and identified minimal ethical risks. They submitted the protocol to the Institutional Review Board and Ethics Committee of the School of Public Health, SRM University, registered under the Office for Human Research Protections (OHRP) of the USA Department of Health and Human Services (USHHS). The commit-tee reviewed the study protocol and approved the study. Since the ethical risks were minimal and since obtaining a written informed consent may deter participants from openly discussing some sensitive issues related to the physician–patient relationship, the committee approved that a verbal informed consent be obtained from all par-ticipants in the qualitative and in the quantitative com-ponents of the study.
RESULTS
Out of a total of 625 survey responses, 9 were incom-plete and hence were removed from analysis. The characteristics of the remaining 616 respondents are shown in table 1. The characteristics of the sample are compared with population characteristics of Tamil Nadu.38–40 It can be seen that compared to the Tamil Nadu population, the sample had a greater representa-tion of women, younger aged people and people with greater educational attainment.
Of the 31 items that were included in the question-naire, only 22 items had good item to total correlation (>0.4) good inter-item correlation (0.4–0.7).41 So these 22 items were further analysed. The Cronbach’sαof the 22 item scale was 0.928. The items, their item to total correlations and Cronbach’s α if respective items are removed from the scale, are shown intable 2.
A CFA model was constructed with a single latent vari-able, ‘trust in doctors’, and all the 22 questions as explanatory variables. The model fit indices revealed SRMR of 0.06, CFI of 0.958, TLI of 0.951 and RMSEA of 0.045 (90% CI 0.043 to 0.048), thus indicating an acceptable model fit for a unidimensional construct.
Table 3 shows the standardised regression weights and
SEs of each of the 22 items, and their contribution to trust in doctors.
LD-X2 bifactor statistics were computed and minimal local dependence was identified between three items measuring competence, two items measuring shared community opinions about the doctor and three items
Table 5 The model fit parameters of the 1PL and 2PL models in item response analysis
Model type AIC BIC −2 log likelihood
1 PL 27 578.96 27 972.63 −13 700.48 2 PL 27 327.17 27 813.72 −13 553.58 AIC, Akaike information criterion; BIC, Bayesian information criterion; PL, parameter logistic.
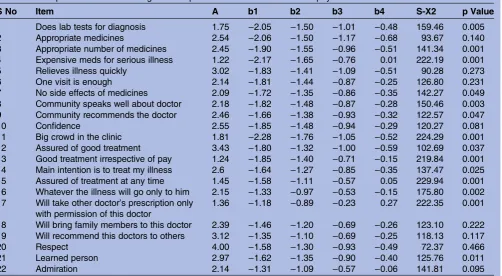
Table 6 Item parameters of the 2PL graded response model of the new trust in physician scale
S No Item A b1 b2 b3 b4 S-X2 p Value
1 Does lab tests for diagnosis 1.75 −2.05 −1.50 −1.01 −0.48 159.46 0.005
2 Appropriate medicines 2.54 −2.06 −1.50 −1.17 −0.68 93.67 0.140
3 Appropriate number of medicines 2.45 −1.90 −1.55 −0.96 −0.51 141.34 0.001 4 Expensive meds for serious illness 1.22 −2.17 −1.65 −0.76 0.01 222.19 0.001
5 Relieves illness quickly 3.02 −1.83 −1.41 −1.09 −0.51 90.28 0.273
6 One visit is enough 2.14 −1.81 −1.44 −0.87 −0.25 126.80 0.231
7 No side effects of medicines 2.09 −1.72 −1.35 −0.86 −0.35 142.27 0.049 8 Community speaks well about doctor 2.18 −1.82 −1.48 −0.87 −0.28 150.46 0.003 9 Community recommends the doctor 2.46 −1.66 −1.38 −0.93 −0.32 122.57 0.047
10 Confidence 2.55 −1.85 −1.48 −0.94 −0.29 120.27 0.081
11 Big crowd in the clinic 1.81 −2.28 −1.76 −1.05 −0.52 224.29 0.001
12 Assured of good treatment 3.43 −1.80 −1.32 −1.00 −0.59 102.69 0.037 13 Good treatment irrespective of pay 1.24 −1.85 −1.40 −0.71 −0.15 219.84 0.001 14 Main intention is to treat my illness 2.6 −1.64 −1.27 −0.85 −0.35 137.47 0.025 15 Assured of treatment at any time 1.45 −1.58 −1.11 −0.57 0.05 229.94 0.001 16 Whatever the illness will go only to him 2.15 −1.33 −0.97 −0.53 −0.15 175.80 0.002 17 Will take other doctor’s prescription only
with permission of this doctor
1.36 −1.18 −0.89 −0.23 0.27 222.35 0.001
18 Will bring family members to this doctor 2.39 −1.46 −1.20 −0.69 −0.26 123.10 0.222 19 Will recommend this doctors to others 3.12 −1.35 −1.10 −0.69 −0.25 118.13 0.117
20 Respect 4.00 −1.58 −1.30 −0.93 −0.49 72.37 0.466
21 Learned person 2.97 −1.62 −1.35 −0.90 −0.40 125.76 0.011
22 Admiration 2.14 −1.31 −1.09 −0.57 −0.06 141.81 0.095
a—discrimination parameter, b1, b2, b3, b4—difficulty parameter, S-X2Item level diagnostic statistic.
on September 22, 2020 by guest. Protected by copyright.
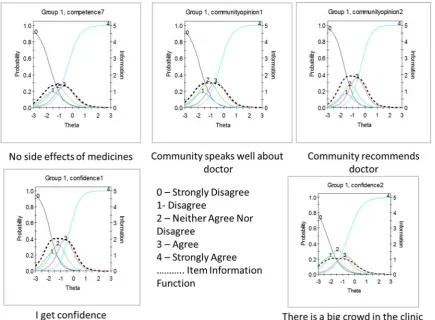
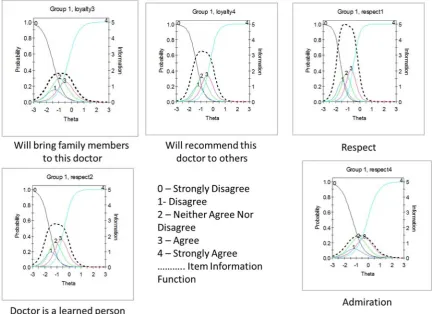
Figure 1 This figure shows the Item Characteristic Curves and Item Information Functions of items in the trust in physician scale.
Figure 2 This figure shows the Item Characteristic Curves and Item Information Functions of items in the trust in physician scale.
on September 22, 2020 by guest. Protected by copyright.
Figure 3 This figure shows the Item Characteristic Curves and Item Information Functions of items in the trust in physician scale.
Figure 4 This figure shows the Item Characteristic Curves and Item Information Functions of items in the trust in physician scale.
on September 22, 2020 by guest. Protected by copyright.
measuring assurance of treatment. But the LD X2 was not very high and hence no items were deleted from the model at this stage. The LD X2 matrix is shown in
table 4.
The AIC, BIC and −2 log likelihood ratios of the 1PL and 2PL models are shown in table 5. The Likelihood Ratio test value was 293.8 and for 21° of freedom the p value was <0.001.
This indicated that the 2PL model was appropriate for the data.Table 6shows the item parameters of all the 22 items.
It is clearly seen that most of the questions have a very high level of discrimination (a>1.70).42 The polytomous responses ranging from ‘strongly disagree’ to ‘strongly agree’ seem to perform optimally at increasing levels of the trust, ranging from−2.0 (low levels of trust) to +0.2 (moderate level of trust), without much overlap. Item level statistics of significance shows that‘appropriate med-icines’, ‘relieves illness quickly’, ‘one visit is enough’, ‘confidence’,‘will bring family members to the doctor’, ‘will recommend the doctor to others’, ‘respect’ and ‘admiration’, are statistically significant items ( p>0.05).
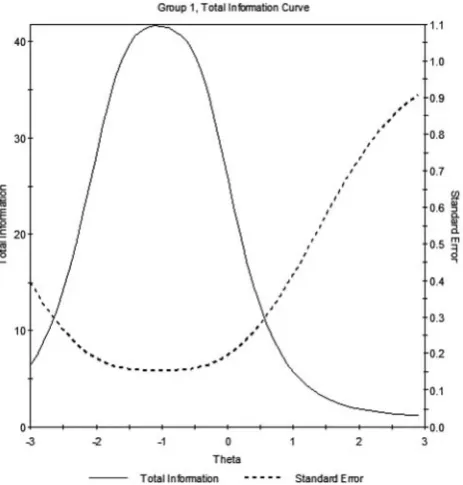
Item characteristic curves and item information curves for all the 22 items were examined. The item character-istic curves along with item information functions are shown infigures 1–4. Of the 22 items, three had a high level of overlap between the Likert responses and poor item information; these were,‘prescribes expensive med-icines for serious illness’, ‘assured of treatment at any time of the day’ and ‘will take treatment from other doctors only with the permission of this doctor’. The overall test information function is shown in figure 5.
The test information curve shows that maximum infor-mation is obtained at the trust (θ) levels of−1 to 0. The performance of the scale is poor at the higher trust (θ) levels of +1 and +2. It has a good range of performance between −2 and +1. The test can be reliable between these trust levels, but reliability reduces below and above this range. The test functions optimally at low to moder-ate trust levels.
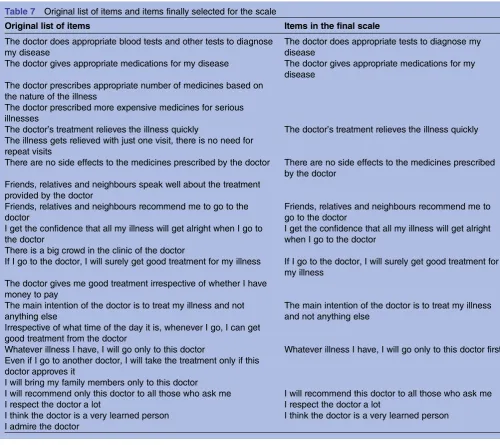
Based on the findings from the classical test theory approach, ‘prescribed more expensive medicines for serious illnesses’, ‘presence of big crowd in the clinic’, ‘good treatment irrespective of ability to pay’, ‘good treatment at any time of the day’and‘taking permission of the doctor to take prescription of other doctors’, were removed from the questionnaire as their item to total correlations were poor. Based on the item level para-meters and item lever S-X2statistic,‘one visit is enough for treatment’,‘will bring family members to this doctor’ and‘admiration’, were removed as they were not statistic-ally significant. The item characteristic curves and item information functions also reiterated the removal of the previously deleted items in the scale. The original list of items and thefinal list are compared intable 7.
DISCUSSION
This study has led to the development of a tool to measure trust in physicians in a resource poor setting in India. The tool has evolved organically from a qualitative exploration of the construct of trust in physicians. The qualitative exploration identified certain dimensions of trust that were unique to the regional cultural context in India, such as assurance of treatment irrespective of ability to pay, loyalty and respect. This study initially started with a pool of 31 questions to measure trust. After a series of classical and item response approaches, afinal 12-item trust in physician scale was developed.
Before discussing the psychometric properties of the new scale, it is important to understand the nature of some of the items in this scale. The scale is unique for the developing country context because it has items in a lan-guage uniquely articulated by the community in the same setting during a previous qualitative study. For example, the item“there are no side effects for the medicines pre-scribed by the doctor” is representative of a “perceived competence” dimension of trust. In these settings, pre-scribing a medicine without (with minimal) side effects was perceived as a mark of competence. Similarly, the item “there is a big crowd in the clinic of this doctor”is repre-sentative of the “perceived competence” dimension because the crowd was perceived as an indicator of compe-tence. The greater the crowd, the more competent the physician. The items representing the dimension of“ treat-ment assurance at any time of the day, irrespective of the ability to pay” was also unique to this setting, and was articulated as a mark of trust. Also, some of the statements have been worded strongly, for example,“Whatever illness I have I will go only to this doctorfirst”, because there was
Figure 5 This figure shows the test information function of the 22 item scale. It is seen that the test performs optimally in the low to middle trust range but poorly in the high trust range.
on September 22, 2020 by guest. Protected by copyright.
a heavy emphasis on the emotional dimension of these items during the qualitative exploration. However, during the psychometric assessment some of these items were excluded from the scale. This probably points towards the need for modifying these statements for future assess-ments and scale development exercises.
Classical test theory revealed that, except for five items, all the others had good correlation with the total score. Cronbach’sαwas 0.928 and deletion of any of the items did not alter it much, thus indicating strong internal consistency and stability. Item response analysis showed that all the items had good discrimination and gradient of the difficulty parameters, eight items were statistically significant and three items had poor item information functions.
As described previously in the methodology section, the classical test theory and item response theory approaches for psychometric scale development have their unique advantages and pitfalls. In this scale
development process the classical test theory has pro-vided a good estimate of the internal consistency and contribution of each question to the total score. The item response analysis has provided detailed description of the properties of each item, and estimates of item parameters and ability (trust) that are independent of the scale. Further, the sequential use of classical test and item response theory have utilised the advantages of both these methods and removed the relative disadvantages.
In tool development, there are certain important steps that have been described. Thefirst step is generation of the items that will be included in the tool. It has been suggested that the items should be generated based on qualitative research among the target population.43 Many psychometric tools that attempt to measure trust have used item pools that have been generated based on literature review and pre-existing theoretical models. This is one of the few studies where a thorough
Table 7 Original list of items and items finally selected for the scale
Original list of items Items in the final scale
The doctor does appropriate blood tests and other tests to diagnose my disease
The doctor does appropriate tests to diagnose my disease
The doctor gives appropriate medications for my disease The doctor gives appropriate medications for my disease
The doctor prescribes appropriate number of medicines based on the nature of the illness
The doctor prescribed more expensive medicines for serious illnesses
The doctor’s treatment relieves the illness quickly The doctor’s treatment relieves the illness quickly The illness gets relieved with just one visit, there is no need for
repeat visits
There are no side effects to the medicines prescribed by the doctor There are no side effects to the medicines prescribed by the doctor
Friends, relatives and neighbours speak well about the treatment provided by the doctor
Friends, relatives and neighbours recommend me to go to the doctor
Friends, relatives and neighbours recommend me to go to the doctor
I get the confidence that all my illness will get alright when I go to the doctor
I get the confidence that all my illness will get alright when I go to the doctor
There is a big crowd in the clinic of the doctor
If I go to the doctor, I will surely get good treatment for my illness If I go to the doctor, I will surely get good treatment for my illness
The doctor gives me good treatment irrespective of whether I have money to pay
The main intention of the doctor is to treat my illness and not anything else
The main intention of the doctor is to treat my illness and not anything else
Irrespective of what time of the day it is, whenever I go, I can get good treatment from the doctor
Whatever illness I have, I will go only to this doctor Whatever illness I have, I will go only to this doctor first Even if I go to another doctor, I will take the treatment only if this
doctor approves it
I will bring my family members only to this doctor
I will recommend only this doctor to all those who ask me I will recommend this doctor to all those who ask me
I respect the doctor a lot I respect the doctor a lot
I think the doctor is a very learned person I think the doctor is a very learned person I admire the doctor
on September 22, 2020 by guest. Protected by copyright.
qualitative exploration of trust was performed in the population of interest, dimensions of trust identified and a theoretical model proposed by grounded theory approach, and then items developed.22 The developed items were subject to thorough scrutiny by a panel of experts and the tool finalised. These steps take care of the face and content validity of the tool.
A previous exploration of the Trust in Physician Scale of Anderson and Dedrick revealed weak psychometric properties of the scale.43This made it clear that existing scales could not be used to validate the new scale con-currently. A decision was made to assess the construct validity of the scale using the following methods: assess-ment of dimensionality using CFA and item information provided by each item about trust using item response analysis. The tool developed in this study is unidimen-sional, which is most likely to be trust, as the items were developed from qualitative exploration from the same population. Also, the individual items did perform well in terms of gradient of trust in the Likert scale as well as discrimination between low and high-trust individuals.
There are distinct differences between the new trust in physicians scale described here for the developing country context and previous scales of trust. Anderson and Dedrick’s trust in physician scale had three dimen-sions, namely, fidelity, competence and confidentiality.1 Confidentiality did not feature as a dimension in the current scale. It was included in the original 31 items, but its contribution to the construct of trust was found to be negligible. The Medical Professions Trust Scale by Hall et al,12 had an addition dimension of honesty, which was also seen in Hall’s Trust in Primary Care Physician Scale and Zheng et al’s13 Health Insurance Organisation Trust Scale. The current scale does not feature this dimension of honesty. It is likely that honesty is featured inside the dimensions of respect, loyalty and assurance of treatment. A more thorough assessment of an honesty subscale would be useful to understand how this dimension is articulated in the trust discourse in this context. Straten et al’s14 Whole Health System Trust Scale had the dimension of quality of care and effectiveness of communication. The main reason that these items did not feature in the current scale is because developing countries such as India are still struggling to achieve universal coverage. While issues of
financial instability when accessing care, and uncertainty of access, are still issues, quality and communication are usually not considered important. This highlights the importance of contextually appropriate scales to measure trust in different settings.
The strengths of this study are that it is probably one of very few studies on tool development in public health where classical as well as item response approaches have been used. It has utilised the strengths of both the tradi-tions to arrive at a parsimonious tool of 12 items to measure trust in doctors in the culturally unique Indian setting. The tool also seems to perform well over a broad range of low to moderate trust levels. This scale
may not perform especially well in situations where there are very high levels/absence of trust. The main limitation of the study is that it has not addressed the issue of criterion validity or predictive validity. Future studies with the shortened 12 item scale that represents the identified key dimensions of trust in doctors in the Indian setting should try and validate the scale against definite criteria.
Acknowledgements The authors acknowledge Dr Mala Ramanathan, Professor of Public Health, Achuta Menon Centre for Health Sciences Studies, Sree Chitra Tirunal Institute of Medical Sciences and Technology, Trivandrum, India, for reviewing an earlier version of this paper. The authors also acknowledge anonymous peer reviewers whose comments for a previous submission of this paper significantly contributed to improvement of quality of the analysis and reporting.
Contributors VG conceptualised the study, designed the study instruments, collected data, analysed the data, interpreted data, drafted the manuscript and approved the final draft. EW Contributed to conceptualisation of the study, edited the manuscript draft and approved the final draft. SKC conceptualised the study, helped in design of study instrument, edited the manuscript and approved the final draft.
Funding The first author, VG, was supported by the INSPIRE Fellowship of the Department of Science and Technology, Government of India.
Competing interests None declared.
Patient consent Obtained.
Ethics approval Institutional Review Board and ethics committee of the School of Public Health, SRM University.
Provenance and peer review Not commissioned; externally peer reviewed.
Data sharing statement The data set is available with the corresponding author who will provide it on request.
Open Access This is an Open Access article distributed in accordance with the Creative Commons Attribution Non Commercial (CC BY-NC 4.0) license, which permits others to distribute, remix, adapt, build upon this work non-commercially, and license their derivative works on different terms, provided the original work is properly cited and the use is non-commercial. See: http:// creativecommons.org/licenses/by-nc/4.0/
REFERENCES
1. Anderson LA, Dedrick RF. Development of the trust in physician scale: a measure to assess interpersonal trust in patient-physician relationships.Psychol Rep1990;67(3 Pt 2):1091–100.
2. Caterinicchio RP. Testing plausible path models of interpersonal trust in patient-physician treatment relationships.Soc Sci Med Med Psychol Med Sociol1979;13:81–99.
3. David AS. Communicating in times of uncertainty: the need for trust.
J Health Commun2003;8(S1):13–14.
4. Zaner RM. The phenomenon of trust and the patient-physician relationship.Ethics Trust Prof Philos Cultur Aspects1991;45–67. 5. Thom DH, Hall MA, Pawlson LG. Measuring patients trust in
physicians when assessing quality of care.Health Aff
2004;23:124–32.
6. Safran DG, Taira DA, Rogers WH,et al. Linking primary care performance to outcomes of care.J Fam Pract1998;47:213–20. 7. Piette JD, Heisler M, Krein S,et al. The role of patient-physician
trust in moderating medication nonadherence due to cost pressures.
Arch Intern Med2005;165:1749.
8. Trachtenberg F, Dugan E, Hall MA. How patients trust relates to their involvement in medical care.J Fam Pract2005;54:344–52. 9. Thom DH, Ribisl KM, Stewart AL,et al. Further validation and
reliability testing of the Trust in Physician Scale.Med Care
1999;37:510.
10. Lee YY, Lin JL. The effects of trust in physician on self-efficacy, adherence and diabetes outcomes.Soc Sci Med2009;68:1060–8. 11. Mohseni M, Lindstrom M. Social capital, trust in the health-care
system and self-rated health: the role of access to health care in a population-based study.Soc Sci Med2007;64:1373–83.
on September 22, 2020 by guest. Protected by copyright.
12. Hall MA, Zheng B, Dugan E,et al. Measuring patients’trust in their primary care providers.Med Care Res Rev2002;59:293–318. 13. Zheng B, Hall MA, Dugan E,et al. Development of a scale to
measure patients’trust in health insurers.Health Serv Res
2002;37:187–202.
14. Straten GFM, Friele RD, Groenewegen PP. Public trust in Dutch health care.Soc Sci Med2002;55:227–34.
15. Goudge J, Gilson L. How can trust be investigated? Drawing lessons from past experience.Soc Sci Med2005;61:1439–51.
16. Egede LE, Ellis C. Development and testing of the multidimensional trust in health care systems scale.J Gen Intern Med
2008;23:808–15.
17. Dugan E, Trachtenberg F, Hall M. Development of abbreviated measures to assess patient trust in a physician, a health insurer, and the medical profession.BMC Health Serv Res2005;5:64.
18. Goold SD, Fessler D, Moyer CA. A measure of trust in insurers.
Health Serv Res2006;41:58–78.
19. Rose A, Peters N, Shea JA,et al. Development and testing of the health care system distrust scale.J Gen Intern Med2004;19:57–63. 20. Leisen B, Hyman MR. An improved scale for assessing patients’
trust in their physician.Health Mark Q2001;19:23–42.
21. Makinen M, Waters H, Rauch M,et al. Inequalities in health care use and expenditures: empirical data from eight developing countries and countries in transition.Bull World Health Organ2000;78:55–65. 22. Gopichandran V, Chetlapalli SK. Dimensions and determinants of
trust in health care in resource poor settings—a qualitative exploration.PLoS ONE2013;8:e69170.
23. Baidya M, Gopichandran V, Kosalram K. Patient physician trust among adults of rural Tamil Nadu: a community based survey.
J Postgrad Med2014;60:21–6.
24. Ramani KV, Mavalankar D. Health system in India: opportunities and challenges for improvements.J Health Organ Manag
2006;20:560–72.
25. Peters DH, Muraleedharan VR. Regulating India’s health services: to what end? What future?Soc Sci Med2008;66:2133–44. 26. OECD. OECD Health Data 2012. 2012.
27. Roy K, Howard DH. Equity in out-of-pocket payments for hospital care: evidence from India.Health Policy2007;80:297–307. 28. Balabanova D, Mills A, Conteh L,et al. Good Health at Low Cost 25
years on: lessons for the future of health systems strengthening.
Lancet2013;381:2118–33.
29. Kotrlik JWKJ, Higgins CCHC. Organizational research: determining appropriate sample size in survey research appropriate sample size in survey research.Info Technol Learn Perform J2001;19:43. 30. Hambleton RK, Jones RW. Comparison of classical test theory and
item response theory and their applications to test development.
Educ Meas1993;12:38–47.
31. SPSS Inc. SPSS Statistics for Windows Version 17.0, 2008. 32. IBM SPSS Amos Version 20, 2011.
33. Paek I, Han KT. IRTPRO 2.1 for windows (item response theory for patient-reported outcomes).Appl Psychol Meas2013;37:242–52. 34. Hooper D, Coughlan J, Mullen M. Structural equation modelling:
guidelines for determining model fit.Electronic J Business Res Methods2008;6:53–60.
35. Chen WH, Thissen D. Local dependence indexes for item pairs using item response theory.J Educ Behav Stat1997;22:265–89. 36. Samejima F.Graded response model. Handbook of modern item
response theory. Springer, 1997:85–100.
37. Kang T, Cohen AS, Sung HJ. Model selection indices for polytomous items.Appl Psychol Meas2009;33:499–518. 38. Navaneetham K, Dharmalingam A. Demography and development:
preliminary interpretations of the 2011 census.Econ Pol Weekly
2011;46:13.
39. Dyson T. The preliminary demography of the 2001 census of India.
Popul Dev Rev2001;27:341–56.
40. Chowdhury S. Employment in India: what does the latest data show?Econ Pol Weekly2011;46:23–6.
41. Nunnally JC, Bernstein IH.Psychometric Theory. 3rd edn. New York: McGraw-Hill, 1994.
42. DeMars C.Item response theory. Oxford University Press, 2010. 43. Streiner DL, Norman GR.Health measurement scales: a practical
guide to their development and use. Oxford University Press, 2008.
on September 22, 2020 by guest. Protected by copyright.