Cotton is an important fibre crop of global significance, which is, cultivated in tropical and sub-tropical regions of more than seventy countries the world over. The major producers of cotton are China, India, USA, Pakistan, Uzbekistan, Argentina, Australia, Greece, Brazil, Mexico and Turkey. These countries contribute about 85% to the global cotton production. India made its long-awaited
Cotton Productivity, Profitability and Changes in Soil
Properties under Different Nutrient Management Practices
M. Ranjith
1*, S. Sridevi
2, M. Venkata Ramana
3and P. Chandrasekhar Rao
41*Department of Soil Science and Agricultural Chemistry, Professor Jayashankar Telangana State Agricultural University, College of Agriculture, Rajendranagar, Hyderabad, Telangana State, India.
2&3AICRP on Integrated Farming Systems, Professor Jayashankar Telangana State Agricultural University, Rajendranagar, Hyderabad, Telangana State, India.
4Dean, P.G. Studies, Professor Jayashankar Telangana State Agricultural University, Rajendranagar, Hyderabad, Telangana State, India.
*Corresponding author: [email protected]
Abstract
Cotton is an important fibre crop of global significance, which is, cultivated in tropical and sub-tropical regions of more than seventy countries the world over. A field experiment was conducted duringkharif, 2013 to evaluate the nutrient requirement ofBt cottonvis-a-vis fertilizer practices in vogue. At different growth stages, except control, all other treatments recorded higher number of monopodial and sympodial branches than 100% RDF. Incremental doses of fertilizers increased number of bolls plant-1 but very high doses practiced by farmers did not help in increasing boll number. Kapas yield increased with increasing fertilizer dose from 100 to 150% but was on par with the yield realized in 100% NPK and soil test based fertilizer application. Quality parameters like seed index, lint index and ginning out turn were not influenced by the fertilizer treatments. Availability nitrogen was lowest in control and highest in farmers’ practice. Availability phosphorus and potassium was lowest in control and highest in soil test based fertilizer application. Available sulphur content in soil was lowest in control and highest in 150% RDF + S @ 30 kg ha-1. Micronutrient status in soil at flowering and harvest stages was not significantly influenced by the fertilizer treatments. Economic analysis also indicated that application of very high doses of fertilizers did not help in getting higher net returns or higher benefit cost ratio. It is logical to resortof soil test based fertilizer application or to adopt the present recommendation of 150:60:60 kg NPK ha-1 for profitable cultivation ofBt cotton in Warangal district of Telangana state.
Highlights:
• Adoption of soil test based fertilizer application or present recommendation of 150:60:60 kg NPK ha-1 stands valid for profitable cultivation ofBt cotton in Warangal district of Telangana State.
Keywords:Btcotton, nutrient management, productivity, profitability, nutrient availability, economics
entry into commercial agricultural biotechnology in March 2002 with the approval ofBt-cotton hybrids for commercial cultivation. India has the largest acreage (10.33 m. ha) under cotton at global level and has the productivity of 486 kg lint ha-1 and ranks second in production 295 lakh bales (5.02 m MT) after China during 2013-14. Introduction ofBt hybrids has promoted Citation: IJAEB: 8(4): 915-922 December 2015
DOI Number: 10.5958/2230-732X.2015.00104.7
©2015 New Delhi Publishers. All rights reserved
Soil Science
during 2014-15 in the state of Telangana and Warangal is one of the major cotton growing district with 2.5 lakh hectares during 2014-15 (Advance estimates of Department of Agriculture, Govt of Telangana State).Cotton, particularly hybrid cotton being exhaustive, draw plenty of soil nutrients and thus under continuous cropping pattern nutrient management assumes importance. The yield potential of the crop can be exploited to the maximum only when the nutrient requirements are fully met. The optimal dose of nutrients builds up a favourable condition in increasing cotton productivity and improves the quality. On the other hand, excess application of fertilizer has its own limitation in promoting vegetative growth. Response of nutrients in cotton varies significantly among varieties and locations and therefore, region specific recommendation of nutrients are essential. Keeping these points in view, the present study was undertaken to investigate the response ofBtcotton to different fertilizer levels and finding the best management practice for higher productivity and profitability.
Material and Methods
The present study was carried out duringkharif,2013 at research farm of KVK, Malyal, Warangal district. Nine treatments viz., Control, Farmers practice, Recommended dose of fertilizers (RDF-150:60:60 kg NPK ha-1), RDF + S @ 30 kg ha-1, Soil test based fertilizer application for an yield target of 25q ha-1, 125% RDF, 125% RDF + S @ 30 kg ha-1,150% RDF, 150% RDF + S @ 30 kg ha-1 were tested in randomised block design with 3 replications to evaluate the nutrient requirement ofBt
cottonvis-a-vis fertilizer practices in vogue. The soil of the experimental site was sandy clay loam in texture with 67% sand, 13% silt and 20% clay content. The soil was neutral in reaction (7.04) with low electrical conductivity (0.17dSm-1), medium in organic carbon content (0.57%), low in available N(156.8 kg ha-1), low in available P(9.98 kg ha-1) and medium in available K (190.4 kg ha-1), deficient in available S (5.2 ppm), low in available Zn (0.22 ppm) and high in Cu, Mn and Fe (3.7, 30.8 and 16.3 ppm respectively).
All the treatments were imposed using straight fertilizers Viz., Urea, Single Super Phosphate, Muriate of Potash and Sulphur dust to supply NPK and Sulphur. Entire dose of phosphorus and sulphur were applied at the time of sowing as basal while nitrogen and potassium were applied in four splits at 20, 40, 60 and 80 days after sowing as recommended by the State Agricultural University (ANGRAU).
district were not available, soil test equations developed forAlfisols of Kadapa region of Andhra Pradesh by STCR approach were used for obtaining the fertilizer doses under Soil test based fertilizer application for an yield target of 25q ha-1 treatment:
F N = 8.15
×
T – 0.57 SN;
F P
2O
5= 2.95
×
T – 2.80 SP;
F K
2O = 5.92
×
T – 0.66 SK
To identify the farmers’ nutrient management practices, a survey was carried out by collecting information from cotton cultivators in Warangal district during prekharif
season of 2013. Results revealed that farmers of this region apply very high doses fertilizers to cotton. The average fertilizer dose adapted in Warangal district was 333:97:142:17 kg NPKS ha-1as against recommended dose of 150:60:60 and yield realized was ranging from 21-35 q ha-1 with an average 30 q ha-1.
Available nutrients were estimated by using the standard extractants and procedures viz. nitrogen by 0.32% Alkaline KMnO4 (Subbaiah and Asija, 1956), phosphorus by Olsens method with 0.5M NaHCO3 (Olsenet al. 1954), potassium with 1 N Neutral Normal Ammonium Acetate method (Jackson, 1973) and sulphur by Turbidometric method with 0.15% CaCl2 (Williams and Steinberg, 1959). The available micronutrients (Zn, Cu, Mn and Fe) were analysed in Atomic absorption spectrophotometer using DTPA extractant (Lindsay and Norvell, 1978).
Results and Discussion
Effect of fertilizer doses on monopodial and sympodial branches
Ta
bl
e
1.
Y
ie
ld
a
ttr
ib
ute
s
of
Bt
c
otto
n
as
in
fl
ue
nc
ed
b
y
d
if
fe
re
nt
fe
rti
liz
er
p
ra
cti
ce
Trea tments
Productivity Profitabi lity
Seed cotton yiel d (kg ha-1)
Seed Index
(g)
l int index
(g)
Ginning Out Turn
(%)
Co st of Cultivation
(`ha-1)
Gross Returns
(`ha-1)
Net Returns
(`ha-1)
Benefit Co st rati o
Cont rol (No fertili zer) 1249 8.24 4.83 37.0 29350 46123 16863 1.57
Farmers practi ce
(333-97 -142-17 kg NPKS ha-1) 3582 8.30 4.88 36.5 41978 132542 90564 3.16
Recommended dose of fert ilizers
(RDF) (150-60 -60 kg NPK ha-1) 3616 8.32 5.00 37.5 35618 135069 99451 3.79
RDF + S @ 30 kg ha-1
(150-60 -60-30 kg NPKS ha-1) 3665 8.34 5.07 37.7 35794 135365 99571 3.78
Soil Test bas ed fertil izer appli cation
(114-104 -28 kg NPK ha-1) 3688 8.32 5.03 37.5 36130 136457 100327 3.78
125% RDF (188-75-75 k g NPK h a-1) 3717 8.37 5.09 37.8 37157 137545 100388 3.70
125% RDF + S @ 30 kg ha-1
(188-75 -75 -30 kg NPKS ha-1) 3747 8.40 5.14 38.0 37333 138627 101294 3.71
150% RDF (225-90-90 k g NPK h a-1 ) 3837 8.42 5.10 37.5 38711 141967 103256 3.67
150% RDF + S @ 30 kg ha-1
(225-90 -90 -30 kg NPKS ha-1 ) 3845 8.44 5.08 37.3 38887 142257 103370 3.66
SEm + 202 0.05 0.41 2.0
CD (P=0.05) 612 NS NS NS
Table 2. Productivity and Profitability ofBt cotton as influenced by different fertilizer practices
Treat ments pH EC
(dS m-1)
CEC (cmol (P+) kg-1)
OC (%)
Control(No fertilizer) 7.1 0.16 23.0 0.60
Farmers practice
(333:97:142:17 kg NPKS ha-1) 6.9 0.19 28.8 0.54
Recommended dose of fertilizers (RDF)
(150:60:60 kg NPK ha-1) 7.0 0.17 27.2 0.57
RDF + S @ 30 kg ha-1
(150:60:60:30 kg NPKS ha-1) 7.0 0.17 28.0 0.57
STB fertilizer application
(114:104:28 kg NPK ha-1) 7.0 0.17 26.9 0.57
125% RDF(188:75:75 kg NP K ha-1) 7.0 0.18 28.1 0.56
125% RDF + S @ 30 kg ha- 1
(188:75:75:30 kg NPKS ha-1) 7.0 0.18 28.5 0.56
150% RDF (225:90:90 kg NPK ha-1) 6.9 0.19 29.8 0.55
150% RDF + S @ 30 kg ha- 1
(225:90:90:30 kg NPKS ha-1) 6.9 0.19 30.5 0.55
SEm+ 0.07 0.007 2.0 0.01
CD (P=0.05) NS NS NS NS
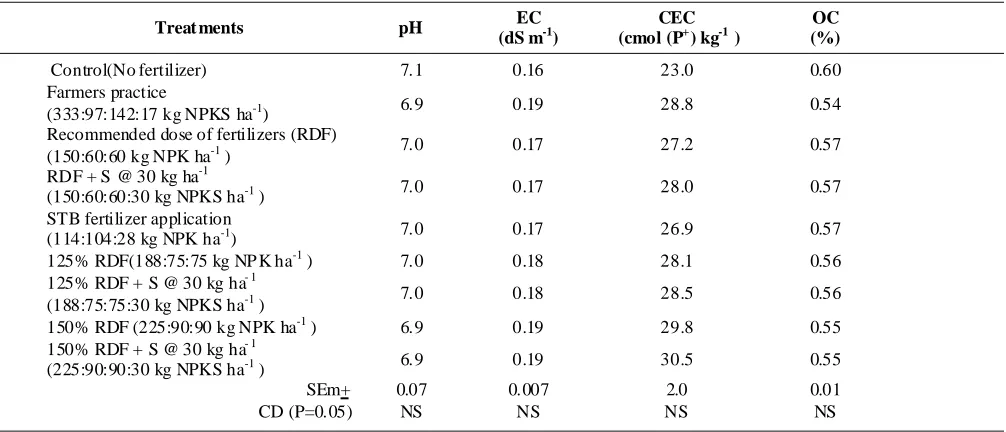
Table 3. Physico–chemical properties and organic carbon content of post harvest soil as influenced by different
Treatments
Nitrogen (kg ha-1) Phosphorus (kg ha-1) Potassium (kg h a-1) Sulphur (ppm)
Flowering Harvest Flowering Harvest Flowering Harvest Flowering Harvest
Control (No fertilizer) 134.7 123.7 8.5 7.9 174.5 162.0 3.4 2.4
Farmers practice
(333-97-142-17 kg NPKS ha-1) 187.5 170.8 37.3 32.5 267.5 235.3 13.6 10.7 Recommended dose of
fertilizers (RDF) (150-60-60 kg NPK ha-1)
150.5 141.3 21.0 17.7 211.5 196.9 7.7 6.1
RDF + S @ 30 kg ha-1
(150-60-60-30 kg NPKS ha-1) 163.2 145.8 22.5 19.7 215.3 198.2 8.6 7.8 Soil Test based fertilizer
application
(114-104-28 kg NPK ha-1)
143.8 135.2 40.0 34.2 196.8 183.9 8.7 7.4
125% RDF
(188-75-75 kg NPK ha-1) 156.1 145.2 25.5 19.6 225.2 209.0 8.1 6.5
125% RDF + S @ 30 kg ha-1
(188-75-75 -30 kg NPKS ha-1) 168.8 158.2 28.5 23.3 230.9 217.3 9.3 8.5 150% RDF
(225-90-90 kg NPK ha-1) 165.3 150.3 32.0 27.2 239.7 223.7 8.6 7.1
150% RDF + S @ 30 kg ha-1
(225-90-90 -30 kg NPKS ha-1) 173.5 165.4 34.2 30.0 245.1 228.8 14.8 12.1
SEm + 6.4 7.8 1.3 1.7 8.2 11.6 0.7 0.5
CD (P =0.05) 19.3 23.5 4.0 5.1 24.8 35.0 2.1 1.6
Table 4. Available nitrogen, phosphorus, potassium and sulphur status in soil at flowering and harvest ofBtcotton
as influenced by different fertilizer practices
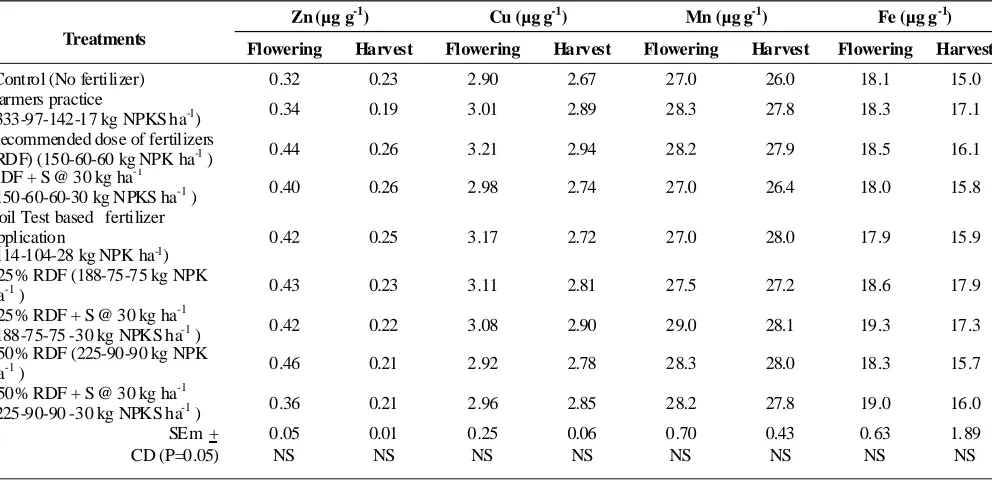
Table 5. Available Micronutrient status of soil at flowering and harvesting stages of Bt cotton as influenced by
different fertilizer practices
Treatments
Zn (µg g-1) Cu (µg g-1) Mn (µg g-1) Fe (µg g-1)
Flowering Harvest Flowering Harvest Flowering Harvest Flowering Harvest
Control (No fertilizer) 0.32 0.23 2.90 2.67 27.0 26.0 18.1 15.0
Farmers practice
(333-97-142-17 kg NPKS ha-1) 0.34 0.19 3.01 2.89 28.3 27.8 18.3 17.1
Recommended dose of fertilizers
(RDF) (150-60-60 kg NPK ha-1) 0.44 0.26 3.21 2.94 28.2 27.9 18.5 16.1 RDF + S @ 30 kg ha-1
(150-60-60-30 kg NPKS ha-1) 0.40 0.26 2.98 2.74 27.0 26.4 18.0 15.8
Soil Test based fertilizer application
(114-104-28 kg NPK ha-1)
0.42 0.25 3.17 2.72 27.0 28.0 17.9 15.9
125% RDF (188-75-75 kg NPK
ha-1) 0.43 0.23 3.11 2.81 27.5 27.2 18.6 17.9
125% RDF + S @ 30 kg ha-1
(188-75-75 -30 kg NPKS ha-1) 0.42 0.22 3.08 2.90 29.0 28.1 19.3 17.3
150% RDF (225-90-90 kg NPK
ha-1) 0.46 0.21 2.92 2.78 28.3 28.0 18.3 15.7
150% RDF + S @ 30 kg ha-1
(225-90-90 -30 kg NPKS ha-1) 0.36 0.21 2.96 2.85 28.2 27.8 19.0 16.0
SEm + 0.05 0.01 0.25 0.06 0.70 0.43 0.63 1.89
leading to increased number of lateral branches. Kumar
et al. (2011) reported increase in monopodial branches plant-1 by 5.4 percent with the application of 125% of recommended dose of fertilizer when compared to 100% RDF (150:60:60 kg NPK ha-1) and 1.4% increase in sympodials due to application of 125% recommended dose of fertilizer.
Effect of fertilizer doses on boll number and development
Boll number and boll weight are very important yield attributing characters that decide the yield. At all stages, control treatment recorded lowest number of bolls plant -1. Incremental doses of fertilizers increased number of bolls plant-1 but very high doses of fertilizers as practiced by farmers did not help in increasing boll number. At all the stages, higher number of bolls were produced by the crop that received 150% RDF + S @ 30 kg ha-1 but it was on par with number of bolls in other fertilizer treatments. Boll weight at 120 DAS also followed similar trend as that of boll number. In confirmation to reports of Devraj
et al. (2011) and Nehraet al. (2012) this trend reiterates the fact that excess application of fertilizers particularly nitrogen results in increased vegetative growth but does not help in promoting production of reproductive parts that contribute to yield.
Effect of fertilizer doses on seed cotton (kapas)
yield:The yield potential of the crop can be exploited to
the maximum only when the nutrient requirements are fully met. On the other hand, excess application of fertilizer has its own limitations. In the present study, kapas yield was significantly influenced by the fertilizer doses (Table 2). Lowest yield (1249 kg ha-1) was recorded in unfertilized plots. Increasing fertilizer dose from 100 to 150% increased the kapas yield but it was on par with the yield realized in 100% NPK (3616 kg ha-1) and soil test based fertilizer application treatments (3688 kg ha-1). Further, in farmers’ practice the yield (3582 kg ha-1) was even less and on par with that of 100% NPK. This might be due to imbalance of nutrients caused by excessive application of fertilizers. Fertilizer response studies inBt cotton hybrid carried out by Reddyet al.
(2010) indicated that response to nitrogen was observed up to 150 kg ha-1only, and with further increase in N level cotton yield was reduced and response to phosphorus and potassium was observed up 60 kg ha-1 each. Studies of Asewaret al.(2012) and Buttaret al.
(2010) also confirm these results.
Though the experimental soil was deficient in sulphur, response was not observed to applied sulphur. Inclusion
fertilizers (125 and 150%) did not result in any additional yield increment in this study. A seed cotton yield of 3665, 3747 and 3845 kg ha-1 was realized with addition of 30 kg Sha-1 along with 100%, 125% and 150% recommended doses of NPK respectively. This might be due to the fact that sulphur received through SSP was sufficient to meet the requirement of crop. Thus use of straight fertilizers like SSP to supply phosphorus not only reduced the cost of production but also helped in meeting the sulphur demand of crop. At higher levels of phosphorus (125 and 150%) inclusion of sulphur resulted in very little increment in yields. This might be due to antagonistic effect of phosphorus and sulphur as both are present in available form in soil as anions (Marok and Dev, 1980). Further, kapas yield in soil test based fertilizer treatment (3688 kg ha-1) was higher than the targeted yield of 25 q ha-1. The reason was that, since no STCR equations were available forBt cotton in Warangal region, equations developed for red soils of Kadapa region of Andhra Pradesh were used for this study. The result suggests the need for development and validation of new STCR equations for use in Warangal district, especially in the context of very high yield potential of recentBtcotton hybrids as indicated by the yield in control (1249 kg ha -1). These higher yields also indicate the nutrient mining ability of cotton hybrids to meet their nutrient requirements even under low nutrient supply.
In confirmation to the findings of Kumaret al.(2010) quality parameters viz. seed index, lint index and ginning out turn were not influenced by the fertilizer treatments. Seed index was highest (8.44 g) in 150% RDF +S@ 30 kg ha-1 treatment and was lowest in control (8.24 g). Lint index and ginning out turn were highest (5.14g and 38.0%) in 125% RDF +S @ 30 kg ha-1 treatment and lowest were recorded in control (4.83 g and 37.0%). This might be due to the fact that quality was more controlled by genetic make-up of the plant than nutrient supply and uptake by plant (Rao and Janawade, 2009).
Effect of different fertilizer doses on Economics of cotton cultivation
same benefit cost ratio with very meager additional returns of` 120 ha-1. Farmers’ practice of application of very high doses of fertilizers was involving an additional cost of nearly` 6,500 when compared to application of recommended doses of fertilizer or application of fertilizers based on soil test. Farmers practice neither helped in getting higher net returns or higher benefit cost ratio Hence it is logical to resort to application of soil test based fertilizer application or to adopt the present recommendation of 150:60:60 kg NPK ha-1 for profitable cultivation ofBt cotton in Warangal district.
Effect of fertilizer doses on soil physico-chemical properties and nutrient availability
Soil physico-chemical properties like soil reaction, electrical conductivity, organic carbon content and cation exchange capacity at harvest did not show any significant change with reference to fertilizer treatments (Table 3).
Availability of nutrients at flowering and harvest stages recorded significant changes with reference to treatments (Table 4). Nitrogen availability was lowest in control (134.7 and 123.7 kg ha-1) and was highest in farmers’ practice (187.5 and 170.8 kg ha-1) at flowering and harvest stages respectively and these were significantly different from nitrogen status in 100% RDF treatment. Gadhiyaet al. (2009) also reported increased available N content in soil after harvest ofBtcotton crop with higher dose of N application. Phosphorus availability was lowest in control (8.5 and 7.9 kg ha-1) and highest in soil test based fertilizer application treatment (40.0 and 34.2 kg ha-1) at flowering and harvest respectively. At both the stages, farmers’ practice treatment also recorded high (37.3 and 32.5 kg ha-1) and on par available P as that of soil test based fertilizer treatment. In all other treatments, phosphorus status was low and treatmental variations were significant. Available potassium content in soil decreased from flowering to harvest. Availability of potassium at was lowest in control (174.5 and 162.0 kg ha-1) and was highest in farmers’ practice treatment (267.5 and 235.3 kg ha-1) at flowering and harvest stages respectively. In soil test based fertilizer treatment also the available potassium was significantly low and was on par with control. Available potassium status was significantly higher in 150% RDF (with and without sulphur) over 100% RDF. Kalaichelvi (2008) reported that the application of higher levels of nutrients at the rate of 200:100:100 kg NPK ha-1 had obtained significantly higher nitrogen and phosphorus availability but no significant influence on potassium availability at a 60 DAS, 80 DAS and post harvest stage of theBt cotton crop.
Addition of sulphur along with fertilizers resulted in higher sulphur status in soil. Available sulphur content in soil was lowest in control (3.4 and 2.4 mg kg-1) and highest in 150% RDF +S @ 30 kg ha-1 treatment (14.8 and 12.1 mg kg-1) at flowering and harvest stages respectively. Farmer’s practice (13.6 and 10.7 mg kg-1) also recorded high and on par available sulphur as that of 150% RDF +S @ 30 kg ha-1 treatment. In all other treatments, sulphur status was low and treatmental variations were non-significant.
Micronutrient status in soil at flowering and harvest stages was not significantly influenced by the fertilizer treatments (Table 5). Available zinc, copper, iron and manganese were high at flowering stage and decreased at harvest. At flowering, available zinc status was highest in 150% RDF (0.46 mg kg-1) and lowest was recorded in control (0.32 mg kg-1). At harvest 100% RDF treatment with and without sulphur recorded highest zinc status (0.26 mg kg-1) and the lowest was recorded farmers’ practice (0.19 mg kg-1) indicating the imbalance arising due excessive use of fertilizers. Available copper, at flowering stage was highest in soil test based fertilizer application treatment (3.17 mg kg-1) and lowest was recorded in control (2.90 mg kg-1). At harvest, 125% RDF with sulphur recorded highest copper status (2.90 mg kg-1) and the lowest was recorded farmers’ practice (2.67 mg kg-1). Available manganese, at flowering stage was highest in 125% RDF + S @ 30 kg ha-1 treatment (29.0 mg kg-1) and lowest was recorded in control, 100% RDF + S @ 30 kg ha-1 and soil test based fertilizer application treatments (27.0 mg kg-1). At harvest 125% RDF with sulphur recorded highest manganese status (28.1 mg kg-1) and the lowest was recorded control (26.0 mg kg-1). Highest available iron status at flowering was recorded in 125% RDF with sulphur (19.3 mg kg-1) and the lowest in soil test based fertilizer application treatment (17.9 mg kg-1) while at harvest higher available iron was recorded in 125% RDF (17.9 mg kg-1) and lowest was recorded in control (15.0 mg kg-1).
Conclusion
Asewar, B.V., Pawar, S.U., Bhosle, G.P. and Gokhale, D.N. 2013. Effect of spacing and fertilizer levels on seed cotton yield and economics ofBt cotton.Journal of Cotton Research and Development 27(1): 63-65.
Buttar, G.S., Sekhon, K.S. and Singh, S. 2010. Effect of different spacings and nitrogen levels on growth and yield attributes of American cotton (Gossypium hirsutum L.) Bt hybrids under irrigated conditions.Journal of Cotton Research and Development24(2): 73-75.
Devraj, Bhattoo, M.S., Duhan, B.S., Kumari, P. and Jain, P.P. 2011. Effect of crop geometry and fertilizer levels on seed cotton yield and nutrient uptake of
Bt cotton under irrigated conditions. Journal of Cotton Research and Development25(2): 176-180. Gadhiya, S., Patel, B.B., Jadav, N.J., Pavaya, R.P., Patel, M.V. and Patel, V.R. 2009. Effect of different levels of nitrogen, phosphorus and potassium on growth, yield and quality ofBtcotton. An Asian Journal of Soil Science4(1): 37-42.
Jackson, M.L. 1973. Soil Chemical analysis. Prentice Hall of India (P) Ltd., New Delhi. Pp. 1-485.
Kalaichelvi, K. 2008. Effect ofBt hybrids, plant geometry and fertilizer levels on soil nutrient availability.
Agricultural Science Digest 28(4): 250-253. Kumar, J., Parihar, M.S., Singh, R.V., Chauhan and Babu,
R. 2010. Effect of different nutrients on growth, yield attributes and yield of cotton under varying cotton cultivars.Journal of Cotton Research and Development24(2): 193-195.
Kumar, M., Pannu, R.K., Nehra, D.S. and Dhaka, A. 2011. Effect of spacing and fertilizer on growth, yield
of Cotton Research and Development 25(2): 236-239.
Lindsay, W.L. and Norvell, W.A. 1978. Development of a DTPA micronutrient soil test for zinc, iron, manganese and copper. Soil Science Society of American Journal 42(3): 421-428.
Marok. A. and Dev, G.J. 1980. Nuclear Agricultural Biology 9: 54.
Nehra, P.L. and Yadav, P.S. 2012. Effect of spacing and fertilizer levels on hirsutum cotton variety H 1300 in canal command area of North West Rajasthan.
Journal of Cotton Research and Development
26(2): 207-208.
Olsen, S.R., Cole, C.V., Watanade, F.S. and Dean, L.A. 1954. Estimation of available phosphorus in soil by extraction with sodium bicarbonate.Cri. United States. Department of Agriculture 939.
Rao, S. and Janawade, D. 2009. Influence of integrated nutrient management practices on physico-chemical properties of cotton growing soils.
Journal of Cotton Research and Development
23(1): 60-63.
Reddy, P.R.R. and Kumar, D. 2010. Fertilizer response studies in Bt cotton hybrid. Journal of Cotton Research and Development 24(1): 76-77.
Subbiah, B.V. and Asija, G.L. 1956. A rapid method for the estimation of available nitrogen in soils.
Fertilizer Research 2: 303-308.