Abstract—Tin oxide nanoparticles are prepared by
electrochemical reduction method using tetrapropylammonium bromide (TPAB) and tetrabutylammonium bromide (TBAB) as structure directing agent in an organic medium viz. tetrahydrofuran (THF) and acetonitrile (ACN) in 4:1 ratio by optimizing current density and molar concentration of the ligand. The reduction process takes place under an inert atmosphere of nitrogen over a period of 2 h. Such nanoparticles are prepared by using a simple electrolysis cell in which the sacrificial anode as a commercially available in tin metal sheet and platinum (inert) sheet act as a cathode. The parameters such as current density, solvent polarity, distance between electrodes and concentration of stabilizers are used to control the size of nanoparticles. The synthesized tin oxide nanoparticles are characterized by using UV–Visible, FT-IR and SEM–EDS analysis techniques. UV-Visible spectroscopy has revealed the optical band gap to be 4.13, 4.16 and 4.24 ev for (8, 10 and 12 mA/cm2) and the effect of current density on theirs particle size, respectively.
Index Terms—Band gap, Electrochemical cell, Tetrabutylammonium bromide (TBAB), Tetrapropylammonium bromide (TPAB), Tin oxide nanoparticles.
I. INTRODUCTION
Tin oxide is an important n-type semiconductor material with a band gap of 3.6 ev. It has been widely used in many applications such as optoelectronic devices (Kim, et al., 2002) fabricating solar cells (Moustafid, et al., 2002; Okuya, et al., 2001) electrochemical applications (Chen and Liu, 1999), electrode materials for Li-ion batteries (Kim, et al., 2005), catalysts for redox reactions (Chou, et al., 2003; Wierzchowski and Zatorski, 2003) and gas sensors (Moulson
______________________________________________________________ ARO-The Scientific Journal of Koya University
Volume I, No (1)2013, Article ID: 10028, 5 pages DOI: 10.14500/aro.10028
Received 08 September 2013; Accepted 08 October 2013 Regular research paper: Published 20 November 2013
Corr. author’s e-mail: [email protected] Copyright © 2013 Karzan Abdulkareem Omar. This is an open access article distributed under the Creative Commons Attribution License.
and Herbert, 1990; Li, Zhang and Kawi, 1999). Due to its high sensitivity to reduce as well as to oxidize gases, SnO2 has been
used as the predominant sensing material in the field of solid-state gas sensors for environmental monitoring of CO, H2, and
NO.
The large surface area of SnO2 allows more surface to be
available for CO adsorption and the subsequent desorption of CO2, which in turn would allow for an increase in its
sensitivity (Sharp, et al., 1998; Farrukh, Heng and Adnan, 2010). Nanosized SnO2 could enhance the sensor performance
because of its microstructural characteristics and electronic properties. In this work, I have synthesized SnO2 nanoparticles
by electrochemical reduction method because this method has several advantages such as high yield, easy isolation and simple control of size particles by adjustment of the current density.
II. EXPERIMENT
The synthesis of tin oxide nanoparticles by electrochemical reduction method for narrow size distributed metal nanoparticles. Cluster size was found to decrease with an increase in current density. This process has been used with two inexpensive electrodes to setup 50ml electrolyte solutions in which sacrificial anode consist of the bulk metal transformed into metal clusters. The supporting electrolyte consists of (TPAB and TBAB), each has served as a stabilizer for the metal clusters in different current density.
Thus in overall process the bulk metal is oxidized at the anode, the metal cations migrate toward the cathode and reduction will take place with the formation of metal or metal oxide in the zero oxidation state.
At anode Sn0 → Sn2+ + 2e- At cathode Sn2+ + 2e- → Sn0
At anode tin (Sn0) is oxidized from zero oxidation state to Sn+2 due to the potential difference between both electrodes. The metal cations (Sn+2) migrated from anode electrode to cathode electrode where the reduction took place with the formation of tin (Sn0) or tin oxide (SnO2) in the zero oxidation
state. Agglomeration with the formation of undesired metal
Tin Oxide Nanoparticles: Synthesis,
Characterization and Study their Particle Size at
Different Current Density
Karzan Abdulkareem Omar
powders is prevented by the presence of ammonium stabilizers. Initially, a tin sheet (1×1 cm) as an anode and a platinum sheet (1×1 cm) as a cathode were used in this work. The two electrodes were 1 cm apart. Tetrabutylammonium bromide (C16H36BrN) and Tetrapropylammonium bromide (C12H28NBr) (0.01 M) in acetonitrile/tetrahaydrofuran (4:1) served as supporting electrolyte. Upon applying current density of (8, 10 and 12 mA/cm2) obtained 95% of tin oxide clusters stabilized by TPAB and TBAB. On application of electrical current, the anode slowly dissolves leading to formation and subsequently get passivated by active TPAB and TBAB species. The cluster size was found to decrease with an increase in current density.
This electrochemical reduction preparation of SnO2
nanoparticles is shown in Fig. 1.
TPAB or TBAB (0.01 M) ACN 80 ml + THF 20 ml
Stirring for 2h (8,10 & 12 mA/cm2 ) Settling down for 1 day
Separation of supernatant
Washing by THF for 2-3times
Drying in desiccators
SnO2 nanoparticles
Fig. 1. Electrochemical reduction preparation of SnO2nanoparticles.
III. RESULTS AND DISCUSSION A. SEM Analysis of Tin Oxide Nanoparticles
The surface morphology of SnO2 nanoparticles is studied by
scanning electron microscope. Fig. 2 shows the SEM image SnO2 nanoparticles with magnification of 600. The
instrumental parameters, accelerating voltage, spot size and magnification are used to obtain SEM image. It shows the microstructure of the electrochemical reduction, which runs the tin oxide nanoparticles that reveals the presence agglomerations.
The appearance of some particles has an irregular shape and their distributions are not uniform, and it is due to the partial solubility of surfactant in the solvent under the given experimental conditions at room temperature.
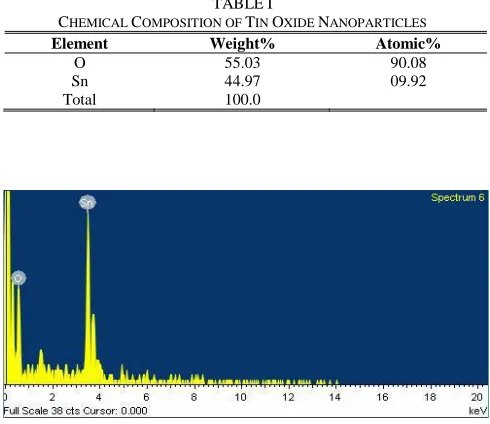
B. EDS Analysis of Tin Oxide Nanoparticles
The chemical compositions of synthesized tin oxide nanoparticles have been studied by EDS. Table I shows the ratio of oxygen and tin, which contains weight 55.03% and atomic 90.08 % of oxygen and weight 44.97% and atomic
9.92% of tin. Thus the total ratio of both elements equals to 100. Fig. 3, EDS, indicates the presence of both elements.
Fig. 2. SEM image of a prepared tin oxide nanoparticles capped with 0.01M TPAB (current density 10 mA/cm2).
TABLEI
CHEMICAL COMPOSITION OF TIN OXIDE NANOPARTICLES
Element Weight% Atomic%
O 55.03 90.08
Sn 44.97 09.92
Total 100.0
Fig. 3. Energy Dispersive Spectrum indicating the chemical composition of freshly prepared SnO2 nanoparticles capped with 0.01M TPAB (current
density 10 mA/cm2).
C. FTIR Analysis of Tin Oxide Nanoparticles
Fig. 4 Shows Fourier transformed spectrum of SnO2
nanoparticles at room temperature. The spectrum has been recorded in the range of 4000-800 cm-1. The FTIR spectrum shows the characteristic peaks at 1378, 968, 565 and 533 cm-1. The bands at 1378 cm-1 and 968 cm-1 have been assigned to lattice vibrations due to decreasing the intensity which leads to overtones and combinations.
Fig. 4. FTIR of SnO2 nanoparticles capped with 0.01 M TPAB (current
density 10 mA/cm2).
D. UV-Visible Analysis of Tin Oxide Nanoparticles
The optical absorptions of tin oxide spectrum at (8, 10 and 12 mA/cm2) are sketched in the Figs. 5, 6, 7, 8, 9 and 10 and their absorbance are given in Tables II, III, IV, V, VI, and VII, respectively. It can be seen that the strongest absorption peak of the prepared samples at different mA of all samples appears at around 300 nm, 298 nm and 292 nm, which is fairly blue shifted from the absorption edge of SnO2 nanoparticles. The
UV-visible light emission peak at 342 nm of SnO2 are related
to the defect levels within the band gap such as O vacancies and Sn interstitial sites form during the particle growth. The emission peak at 362 nm generally ascribed to the band-to-acceptor transition and related to impurity or defect concentration. The peak at 402 nm can be attributed to structural defect, such as nanocrystals and defects in SnO2
nanoparticles and the emission peak at 502 nm is likely originate from oxygen vacancies where its intensity increase with increase concentration of oxygen vacancies. Also, the effect of current on tin oxide nanoparticles, which taken at different current densities, with increasing of current density leads to increase of absorption intensity and decrease of particle size.
Fig. 5. UV-visible spectra of SnO2 Nanopaticles capped with 0.01 M
TPAB (SNTPAB) at 8 (mA/cm2).
TABLEII
ABSORBANCE OF SNTPAB AT 8(mA/cm2)
No. nm Abs
1 402 0.272
2 362 0.415
3 342 0.550
4 300 0.939
Fig. 6. UV-visible spectra of SnO2 Nanopaticles capped with 0.01 M TPAB
(SNTPAB) at 10 (mA/cm2).
TABLEIII
ABSORBANCE OF SNTPAB AT 10(mA/cm2)
No. nm Abs
1 402 0.480
2 362 0.678
3 342 0.861
4 298 1.485
Fig. 7. UV-visible spectra of SnO2 Nanopaticles capped with 0.01 M TPAB
(SNTPAB) at 12 (mA/cm2).
TABLEIV
ABSORBANCE OF SNTPAB AT 12(mA/cm2)
No. nm Abs
1 402 0.362
2 362 0.487
3 342 0.672
4 292 1.417
0 3
1 2
200 400 600 800
A
b
s
Wavelength [nm]
0 3
1 2
200 400 600 800
A
b
s
Wavelength [nm]
0 1.5
0.5 1
290 400 500 600 700 750
A
b
s
Fig. 8. UV-visible spectra of SnO2 Nanopaticles capped with 0.01 M TBAB
(SNTBAB) at 8 (mA/cm2).
TABLEV
ABSORBANCE OF SNTBAB AT 8(mA/cm2)
No. nm Abs
1 402 0.483
2 362 0.724
3 342 0.902
4 300 2.042
Fig. 9. UV-visible spectra of SnO2 Nanopaticles capped with 0.01 M TBAB
(SNTBAB) at 10 (mA/cm2).
TABLEVI
ABSORBANCE OF SNTBAB AT 10(mA/cm2)
No. nm Abs
1 502 0.042
2 402 0.112
3 362 0.146
4 342 0.159
5 298 0.560
E. Calculation of SnO2 Nanoparticle size from UV-Visible Spectra
An absorption spectrum as shown in Figs. 5, 6, 7, 8, 9 and 10 can be obtained. The absorption peak appears at around 300 nm, 298 nm and 292 nm for different mA by using TPAB and TBAB salts. Using the excitation peak position (300, 298 and 292 nm) can be determined the band gap (E=hc/λ) of them, which are calculated (4.13, 4.16 and 4.24 ev). This can
be calculated as the size of the nanoparticle, as given the following relation.
𝑅 = √ 2𝜋2ℎ2𝐸𝑏𝑢𝑙𝑘
𝑚∗(𝐸2𝑛𝑎𝑛𝑜− 𝐸2𝑏𝑢𝑙𝑘) (1)
Where R is the radius of the quantum size particles i.e. nanoparticles, tin dioxide has bulk band gap energy Eg of 3.6 eV and the effective reduced mass µ may be replaced by the electron effective mass (me* = 0.277m0). These values have been used for calculating the average size of excitation peaks at different current density, which are determined as (2.19, 2.13 and 1.98 nm). When the particle size decreases, the band gap increases. It can be concluded that the synthesis particles are nanoparticles, as shown in table VIII.
Fig. 10. UV-visible spectra of SnO2 Nanopaticles capped with 0.01 M
TBAB (SNTBAB) at 12 (mA/cm2).
TABLEVII
ABSORBANCE OF SNTBAB AT 12(mA/cm2)
No. nm Abs
1 506 0.378
2 402 0.736
3 362 1.235
4 5 6
342 310 292
1.652 2.778 2.807
TABLEVIII
VARIATION OF AVERAGE PARTICLE SIZE OF SNO2NANOPARTICLES AND
BAND GAP WITH CURRENT DENSITY AT DIFFERENT (mA/cm2
)
Current density (mA/cm2)
λmax (nm) Band gap (ev) Particle size
(nm)
8 300 4.13 2.19
10 298 4.16 2.13
12 292 4.24 1.98
IV. CONCLUSION
Nanoparticles of SnO2 have been successfully synthesized
through electrochemical reduction method successfully for
0 3
1 2
290 400 500 600 700 750
A
b
s
Wavelength [nm]
0 2.5
1 2
290 400 500 600 700 750
A
b
s
Wavelength [nm]
0 1
0.2 0.4 0.6 0.8
290 400 500 600 700 750
A
b
s
synthesis of SnO2 nanoparticles. The TPAB and TBAB salts
are used as surfactant or capping agent have played significant role on controlling the particle size and serves as stabilizers for the metal clusters. Agglomeration and formation of undesired metal are prevented by presence ammonium stabilizers, also acetonitrile/tetrahydrofuran used as supporting electrolyte. Cluster size was found to decrease with an increase in current density. UV-visible spectroscopy shows that by increasing current density the absorption intensity increases, particle size decreases and band gap energy increases. The FTIR transmission of SnO2, n-type
semiconductor, is sharply decreasing by electron absorption and the quality of vibrational information concerning the surface species, which depends strongly on the nature of the parameters. SEM confirms that the particles are in nano size and appearances of some particles are in irregular and block shapes. EDS confirms the total ratio of tin oxide nanoparticles and their chemical composition.
ACKNOWLEDGMENT
The author expresses immense thanks to Dr. A.S. Rajbhoj, professor of department of chemistry and physical chemistry staff and Dr. Babasaheb Ambedkar Marathwada University, Aurangabad, Maharashtra-India, for their valuable suggestions and assistances.
REFERENCES
Kim, T.W., Lee, D.U., Choo, D.C., Kim, J. H., Kim, H. J., Jeong, J. H., Jung, M., Bahang, J.H., Park, H.L., Yoon, Y.S. and Kim, J.Y., 2002. Optical parameters
in SnO2 nanocrystalline textured films grown on p-lnSb (111) substrates, J. Phys. Chem. Solids, 63, pp.881-885.
Moustafid, T.E., Cachet, H., Tribollet, B., and Festy, D., 2002. Modified transparent SnO2 electrodes as efficient and stable cathodes for oxygen reduction, Electrochimica Acta, 47(8), pp.1209–1215.
Okuya, M., Kaneko, S., Hiroshima, K., Yaggi, I. and Murakami, K., 2001. Low Temperature Deposition of SnO2 Thin Films as Transparent Electrodes by Spray Pyrolysis of Tetra-n-butyltin(IV), J. Eur. Ceram. Soc., 21, pp.2099-2102.
Chen, F.L. and Liu, M.L., 1999. Preparation of mesoporous tin oxide for electrochemical applications, Chem. Commun., 8, 1829-1830.
Kim, C., Noh, M., Choi, M., Cho, J. and Park, B., 2005. Critical size of a nano SnO2 electrode for Li-secondary battery. Chem Mater, 17(12), pp.3297–3301.
Chou, L., Cai, Y., Zhang, B., Niu, J., Ji, S. and Li, S., 2003. Influence of SnO2-doped W-Mn/SiO2 for oxidative conversion of methane to high hydrocarbons at elevated pressure, Appl. Catal. A Gen., 238, pp.185-191.
Wierzchowski, P.T. and Zatorski, L. W., 2003. Kinetics of catalytic oxidation of carbon monoxide and methane combustion over alumina supported Ga2O3, SnO2 or V2O5, Appl. Catal. B Environ., 44, pp.53-65.
Moulson, A. J. and Herbert, J.M. 1990. Electroceramics, Chapman & Hall, New York.
Li, G.J., Zhang, X.H. and Kawi, S., 1999. Relationships between sensitivity, catalytic activity and surface areas of SnO2 gas sensors. Sens. Actuators B, 60, pp.64-70.
Sharp, S.L., Kumar, G., Vicenzi, E.P. and Bocarsly, A.B., 1998. Formation and Structure of a Tin-Iron Oxide Solid-State with Petential Applications in Carbon Monoxide Sensing through the Use of Cyanogel Chemistry. Chemistry of Materials, 10, pp.880-885.
Farrukh, M.A. and Heng, B.-T. and Adnan, R., 2010., Surfactant-controlled aqueous synthesis of SnO2 nanoparticles via the hydrothermal and