Research on Bank Performance In Relation To Bank-Specific and
Macro Variables
Mahrukh Sultan
1, Naukhaiz Chaudhary
1, Rushfa Riaz
1, Kiran Riaz
11
Department of Management Science, University of Central Punjab.
1.
Introduction
Considering the current competitive world of business, banking sector plays a vital role in the economic development of the countries. A strong and healthy banking sector is an indicator of better economic health of the country. Same as any other commercial organization, bank have no different objective of profit and wealth maximization by acting as a middle agent between borrowers and lenders. Loans and advances are decisive for asset holding and contribute a major share of operating revenue. Banking sector performance and profitability is also interrelated with financial markets as Sharma and Mani (2012) reported that the banking sector development have an impact on the financial markets and vice versa.
Banking sector in Pakistan is growing with a rapid speed and after the financial crises struck the world it is quite vital to further investigate market-specific variables as determinants of bank performance (Sultan, Ali, & Saeed, 2013). This study aims to investigate the determinant of bank profitability in Pakistan. The study has been extended to include the bank-specific variable as well as the macro-economic variables in order to check their impact on the bank profitability.
2.
Literature
The extensive literature on the subject area is an evidence of its importance. Many researchers have tried to investigate different factors as indicator and determinant of the banking sector performance and profitability of the country. Ali, Akhtar, and Ahmed (2011)has reported positive affect of bank-specific variables like size, efficiency, asset management and portfolio composition on bank profitability but a negative effect on capital and credit risk while investigating 22 banks of Pakistan for a period of 2006-2009.
Another research,for Saudi and Jordanian banks on a data set of 2005-2011, posits a positive relationship of profitability of banks with internal factor for Saudi banks while the result is found to be negative for Jordanian banks (Almazari, 2014). His conclusions reveal that there is a difference in determinants of bank profitability between Saudi Arabian and Jordanian market.
Considering, liquidity risk and credit risk as a determinant of bank performance and profitability, Imbierowicz and Rauch (2014) conducted a research for the data set from 1988-2010. They used liquidity proxy variables and concluded that LR and CR have direct relationship. Our result shows that both risk types do not have an economically significant reciprocal simultaneous or time-lagged relationship.
Banking industry crises in the past few decades remained a topic of interest for the researchers. In the same scenario, banking industry of Switzerland have been targeted for the crises period from 2006-2010 and by applying the GMM model, the study concluded that higher average loan growth has a positive effect on bank profitability while the high funding cost has a reverse effect (Dietrich & Wanzenried, 2011).
Another research in the same area is conducted by Kolapo, Ayeni, and Oke (2012) as the examined the credit risk with respect to profitability of the banks in Nigerian market. The study was designedto examine the bank’s profitability determinants with a data for 11 years starting from 2000-12 and found that there is a
Abstract:Banking industry remains a topic of interest as it contributes to the overall economy of any country.
This study has been conducted to check the impact of bank-specific and macro level variables on the bank profitability. We use sample of Pakistani Banks listed in Pakistan Stock Exchange for the Period of 2007 to 2013 with 161 observations. In our study we take comparison between 3 models i.e. Pooled Effect model, Fixed Effect Model and Random Effect Model and also take three dependent variables. Result concluded that internal factors have significant impact on profitability of bank, however, the study fails to find such significant relationship between macro level indicators and bank profitability in Pakistani environment.significant and positive impact on the profitability of Banks in Nigeria with a proposal to enhance the administration and capacity in credit analysis. Later, the same positive and significant relationship is described by Kurawa and Garba (2014) between credit risk management and bank profitability.Afiriyie and Akotey (2013) also posit the same while explaining the credit risk management with respect to rural bank’s profitability in Ghana with a concluding remarks that the rural banks extend the loan facility on higher rate of interest due to which the loans are converted into NPLs.
The study conducted by Louzis, Vouldis, and Metaxas (2012) has further explored the subject by including macro-economic variables in relation to bank profitability and explicitly defining non-performing loans as determinant of bank profitability. They posit that the mortgage loans have lowest NPLs which means the loans and advances against better collateral are better. Furthermore, they express a significant effect of macro-economic variables on the level of Non-Performing loans. The banking industry is majorly relying on the loans and advance for its assets in balance sheet which contribute to its profitability. Therefore, a high rate of NPL will result in poor performance of the banks.
3.
Methodology
This section of the paper illustrate the methodology adoption for the research in order to achieve our research objectives.
3.1 Data
In order to achieve our objectives of the study we have collected a data of 23 commercial bank in Pakistan from their official websites. Total number of banks listed in Pakistan Stock Exchange PSE are 26 and the rest of the banks are dropped from our sample as their data was unavailable for the study period. The data is gathered from their published annual reports as per law of SECP.
3.1.1 Dependent Variables
Return on Assets:Return on Assets is mainly operational efficiency indicator as it explains the management quality of the banks with respect to bank’s assets and net profit. The mathematical formula to calculate ROA is as follow:
𝑅𝑂𝐴 = 𝑁𝑒𝑡 𝐼𝑛𝑐𝑜𝑚𝑒/𝐴𝑣𝑒𝑟𝑎𝑔𝑒_𝑇𝑜𝑡𝑎𝑙_𝐴𝑠𝑠𝑒𝑡𝑠 (1)
The above stated definition is quite common and widely used by the researchers (Erina & Lace, 2013).
Return on Equity:Another most common proxy used to evaluate the performance and profitability of the commercial organization is Return on Equity (ROE). As the banks are not different from conventional profit maximization firms so the same performance indicators are used by researchers to investigate different research questions.
ROE is ratio of bank’s net income to its shareholder’s equity and determines whether the employed share capital is generating good income for the firm or not. The mathematic calculation is described in equation (2) which is consistent with Erina and Lace (2013).
𝑅𝑂𝐸 = 𝑁𝑒𝑡 𝐼𝑛𝑐𝑜𝑚𝑒/𝑆𝑎𝑟𝑒𝑜𝑙𝑑𝑒𝑟′𝑠_𝐸𝑞𝑢𝑖𝑡𝑦 (2)
Net Profit Margin:The next measure taken to evaluate the bank’s performance is Net Profit Margin (NIM). NIM is the ratio between net income and markup income of the bank and express the way of earning with the explanation of segregation between markup income and net income. We have used the same definition to calculate this variable for our study as used by Francis (2013). The mathematical form is given in equation number (3).
𝑁𝐼𝑀 = 𝑁𝑒𝑡 𝐼𝑛𝑐𝑜𝑚𝑒/𝑀𝑎𝑟𝑘𝑢𝑝_𝐼𝑛𝑐𝑜𝑚𝑒 (3)
3.1.2 Independent Variables
method for Liquidity of the firm as explained by Almazari (2014), Ogboi and Unuafe (2013), Kurawa and Garba (2014) and Kolapo et al. (2012). Equation form of the calculations is as follow:
𝐿𝑖𝑞𝑢𝑖𝑑𝑖𝑡𝑦 = 𝐿𝑖𝑞𝑢𝑖𝑑_𝐴𝑠𝑠𝑒𝑡𝑠 /𝐷𝑒𝑝𝑜𝑠𝑖𝑡𝑠 + 𝐵𝑜𝑟𝑟𝑜𝑤𝑖𝑛𝑔𝑠 (4)
Credit Risk:The other independent variable taken for research is credit risk of the banking firm. This indicates that how risky is the given loans & advances. As loans & advances are quite vital in generating the profits for the banking industry so this ratio is worth to add in the model while explaining the profitability and performance of the bank. The following method is adopted to calculate the ratio:
𝐶𝑟𝑒𝑑𝑖𝑡 𝑅𝑖𝑠𝑘 = 𝑃𝑟𝑜𝑣𝑖𝑠𝑖𝑜𝑛_𝐴𝑔𝑎𝑖𝑛𝑠𝑡_𝐿𝑜𝑎𝑛𝑠&𝐴𝑑𝑣𝑎𝑛𝑐𝑒𝑠/𝐼𝑛𝑡𝑒𝑟𝑒𝑠𝑡_𝐼𝑛𝑐𝑜𝑚𝑒 (5) The above stated definition and calculation for the said variable is consistent with Imbierowicz and Rauch (2014), Kolapo et al. (2012), Francis (2013) and (Sufian & Chong, 2008).
Capital Strength:It is evident that well capitalized firms are better position to generate more profitability. The researcher in past have used Capital strength as a determinant of firm performance(Ali et al., 2011; Dietrich & Wanzenried, 2011; Mashharawi & Al-Zu’bi, 2010; Muda, Shaharuddin, & Embaya, 2013; Ramadan, Kilani, & Kaddumi, 2011) which enlighten the importance of this variable to be included in our model of study as we are targeting the same question of performance indicators.We have used the same calculation method as of above stated authors which is as follows:
𝐶𝑎𝑝𝑖𝑡𝑎𝑙 𝑆𝑡𝑟𝑒𝑛𝑔𝑡 = 𝐸𝑞𝑢𝑖𝑡𝑦/𝑇𝑜𝑡𝑎𝑙_𝐴𝑠𝑠𝑒𝑡𝑠 (6)
GDP Growth:This research is aimed to include both bank-specific and macro-economic variables as determinants of bank performance therefore, we include our first variable as GDP Growth. GDP defines the financial stability of the country and if include its growth rate then we can explain how a country is growing financially. It is an indicator of the countries productivity and consumption and calculated on annual basis. Before this study, same variable is used by Louzis et al. (2012), Sharma and Mani (2012) and Mashharawi and Al-Zu’bi (2010) while explaining its effect on the performance of banking industry of respective countries. The definition brings us to the following mathematical form of calculation:
𝐺𝐷𝑃 = 𝐶 + 𝐺 + 𝐼 + 𝑁𝑋 (7)
Inflation:Inflation rate of any country is an indication of rate of change in the level of prices of services and goods in that particular country over the year. If the inflation rate is high then the purchasing power of the country population will decrease which is an economically proven fact. Government of the country always remains focused in order to maintain a balance in such ratio to stable the economy with the help of monitory policies. Inflation also effect the actual performance and profitability of the firms commencing their businesses in respective countries therefore, the banks are also affected with the change in inflation rate of the country. This variable is included in the research in order to examine its impact on the performance of the banks in Pakistan. Interest Rate:Interest rate is defined as the interest charges on borrowed money from lender on principal amount. Interest rate is usually calculated based on annual, semi-annual or quarter basis. There are two forms of interest rate calculation. One is the simple interest rate while the other is compound interest rate and the formulae for both are given below:
𝑆𝑖𝑚𝑝𝑙𝑒 𝐼𝑛𝑡𝑒𝑟𝑒𝑠𝑡 = 𝑃 𝑃𝑟𝑖𝑛𝑐𝑖𝑝𝑎𝑙 𝑎𝑚𝑜𝑢𝑛𝑡 × 𝐼 𝑎𝑛𝑛𝑢𝑎𝑙 𝑖𝑛𝑡𝑒𝑟𝑒𝑠𝑡 𝑟𝑎𝑡𝑒 × 𝑁 (𝑁𝑜. 𝑜𝑓 𝑌𝑒𝑎𝑟𝑠)
(7)
𝐶𝑜𝑚𝑝𝑜𝑢𝑛𝑑 𝐼𝑛𝑡𝑒𝑟𝑒𝑠𝑡 = 𝑃 𝑃𝑟𝑖𝑛𝑐𝑖𝑝𝑎𝑙 𝑎𝑚𝑜𝑢𝑛𝑡 × [ 1 + 𝐼 𝑎𝑛𝑛𝑢𝑎𝑙 𝑖𝑛𝑡𝑒𝑟𝑒𝑠𝑡 𝑟𝑎𝑡𝑒 𝑁 𝑚𝑜𝑛𝑡𝑠 − 1]
(8) 3.2 Theoretical Framework
Theoretical Framework
Interest Rate
Dependent
Variables
Independent
Variables
Credit Risk
Capital Strength
Liquidity
GDP Growth
Rate
Inflation
Return on Assets
Return on equity
3.2.1 Pooled Regression Model
Pooled regression model is typically used for time series and cross sectional data. This approach is normally used when group data to be pooled are comparatively similar or homogenous.
3.2.2 Fixed Effect Model
This model basically measuresthe differences in intercepts for each group. The approach is also called "Least Squares Dummy Variable" method for this purpose. This is actually an OLS model with dummy variables to control forconstant variance across groups,assuming coefficients, group differences, andfor independent variables.
3.2.3 Random Effect Model
This method influences the differences in the variances of error term to model groups together.
3.2.4 Design of Empirical Model
𝑅𝑂𝐴𝑖𝑡 = 𝛼 𝑖𝑡 + 𝛽1𝐶𝑅𝑖𝑡 + 𝛽2𝐶𝑆𝑖𝑡 + 𝛽3𝐺𝐷𝑃𝐺𝑅𝑖𝑡 + 𝛽4𝐼𝑁𝐹𝑖𝑡 + 𝛽5𝐼𝑅𝑖𝑡 + 𝛽6𝐿𝐼𝑄𝑖𝑡 + 𝑒𝑖𝑡
𝑅𝑂𝐸𝑖𝑡 = 𝛼 𝑖𝑡 + 𝛽1𝐶𝑅𝑖𝑡 + 𝛽2𝐶𝑆𝑖𝑡 + 𝛽3𝐺𝐷𝑃𝐺𝑅𝑖𝑡 + 𝛽4𝐼𝑁𝐹𝑖𝑡 + 𝛽5𝐼𝑅𝑖𝑡 + 𝛽6𝐿𝐼𝑄𝑖𝑡 + 𝑒𝑖𝑡
𝑁𝐼𝑀𝑖𝑡 = 𝛼 𝑖𝑡 + 𝛽1𝐶𝑅𝑖𝑡 + 𝛽2𝐶𝑆𝑖𝑡 + 𝛽3𝐺𝐷𝑃𝐺𝑅𝑖𝑡 + 𝛽4𝐼𝑁𝐹𝑖𝑡 + 𝛽5𝐼𝑅𝑖𝑡 + 𝛽6𝐿𝐼𝑄𝑖𝑡 + 𝑒𝑖𝑡
Where i= the no. of banks and period t= 2007, 2008,………, 2013. e = residual error.
4.
Result and Discussions
In this chapter we discuss result and discussion ofDescriptive Statistics, and comparison between regression models and also Hausman test results. Hausman (1978) Test applies on data which is used to check that fixed and random effect model is appropriate or not for our data.
4.1 Descriptive Statistics
Descriptive statistics gives a useful summary of security returns when performing analytical analysis and empirical analysis, as they provide a historical account of return behavior. Although past information is
beneficial in any analysis, one should always consider the expectations of future events.
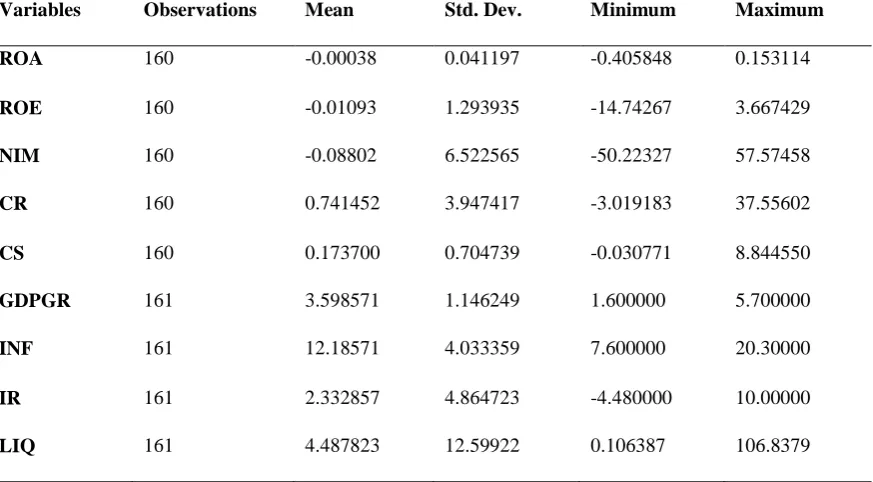
Table I Descriptive Statistics
Variables Observations Mean Std. Dev. Minimum Maximum
ROA 160 -0.00038 0.041197 -0.405848 0.153114
ROE 160 -0.01093 1.293935 -14.74267 3.667429
NIM 160 -0.08802 6.522565 -50.22327 57.57458
CR 160 0.741452 3.947417 -3.019183 37.55602
CS 160 0.173700 0.704739 -0.030771 8.844550
GDPGR 161 3.598571 1.146249 1.600000 5.700000
INF 161 12.18571 4.033359 7.600000 20.30000
IR 161 2.332857 4.864723 -4.480000 10.00000
The table gives result in an average ratio of 12.33 with standard deviation 12.59. After excluding the outlier min value is -50.22 and max value is 57.57.As Table 1 indicates that liquidity and net interest margin present higher standard deviation with 12.59 and 6.52 respectively as compare to other variables, which shows that these two variables have more significant variance instead of other variables.
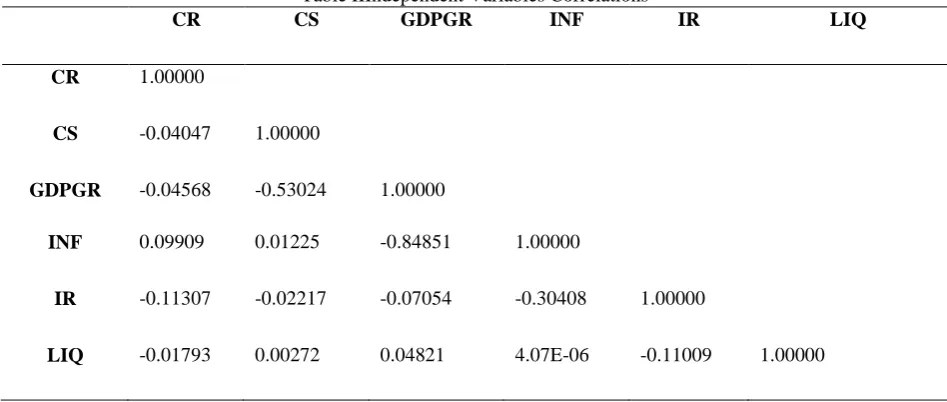
4.2 Independent Variables Correlations
Correlation is a measure of relationship among two variables. With correlation we indicates that either relationship is positive or negative and also check it out that relationship is significant or insignificant.
Result indicates that credit risk has positive relationship with inflation rate and negative with others, it has significant as well as strong relationship with capital strength, GDP growth rate, liquidity and hardly with inflation and insignificant with others.
Table IIIndependent Variables Correlations
CR CS GDPGR INF IR LIQ
CR 1.00000
CS -0.04047 1.00000
GDPGR -0.04568 -0.53024 1.00000
INF 0.09909 0.01225 -0.84851 1.00000
IR -0.11307 -0.02217 -0.07054 -0.30408 1.00000
LIQ -0.01793 0.00272 0.04821 4.07E-06 -0.11009 1.00000
Capital Strength has positive but weak relationship with inflation and liquidity & negative with others, it has significant as well as strong relationship with inflation, liquidity and interest rate and insignificant with others.
There is a positively significant and also strong relationship among GDP growth rate and liquidity and negatively insignificant as well as week association with others. Inflation rate has negative and insignificant relationship with interest rate and positive insignificant with remaining variables. Interest rate has negative and insignificant relationship with liquidity.
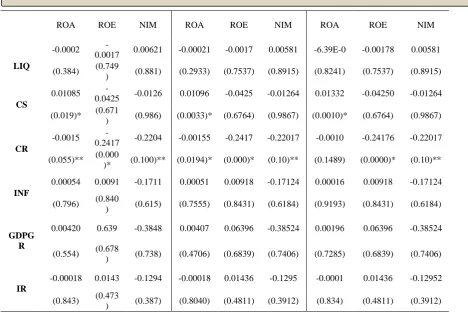
4.3 Regression Models Comparison
By applying Pooled Regression Model with ROA only capital strength has positive and significant relationship at 5 % and also only credit risk has negative and significantrelationship at 10%. These two independent variables have week impact on ROA. Others have insignificant relationship with ROA. With ROE and NIM only 1 variable (CR) has negatively significant relationship at 5 % (0.05) and others have insignificant some have positive and some have negative relationship among them.
Pool Regression Model Random Effect Model Fixed Effect Model
TableIIIRegression Models Comparison
*, **Indicate significance level at 5 %, & 10 % respectively. In parenthesis are the prob. Value.
From overall findings through Pooled Effect model we have been concluded that Credit Risk has significant impact on Banks Profitability and with ROA only Capital Strength has negative but significant relationship.
By using Random effect Model we find that with ROA, has positive and negative but significant relationship with capital strength and credit risk respectively. And with remaining variables some have positive and some have negative relationship. With ROE and NIM credit risk has negative but significant relationship.
By Implementing Fixed effect Model result indicate that, With ROA as only credit risk has positive and significant relationship which shows that it has strong impact on banks profitability.
4.4 Hausman (1987) Test Comparison
It tells us either fixed effect model is best or appropriate or random effect model is best. We can find through probability value if probability value is less than 0.05 then we select fixed effect model and reject random effect model and vice versa.
Table IVHausman test comparison
Ind. Var. ROA ROE NIM
CR
-0.001049 -0.246519 -0.214183
(0.1489) (0.0000)*** (0.1528)
CS
0.013323 -0.033529 -0.010926
(0.0010)*** (0.7611) (0.9893)
ROA ROE NIM ROA ROE NIM ROA ROE NIM
LIQ
-0.0002
-0.0017 0.00621 -0.00021 -0.0017 0.00581 -6.39E-0 -0.00178 0.00581
(0.384) (0.749
) (0.881) (0.2933) (0.7537) (0.8915) (0.8241) (0.7537) (0.8915)
CS
0.01085
-0.0425 -0.0126 0.01096 -0.0425 -0.01264 0.01332 -0.04250 -0.01264
(0.019)* (0.671
) (0.986) (0.0033)* (0.6764) (0.9867) (0.0010)* (0.6764) (0.9867)
CR
-0.0015
-0.2417 -0.2204 -0.00155 -0.2417 -0.22017 -0.0010 -0.24176 -0.22017
(0.055)** (0.000
)* (0.100)** (0.0194)* (0.000)* (0.10)** (0.1489) (0.0000)* (0.10)**
INF
0.00054 0.0091 -0.1711 0.00051 0.00918 -0.17124 0.00016 0.00918 -0.17124
(0.796) (0.840
) (0.615) (0.7555) (0.8431) (0.6184) (0.9193) (0.8431) (0.6184)
GDPG R
0.00420 0.639 -0.3848 0.00407 0.06396 -0.38524 0.00196 0.06396 -0.38524
(0.554) (0.678
) (0.738) (0.4706) (0.6839) (0.7406) (0.7285) (0.6839) (0.7406)
IR
-0.00018 0.0143 -0.1294 -0.00018 0.01436 -0.1295 -0.0001 0.01436 -0.12952
(0.843) (0.473
LIQ
-6.39E-05 0.0000653 -0.009313
(0.8241) (0.9349) (0.8752)
IR
-0.000152 0.014595 -0.133617
(0.8364) (0.4758) (0.3784)
INF
0.000169 0.008668 -0.173480
(0.9193) (0.8520) (0.6144)
GDPGR
0.001964 0.056664 -0.390436
(0.7285) (0.7189) (0.7378)
*, ** Indicate significance level at 5 %, & 10 % respectively. In parenthesis are the prob. Value.
Hausman test concluded that capital strength has positive and significant association with ROA and remaining variables have insignificant relationship. Credit risk has negative but significant association among ROE and others have insignificant relationship with ROE and also with NIM.
5.
Conclusion
Banking sector plays a vital role in the development of economy in every country. Profitability of commercial banks is basis for diversification, product innovation and efficiency of the commercial banks(Hempell, 2002). Many researchers have studied this subject in the past (Sultan et al., 2013; Sultan, Javed, Bhutta, & Qing, 2016). The objective of this study is to identify which factors have impact on Banks profitability.The necessary data is collected from secondary source.Demirgüç-Kunt and Huizinga (2000)studied on bank profitability and summarized that internal and external determinants effect on banks profitability. In internal factors liquidity, credit risk, and capital strength included, on the other hand in external factors or determinants GDP growth rate, inflation and interest rate included. Result concluded that internal factors have large proportion on profitability of bank; however external factors have also an impact on the performance. We use sample of 23 Pakistani Banks listed in KSE for the Period of 2007 to 2013 with 161 observations. In our study we take comparison between 3 models i.e. Pooled Effect model, Fixed Effect Model and Random Effect Model and also take three dependent variables. The empirical results on the effect of banks profitability in Pakistan in our sample submit the following conclusions. From comparison between three models, we concluded that capital strength has positive and significant relationship with ROA only in all Models. And has negative and insignificant association with ROE and NIM in all Models which are applied in this study. Credit risk has negative association with ROA and NIM it has significant in pooled Effect Model.
In Random effect Model credit risk has negative and significant relationship with ROA, ROE and NIM. In Fixed Effect Model credit risk has insignificant association with ROA and significant with ROE and NIM.
We concluded from this study that bank specific factors i.e. credit risk and capital strength has impact on bank’s profitability and other variables have not impact on bank’s profitability.
5.1 Policy Implication
Investors, Government, policy maker and shareholder’s used this study to examine the banks specific and macro-economic factors impact on bank’s profitability or not.
5.2 Future Directions
6.
References
[1]. Afiriyie, H., & Akotey, D. (2013). credit risk management and profitability of rural banks in the brong Ahafa region of Ghana. European journal of business and management, 5.
[2]. Ali, K., Akhtar, M. F., & Ahmed, H. Z. (2011). Bank-specific and macroeconomic indicators of profitability-empirical evidence from the commercial banks of Pakistan. International Journal of Business and Social Science, 2(6), 235-242.
[3]. Almazari, A. A. (2014). Impact of internal factors on bank profitability: Comparative study between Saudi Arabia and Jordan. Journal of Applied Finance and banking, 4(1), 125.
[4]. Demirgüç-Kunt, A., & Huizinga, H. (2000). Financial structure and bank profitability.
[5]. Dietrich, A., & Wanzenried, G. (2011). Determinants of bank profitability before and during the crisis: Evidence from Switzerland. Journal of international financial Markets, Institutions and Money, 21(3), 307-327.
[6]. Erina, J., & Lace, N. (2013). Commercial banks profitability indicators: empirical evidence from Latvia. IBIMA Business Review, 2013, 1.
[7]. Francis, M. E. (2013). Determinants of commercial bank profitability in Sub-Saharan Africa.
International Journal of Economics and Finance, 5(9), 134.
[8]. Hempell, H. S. (2002). Testing for competition among German banks.
[9]. Imbierowicz, B., & Rauch, C. (2014). The relationship between liquidity risk and credit risk in banks.
Journal of Banking & Finance, 40, 242-256.
[10]. Kolapo, T. F., Ayeni, R. K., & Oke, M. O. (2012). CREDIT RISK AND COMMERCIAL
BANKS'PERFORMANCE IN NIGERIA: A PANEL MODEL APPROACH. Australian Journal of
Business and Management Research, 2(2), 31.
[11]. Kurawa, J. M., & Garba, S. (2014). An evaluation of the effect of credit risk management (CRM) on
the profitability of Nigerian banks. Journal of Modern Accounting and Auditing, 10(1), 104.
[12]. Louzis, D. P., Vouldis, A. T., & Metaxas, V. L. (2012). Macroeconomic and bank-specific determinants of non-performing loans in Greece: A comparative study of mortgage, business and consumer loan portfolios. Journal of Banking & Finance, 36(4), 1012-1027.
[13]. Mashharawi, F. Y., & Al-Zu’bi, K. A. (2010). The Determinants of Bank’s Profitability: Evidence from the Jordanian Banking Sector (1992–2006). Jordan Journal of Business Administration, 5(3). [14]. Muda, M., Shaharuddin, A., & Embaya, A. (2013). Profitability Determinants and the Impact of Global
Financial Crisis: A Panel Data Analysis of Malaysian Islamic Banks. Research Journal of Finance and
Accounting, 4(7), 121-130.
[15]. Ogboi, C., & Unuafe, O. K. (2013). Impact of credit risk management and capital adequacy on the financial performance of commercial banks in Nigeria. Journal of Emerging Issues in Economics, Finance and Banking, 2(3), 703-717.
[16]. Ramadan, I. Z., Kilani, Q. A., & Kaddumi, T. A. (2011). DETERMINANTS OF BANK
PROFITABILITY: EVIDANCE FROM JORDAN. International Journal of Academic Research, 3(4).
[17]. Sharma, E., & Mani, M. (2012). Impact of Macroeconomic and Financial Market Indicators on the Banking Sector: Some Evidence from India. International Journal of Research in Finance & Marketing, 2(2), 171-185.
[18]. Sufian, F., & Chong, R. R. (2008). Determinants of bank profitability in a developing economy: empirical evidence from the Philippines. Asian academy of management journal of accounting and finance, 4(2), 91-112.
[19]. Sultan, J., Ali, A., & Saeed, A. (2013). A Comparison of Technical Efficiency of Performance of Different Banks Before and After Merger: A Study of Pakistan Banking Industry. Journal of Economics and Sustainable Development, 4(9), 113-126.