Angiogenic factors during pregnancy in
Asian women with elevated blood
pressure in early pregnancy and the risk
of preeclampsia: a longitudinal
cohort study
Jing Zhu,1 Jun Zhang ,1,2 Mor Jack Ng,2 Bernard Chern,2 George SH Yeo,3
Kok Hian Tan2
To cite: Zhu J, Zhang J, Ng MJ, et al. Angiogenic factors during pregnancy in Asian women with elevated blood pressure in early pregnancy and the risk of preeclampsia: a longitudinal cohort study. BMJ Open 2019;9:e032237. doi:10.1136/ bmjopen-2019-032237
►Prepublication history and additional material for this paper are available online. To view these files, please visit the journal online ().
Received 09 June 2019 Revised 04 November 2019 Accepted 07 November 2019
1MOE- Shanghai Key Laboratory of Children's Environmental Health, Xinhua Hospital, Shanghai Jiao Tong University School of Medicine, Shanghai, China
2Division of Obstetrics and Gynaecology, KK Women's and Children's Hospital, Singapore, Singapore
3Department of Maternal and Fetal Medicine, KK Women's and Children's Hospital, Singapore, Singapore
Correspondence to
Dr Jun Zhang; junjimzhang@ sina. com © Author(s) (or their employer(s)) 2019. Re- use permitted under CC BY- NC. No commercial re- use. See rights and permissions. Published by BMJ.
Strengths and limitations of this study
► This study was based on a well- performed prospec-tive cohort with comprehensive information on clini-cal, biophysical and biochemical markers.
► Covariance analysis was performed to compare differences of angiogenic factors values among groups; multivariable logistic regression analysis was performed to evaluate the association between early pregnancy blood pressure and pregnancy outcomes.
► Given that most of our participants were low- risk pregnant women, our results may not be applicable to high- risk women.
AbStrACt
Objective It remains unclear what roles placenta-
originated angiogenic factors play in the pathogenesis of preeclampsia among hypertensive women. We compared maternal soluble fms- like tyrosine kinase 1 (sFlt-1) and placental growth factor (PlGF) levels throughout pregnancy in women with normal blood pressure (BP), elevated BP and hypertension in early pregnancy and their risks of developing preeclampsia.
Design A prospective cohort study.
Setting KK Women’s and Children’s Hospital, Singapore.
Participants 923 women with singleton pregnancy <14
weeks of gestation were included in the prospective Neonatal and Obstetrics Risks Assessment cohort between September 2010 and October 2014. Systolic, diastolic, mean arterial blood pressure (MAP) were measured at 11–14 weeks.
Primary and secondary outcomes Maternal serum
sFlt-1, PlGF and sFlt-1/PlGF ratio were tested at 11–14, 18–22, 28–32 and 34 weeks onwards of gestation. Preeclampsia was main pregnancy outcome.
results Women were divided based on their BP in early
pregnancy: normal (n=750), elevated BP (n=98) and hypertension (n=75). Maternal sFlt-1 levels and sFlt-1/ PlGF ratios were higher in hypertensive women throughout pregnancy, but maternal PlGF levels were not significantly lower. Rise in maternal systolic, diastolic BP and MAP at 11–14 weeks were significantly associated with higher sFlt-1/PlGF ratios during pregnancy. A 10 mm Hg increase in MAP was associated with a 5.6- fold increase in risk of preterm preeclampsia and a 3.3- fold increase in risk of term preeclampsia, respectively.
Conclusion Women with elevated BP in early pregnancy
already had a higher sFlt-1/PlGF ratio in early gestation and throughout pregnancy, and an increased risk of preeclampsia. In contrast, PlGF levels in these women remained normal.
IntrODuCtIOn
The imbalance in placenta- originated
angiogenic factors has been found to play an important role in the pathogenesis of
preeclampsia in recent years. Soluble fms- like tyrosine kinase 1 (sFlt-1) and placental growth factor (PlGF) are the most studied proteins. sFlt-1, a splice variant of the vascular endothelial growth factor (VEGF) receptor Flt-1, is a circulating antiangiogenic protein that inhibits proangiogenic factors—VEGF and PlGF signalling in the vasculature.1
High levels of circulating sFlt-1 and low levels of PlGF were observed in women with established preeclampsia and even before the onset of clinical symptoms.2 3 These
promising findings have been adopted and recommended by the National Institute for Clinical Excellence to rule out preeclampsia in women presenting with clinical suspicion.4
Numerous studies focused on the patho-logical effects of excess sFlt-1 on endothelial function. It was observed that overexpres-sion of sFlt-1 produced a preeclampsia- like syndrome of hypertension, proteinuria and glomerular endotheliosis in experimental animals.5 sFlt-1 is largely produced by
syncy-tiotrophoblast and secreted into maternal circulation.6 Placental hypoxia may be one of
on September 22, 2020 by guest. Protected by copyright.
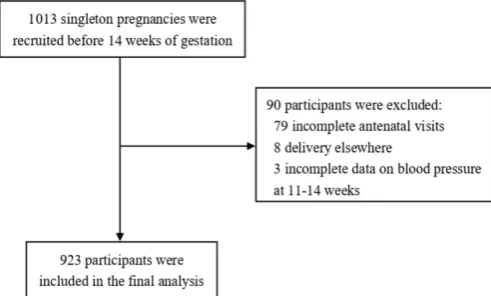
Figure 1 Flowchart of participants.
the main triggers of inducing abundant sFlt-1 expression and leading to hypertensive complications.7 8 However,
this hypothesis may not totally explain why women with elevated blood pressure (BP) before pregnancy have a substantially higher risk of preeclampsia. Besides, evidence suggests that there might be some racial differences in maternal angiogenic and antiangiogenic factors.9 Thus, the objective of this study was to examine
the dynamic changes of angiogenic and antiangiogenic factors throughout pregnancy in Asian women with elevated BP in early gestation and their risks of devel-oping preeclampsia later in pregnancy.
MethODS Study design
The Neonatal and Obstetrics Risks Assessment (NORA) study was a prospective cohort conducted at the KK Women’s and Children’s Hospital in Singapore.10 The
cohort was set up to screen factors associated with adverse perinatal outcomes, with a focus on using clinical, biochemical and biophysical markers to predict the risks of pregnancy complications in early pregnancy. In brief, detailed interviews, ultrasound scans and blood sample collections were performed at recruitment (11–14 weeks), 18–22 weeks, 28–32 weeks and 34 weeks onwards, respec-tively. All four antenatal visits also included measurement of maternal height and weight; recording of BP by vali-dated automated devices according to the recommenda-tions of the American Heart Association.11 Participants
were closely followed up till their postnatal discharge from the hospital. Information on pregnancy complications, labour and delivery and neonatal outcomes was collected through medical chart review. A written informed consent was obtained from all participating women.
Study population
The NORA cohort recruited women with confirmed singleton pregnancies <14 weeks of gestation between September 2010 and October 2014. The exclusion criteria were multiple gestation, severe medical conditions such as chronic renal disease or systemic lupus erythematosus and pregnancies complicated by aneuploidy or fetal
anomaly. Gestational age was confirmed by ultrasound at recruitment. A total of 1013 women were enrolled and 934 of them completed all four antenatal visits. Eight participants were delivered elsewhere, leaving 926 eligible women in the cohort. To evaluate the impacts of maternal BP in early pregnancy on angiogenic factors levels and pregnancy outcomes, we used BP at recruitment (11–14 weeks) to classify women into normal, elevated and hypertension groups. As three women did not have BP records at recruitment (11–14 weeks), we included 923 participants for the final analysis (figure 1).
Diagnosis
Preeclampsia was defined according to the guidelines of International Society for the Study of Hypertension in Pregnancy12: systolic blood pressure (SBP) ≥140 mm Hg
and/or diastolic blood pressure (DBP) ≥90 mm Hg on at least two occasions 4 hours apart after 20 weeks of gesta-tion in a previously normotensive women, and protein-uria: urinary albumin ≥300 mg/24 hours urine collection or ≥1+ dipstick. We used the gestational age at delivery to divide cases of preeclampsia into term (≥37 weeks) and preterm term (<37 weeks). Gestational hypertension was defined as newly onset hypertension after 20 weeks of gestation without proteinuria. Chronic hypertension was defined as women with history of hypertension before conception or the presence of hypertension before 20 weeks of gestation.
To explore the relationship between maternal BP levels in the first trimester and pregnancy outcome, we followed the 2017 guideline from the American College of Cardi-ology and the American Heart Association (ACC/AHA).13
Normal BP was defined as SBP <120 mm Hg and DBP <80 mm Hg; elevated BP was defined as SBP 120–129 mm Hg and DBP <80 mm Hg; hypertension stage 1 as SBP 130–139 mm Hg or DBP 80–89 mm Hg and hypertension stage 2 as SBP ≥140 mm Hg or DBP ≥90 mm Hg.
Measurement of bP
BP was taken by validated automated devices which were calibrated periodically. The women were in the seated position and their arms were supported. A correct cuff size was used and the middle of cuff was positioned on woman’s upper arm at the level of the right atrium. After a 5 min rest, BP was measured by trained nurses and three recordings were made at 1 min intervals. We calculated SBP and DBP as the average of the three measurements. Mean arterial pressure (MAP) was calculated from SBP and DBP measures using the following formula: MAP=DB-P+1/3×(SBP- DBP). BP was modelled continuously in units of 10 mm Hg.
Measurements of angiogenic factors
About 8 mL of maternal venous blood was collected in non- heparinised tubes at each antenatal visit. It was then centrifuged at 2000 rpm for 15 min before separating and storing serum samples at −80℃ for subsequent anal-ysis. Serum levels of sFlt-1 and PlGF were determined by
on September 22, 2020 by guest. Protected by copyright.
Table 1 Characteristics and pregnancy outcomes by maternal blood pressure at 11–14 weeks in the NORA cohort
Variables Normal BP (n=750) Elevated BP (n=98)
Hypertension (stage 1 and
stage 2) (n=75) P value
Maternal age (year), median (IQR)
30.0 (26.0–
34.0) 30.0 (26.0–35.0) 32.0 (29.0–35.0) <0.001
Race, n (%) 0.012
Chinese 393 (52.3) 38 (38.8) 37 (49.3)
Indian 88 (11.7) 6 (6.1) 6 (8.0)
Malay 186 (24.8) 41 (41.8) 23 (30.7)
Others 84 (11.2) 13 (13.3) 9 (12.0)
Parity, n (%) 0.091
0 419 (55.9) 49 (50.0) 33 (44.0)
1 236 (31.5) 32 (32.7) 25 (33.3)
≥2 95 (12.7) 17 (17.3) 17 (22.7)
Maternal education levels, n (%)
0.044
Less than high school
166 (22.2) 28 (28.6) 25 (33.3)
High school 299 (40.0) 44 (44.9) 23 (30.7)
College and
above 282 (37.8) 26 (26.5) 27 (36.0)
Married, n (%) 699 (93.2) 90 (91.8) 72 (96.0) 0.544
Smoking during
pregnancy, n (%) 19 (2.5) 4 (4.1) 0 (0) 0.230
Maternal BMI at 11–14 weeks of gestation
(kg/m2), n (%)
<0.001
<18.5 62 (8.3) 2 (2.0) 0 (0)
18.5–24.9 475 (63.5) 32 (32.7) 16 (21.3)
25.0–29.9 162 (21.7) 35 (35.7) 32 (42.7)
≥30.0 49 (6.6) 29 (29.6) 27 (36.0)
Diabetes
mellitus, n (%) 7 (0.9) 2 (2.0) 5 (6.7) <0.001
ART conception,
n (%) 31 (4.1) 4 (4.1) 2 (2.7) 0.826
Antihypertensive medication, n (%)
0 (0) 0 (0) 3 (4.0) <0.001
Pregnancy outcomes Delivery age
(weeks), median (IQR)
39.0 (38.1–
39.7) 38.7 (38.0–39.6) 38.3 (37.6–39.1) 0.001
Birth weight (kg), median (IQR)
3.1 (2.9–3.4) 3.1 (2.9–3.5) 3.1 (2.8–3.4) 0.324
Gestational hypertension, n (%)
10 (1.3) 3 (3.1) 5 (6.7) 0.004
Preeclampsia,
n (%) 6 (0.8) 3 (3.1) 12 (16.0) <0.001
Preterm preeclampsia, n (%)
4 (0.5) 0 (0) 5 (6.7) <0.001
Term preeclampsia, n (%)
2 (0.3) 3 (3.1) 7 (9.3) <0.001
ART, assisted reproductive technology; BMI, body mass index; BP, blood pressure. means of the fully automated Elecsys assays on an
electro-chemiluminescence immunoassay platform (cobas e411 analyzers, Roche Diagnostics). The detection limit was ~6 pg/mL for sFlt-1 and <2 pg/mL for PlGF.
Statistical analysis
Normality of continuous variables was assessed by the Kolmogorov- Smirnov test. Numeric data were expressed as mean (SD) or as median (IQR) for normally and non- normally distributed data, respectively. Maternal charac-teristics, pregnancy outcomes and maternal BP levels were compared among normal, elevated BP and hypertension (stage 1 and stage 2) groups using one- way ANOVA (Anal-ysis of variance) or Kruskal- Wallis tests for continuous variables and χ2 analysis for categorical variables.
Cova-riance analysis and Dunnett test was used to compare differences of logarithm- transformed angiogenic factors values among groups adjusted for covariants. Geometric means and 95% CIs were calculated by taking the expo-nent of the logarithm transformed mean. Linear regres-sion analysis was performed to assess the association of BP (10 mm Hg) at recruitment with logarithm- transformed angiogenic factors values during pregnancy. Covariance analysis and linear regression models were adjusted for maternal race, smoking during pregnancy, body mass index (BMI) and gestational age at blood collection as covariant. Logistic regression analysis was performed to evaluate the association between early pregnancy BP (10 mm Hg) and pregnancy outcomes with adjustment of potential confounders, including maternal age, race, education, maternal BMI at recruitment, chronic hyper-tension and pre- existing diabetes mellitus. We used SAS V.9.4 for all statistical analyses.
Patient and public involvement
Patients and the public were not directly involved in the design, conduct or reporting in our study.
reSultS
A total of 923 participants in the NORA cohort were included in this analysis. Based on maternal BP at recruitment at 11–14 weeks of gestation, 750 women were classified as normal BP; 98 women as elevated BP, and 75 women as hypertension (stage 1 and stage 2). A comparison of maternal characteristics and pregnancy outcomes are given in table 1. Women with hypertension (stage 1 and stage 2) in the first trimester were slightly older than the other two groups. Chinese women contrib-uted a greater proportion of hypertension (49.3%) than Indian (8.0%) and Malay (30.7%). A higher incidence of maternal overweight (BMI ≥25 kg/m2) and obesity (BMI
≥30 kg/m2) was observed in the elevated BP group and
hypertension group than in the normal BP group.
The prevalence of maternal preconception diabetes was 6.7% in hypertension groups which was significantly higher than that of the other two groups. However, the prevalence of conception with assisted reproductive
on September 22, 2020 by guest. Protected by copyright.
Table 2 Maternal blood pressure levels at four time points during pregnancy by maternal blood pressure at 11–14 weeks in the NORA cohort
Variables Normal BP (n=750) Elevated BP (n=98)
Hypertension (stage 1 and
stage 2) (n=75) P value
SBP (mm Hg), mean±SD
11–14 weeks 104.9±8.3 123.2±2.6 126.8±11.1 <0.001
18–22 weeks 105.9±10.1 118.6±9.9 124.0±10.5 <0.001
28–32 weeks 108.2±10.0 118.1±9.7 123.8±11.4 <0.001
≥34 weeks 110.5±10.7 119.5±10.6 126.1±15.5 <0.001
DBP (mm Hg), mean±SD
11–14 weeks 63.6±6.8 71.4±4.4 80.8±7.0 <0.001
18–22 weeks 62.9±7.0 69.0±7.2 76.3±8.1 <0.001
28–32 weeks 64.0±6.9 69.8±6.6 76.6±9.0 <0.001
≥34 weeks 67.4±7.8 73.3±7.3 80.0±11.4 <0.001
MAP (mm Hg), mean±SD
11–14 weeks 77.3±6.5 88.7±3.2 96.1±6.5 <0.001
18–22 weeks 77.2±7.2 85.5±7.3 92.2±8.2 <0.001
28–32 weeks 78.8±7.1 85.9±6.3 92.4±9.1 <0.001
≥34 weeks 81.8±8.1 88.7±7.6 95.4±11.9 <0.001
BP, blood pressure; DBP, diastolic blood pressure; MAP, mean arterial pressure; SBP, systolic blood pressure.
technology were not significantly different among the three groups. As expected, the incidence of gestational hypertension (6.7%), preeclampsia (16.0%), preterm preeclampsia (6.7%) and term preeclampsia (9.3%) were the highest in the hypertension group. Women with hypertension had sustainable higher BP levels during pregnancy (table 2).
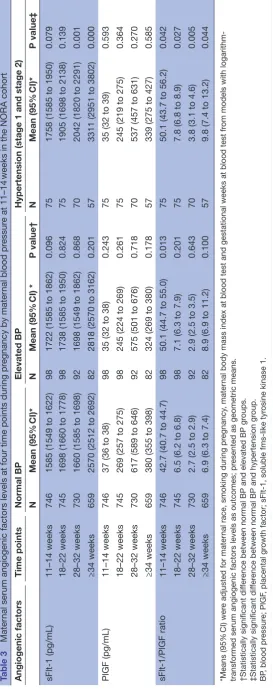
Table 3 shows the values of angiogenic factors at
four time points in the NORA participants. Logarithm- transformed serum angiogenic factors levels at four time points are presented as well (online supplementary table 1). We used covariance analysis to control for potential confounders that were reported to have impact on serum angiogenic proteins levels, including maternal race, smoking, maternal BMI and gestational age at blood collection. Overall, serum sFlt-1 concentrations continued rising throughout pregnancy. PlGF levels increased from the first trimester, peaked at 28–32 weeks and declined afterwards. Consequently, high levels of sFlt-1/PlGF ratio were observed both at 11–14 and 34 weeks onwards. The dynamic change of serum angiogenic factors during preg-nancy was observed in all three groups. Maternal serum sFlt-1 and PlGF levels were not significantly different between elevated BP group and normal BP group at four time points during pregnancy. In hypertension group, a trend of higher maternal sFlt-1 concentrations was observed from early pregnancy and it was dramati-cally increased during the third trimester compared with sFlt-1 levels in normotensive women. In contrast, PlGF
concentrations were not significantly different between hypertension group and normal BP group. Thus, sFlt-1/ PlGF ratio in hypertensive women was significantly higher throughout pregnancy than that in normotensive women. Comparisons of angiogenic factors levels throughout gestation in women with or without preeclampsia in each group are presented in supplementary table 2.
Higher levels of DBP and MAP in early pregnancy were significantly associated with higher log- transformed sFlt-1 values throughout pregnancy. Meanwhile, higher SBP levels were significantly associated with lower log- transformed PlGF levels both at 18–22 weeks (β=−0.02 per 10 mm Hg SBP, p=0.011) and at 28–32 weeks (β=−0.02 per 10 mm Hg SBP, p=0.031). Thus, rises in maternal SBP, DBP and MAP in the first trimester were significantly asso-ciated with higher sFlt-1/PlGF ratios during pregnancy (online supplementary table 3).
Table 4 presents the significant association between BP
in early pregnancy and risks of preeclampsia (OR 2.5, 95% CI 1.5 to 4.0 per 10 mm Hg SBP; OR 4.3, 95% CI 2.3 to 7.9 per 10 mm Hg DBP; OR 4.1, 95% CI 2.2 to 7.7 per 10 mm Hg MAP, respectively) after adjustment of poten-tial confounders. Preterm preeclampsia was more closely associated with higher DBP than SBP (OR 6.0, 95% CI 2.3 to 7.9 per 10 mm Hg DBP vs OR 1.9, 95% CI 0.9 to 3.8 per 10 mm Hg SBP).
DISCuSSIOn
Our study confirmed that higher early pregnancy BP levels were prospectively associated with increased risks of preeclampsia, including preterm and term preeclampsia. Furthermore, women with elevated BP in early pregnancy already had a higher sFlt-1 level and sFlt-1/PlGF ratio in early gestation and throughout pregnancy. In contrast, PlGF levels in these women remained normal throughout gestation.
It is well established that women with chronic hyper-tension have several times the risk of preeclampsia than normotensive women.14 However, the pathogensis is
poorly understood and what role these angiogenic and antiangiogenic factors play remains unclear. Although syncytiotrophoblast is a major source of sFlt-1 production, peripheral blood monocytes produce a small amount of sFlt-1 further stimulated by inflammation.15 16 As chronic
hypertension is often related to a chronic inflammatory status,17 the slightly increased sFlt-1 level in hypertensive
women in early pregnancy, as observed in our study, may reflect the chronic inflammatory status in early preg-nancy. Our results showed that hypertensive women in early pregnancy might have an imbalanced angiogenic factors levels and such imbalanced angiogenic environ-ment tended to continue during pregnancy, which might be associated with the increased risks of preeclampsia.
On the other hand, maternal circulating PlGF is highly expressed by the placenta during pregnancy. It has both vasculogenic and angiogenic functions18 and its level
is likely to reflect the placental health conditions. For
on September 22, 2020 by guest. Protected by copyright.
Table 3
Mater
nal serum angiogenic factors levels at four time points during pr
egnancy by mater
nal blood pr
essur
e at 11–14
weeks in the NORA cohort
Angiogenic factors
Time points
Normal BP
Elevated BP
Hypertension (stage 1 and stage 2)
N
Mean
(95%
CI)*
N
Mean (95%
CI) *
P value†
N
Mean
(95%
CI)*
P value‡
sFlt-1 (pg/mL)
11–14 weeks
746
1585 (1549 to 1622)
98
1722 (1585 to 1862)
0.096
75
1758 (1585 to 1950)
0.079
18–22 weeks
745
1698 (1660 to 1778)
98
1738 (1585 to 1950)
0.824
75
1905 (1698 to 2138)
0.139
28–32 weeks
730
1660 (1585 to 1698)
92
1698 (1549 to 1862)
0.868
70
2042 (1820 to 2291)
0.001
≥34 weeks
659
2570 (2512 to 2692)
82
2818 (2570 to 3162)
0.201
57
3311 (2951 to 3802)
0.000
PlGF (pg/mL)
11–14 weeks
746
37 (36 to 38)
98
35 (32 to 38)
0.243
75
35 (32 to 39)
0.593
18–22 weeks
745
269 (257 to 275)
98
245 (224 to 269)
0.261
75
245 (219 to 275)
0.364
28–32 weeks
730
617 (589 to 646)
92
575 (501 to 676)
0.718
70
537 (457 to 631)
0.270
≥34 weeks
659
380 (355 to 398)
82
324 (269 to 380)
0.178
57
339 (275 to 427)
0.585
sFlt-1/PlGF ratio
11–14 weeks
746
42.7 (40.7 to 44.7)
98
50.1 (44.7 to 55.0)
0.013
75
50.1 (43.7 to 56.2)
0.042
18–22 weeks
745
6.5 (6.2 to 6.8)
98
7.1 (6.3 to 7.9)
0.201
75
7.8 (6.8 to 8.9)
0.027
28–32 weeks
730
2.7 (2.5 to 2.9)
92
2.9 (2.5 to 3.5)
0.643
70
3.8 (3.1 to 4.6)
0.005
≥34 weeks
659
6.9 (6.3 to 7.4)
82
8.9 (6.9 to 11.2)
0.100
57
9.8 (7.4 to 13.2)
0.044
*Means (95%
CI) wer
e adjusted for mater
nal race, smoking during pr
egnancy
, mater
nal body mass index at blood test and gestational weeks at blood test fr
om models with
logarithm-transformed serum angiogenic factors levels as outcomes; pr
esented as geometric means.
†Statistically significant dif
fer
ence between normal BP and elevated BP gr
oups.
‡Statistically significant dif
fer
ence between normal BP and hypertension gr
oup.
BP
, blood pr
essur
e; PlGF
, placental gr
owth factor; sFlt-1, soluble
like tyr
osine kinase 1.
on September 22, 2020 by guest. Protected by copyright.
Table 4 Logistic regression analysis for maternal blood pressure at 11–14 weeks and adverse pregnancy outcomes. Variable Preeclampsia Preterm preeclampsia Term preeclampsia
Crude OR (95% CI)
Adjusted OR* (95% CI)
Crude OR (95% CI)
Adjusted OR* (95% CI)
Crude OR (95% CI)
Adjusted OR* (95% CI)
SBP (10 mm Hg) 3.0 (1.9 to 4.6)† 2.5 (1.5 to 4.0)† 1.9 (1.1 to 3.5) 1.9 (0.9 to 3.8) 4.1 (2.2 to 7.8)† 3.2 (1.6 to 6.4)† DBP (10 mm Hg) 5.2 (2.9 to 9.3)† 4.3 (2.3 to 7.9)† 5.8 (2.4 to 14.4)† 6.0 (2.3 to 16.2)† 4.4 (2.1 to 9.1)† 3.1 (1.4 to 6.8)† MAP (10 mm Hg) 5.1 (2.8 to 9.0)† 4.1 (2.2 to 7.7)† 5.1 (2.1 to 11.9)† 5.6 (2.0 to 15.5)† 4.7 (2.2 to 9.7)† 3.3 (1.5 to 7.4)
*Adjusted for maternal age, race, education, maternal body mass index at 11–14 weeks’ gestation and diabetes mellitus. †P<0.01.
DBP, diastolic blood pressure; MAP, mean arterial pressure; SBP, systolic blood pressure.
example, low PlGF concentrations preceding clinical onset of preeclampsia often occur in early onset rather than late- onset preeclampsia.19 Women who develop
preeclampsia with fetal growth restriction (FGR) have further decreased PlGF levels compared with women who develop preeclampsia without FGR.20–22 Early onset
preeclampsia and placenta- derived FGR are associated with placenta pathology such as incomplete remodel-ling of spiral arteries, acute atherosis and thrombosis in spiral arteries and syncytiotrophoblast necrosis.23 24 In
our study, women with elevated BP in early pregnancy, the PlGF level remained by and large normal throughout pregnancy and newborn’s birth weight was not signifi-cantly different among the three groups. Thus, our find-ings seem to suggest that the placental implantation and development might not be impaired in these women.
As poor placentation is not a unique cause of developing preeclampsia, enhanced placental oxidative and endo-plasmic reticulum stress and increased maternal systemic inflammatory responses are thought to play crucial roles in preeclampsia as well.25 26 Thus, pre- existing endothelial
dysfunction in hypertensive women could be exacerbated as a result of physiological burden of pregnancy even without an abnormal placentation.27 Taking all things
considered, we propose that the imbalanced angiogenic factors environment and, perhaps more importantly, pre- existing endothelial susceptibility and dysfunction, may play a critical role in the development of preeclampsia in women with elevated BP in early pregnancy.
To our best knowledge, this was the first prospec-tive cohort study that illustrated the dynamic changes of angiogenic and antiangiogenic factors throughout pregnancy in women with different BP status in early pregnancy. The NORA cohort was a well- performed prospective study with comprehensive information including clinical, biophysical and biochemical markers. The follow- up rate was 99.1% (926/934) at the end of pregnancy. Measurements of BP and serum angiogenic factors were performed according to standardised proto-cols. In our study, three women reported using antihyper-tensive medications during pregnancy; thus, the results should not be affected by the medication issue. On the other hand, as most of our participants were low- risk pregnant women, our results may not be applicable to high- risk women. As it was an observational study, the
potential residual confounding and selection bias might have some impacts on our results.
COnCluSIOn
Women with elevated BP in early pregnancy already had a higher sFlt-1/PlGF ratio in early gestation and throughout pregnancy, and an increased risk of preeclampsia. In contrast, PlGF levels in these women remained normal throughout gestation. Our findings suggest that the imbalanced angiogenic factors levels throughout gesta-tion might play a crucial role in developing preeclampsia in women with pre- existing elevated BP. Our study also supports that preconception or early pregnancy high BP, defined as SBP ≥130 mm Hg or DBP ≥80 mm Hg according to 2017 ACC/AHA guideline, should cause clinical aware-ness both during pregnancy and in their later life.
Acknowledgements We thank all the NORA cohort (Neonatal and Obstetrics Risks Assessment) participants for their commitment to the study, the NORA cohort investigators and staff.
Contributors JZ: performed the statistical analysis, searched literature and drafted the manuscript. JZ (corresponding author): had the original idea, provided guidance for the statistical analysis and revised the manuscript. MJN, BC, GSHY and KHT: participated in the data collection, reviewed and revised the manuscript.
Funding The authors have not declared a specific grant for this research from any funding agency in the public, commercial or not- for- profit sectors.
Competing interests None declared.
Patient consent for publication Not required.
ethics approval This study was approved by the SingHealth Centralised Institutional Review Board Ethics Committee, Singapore (CIRB Ref No. 2010/214/D).
Provenance and peer review Not commissioned; externally peer reviewed.
Data availability statement All data relevant to the study are included in the article or uploaded as supplementary information.
Open access This is an open access article distributed in accordance with the Creative Commons Attribution Non Commercial (CC BY- NC 4.0) license, which permits others to distribute, remix, adapt, build upon this work non- commercially, and license their derivative works on different terms, provided the original work is properly cited, appropriate credit is given, any changes made indicated, and the use is non- commercial. See: http:// creativecommons. org/ licenses/ by- nc/ 4. 0/.
OrCID iD
Jun Zhang http:// orcid. org/ 0000- 0003- 1706- 1611
on September 22, 2020 by guest. Protected by copyright.
reFerenCeS
1 Kendall RL, Thomas KA. Inhibition of vascular endothelial cell growth
factor activity by an endogenously encoded soluble receptor. Proc
Natl Acad Sci U S A 1993;90:10705–9.
2 Levine RJ, Maynard SE, Qian C, et al. Circulating angiogenic factors
and the risk of preeclampsia. N Engl J Med 2004;350:672–83.
3 Zeisler H, Llurba E, Chantraine F, et al. Predictive Value of the
sFlt-1:PlGF Ratio in Women with Suspected Preeclampsia. N Engl J Med
2016;374:13–22.
4 NICE. PlGF- based testing to help diagnose suspected pre- eclampsia
(triage PlGF test, Elecsys immunoassay sFlt-1/PlGF ratio, DELFIA Xpress PlGF 1-2-3 test, and BRAHMS sFlt-1 Kryptor/BRAHMS PlGF plus Kryptor PE ratio). diagnostics guidance 23. London: NICE, 2016.
5 Maynard SE, Min J- Y, Merchan J, et al. Excess placental soluble
FMS- like tyrosine kinase 1 (sFlt1) may contribute to endothelial
dysfunction, hypertension, and proteinuria in preeclampsia. J Clin
Invest 2003;111:649–58.
6 Sela S, Itin A, Natanson- Yaron S, et al. A novel human- specific
soluble vascular endothelial growth factor receptor 1: cell- type- specific splicing and implications to vascular endothelial growth
factor homeostasis and preeclampsia. Circ Res 2008;102:1566–74.
7 Gerber HP, Condorelli F, Park J, et al. Differential transcriptional
regulation of the two vascular endothelial growth factor receptor
genes. Flt-1, but not Flk-1/KDR, is up- regulated by hypoxia. J Biol
Chem 1997;272:23659–67.
8 Warrington JP, George EM, Palei AC, et al. Recent advances in the
understanding of the pathophysiology of preeclampsia. Hypertension
2013;62:666–73.
9 Yang J, Pearl M, DeLorenze GN, et al. Racial- ethnic differences in
midtrimester maternal serum levels of angiogenic and antiangiogenic
factors. Am J Obstet Gynecol 2016;215:e1-9:359–359.e9.
10 Ng QJ, Zhang J, Dai F, et al. Neonatal and obstetric risk assessment
(NorA) pregnancy cohort study in Singapore. Int J Gynaecol Obstet
2018;4:31–7.
11 Pickering TG, Hall JE, Appel LJ, et al. Recommendations for blood
pressure measurement in humans and experimental animals.
Circulation 2005;111:697–716.
12 Brown MA, Lindheimer MD, de Swiet M, et al. The classification and
diagnosis of the hypertensive disorders of pregnancy: statement from the International Society for the study of hypertension in
pregnancy (ISSHP). Hypertens Pregnancy 2001;20:ix–xiv.
13 Whelton PK, Carey RM, Aronow WS, et al. 2017 ACC/AHA/AAPA/
ABC/ACPM/AGS/APhA/ASH/ASPC/NMA/PCNA guideline for the prevention, detection, evaluation, and management of high blood pressure in adults: executive summary: a report of the American College of Cardiology/American heart association Task force on
clinical practice guidelines. Hypertension 2018;71:1269–324.
14 Bartsch E, Medcalf KE, Park AL, et al. High risk of pre- eclampsia
identification group. clinical risk factors for pre- eclampsia determined in early pregnancy: systematic review and meta- analysis of large
cohort studies. BMJ 2016;353:i1753.
15 Rajakumar A, Michael H, Rajakumar P, et al. Extra- placental
expression of vascular endothelial growth factor receptor-1, (flt-1) and soluble Flt-1 (sFlt-1), by peripheral blood mononuclear cells (PBMCs) in normotensive and preeclamptic pregnant women.
Placenta 2005;26:563–73.
16 Freeman DJ, McManus F, Brown EA, et al. Short- and long-
term changes in plasma inflammatory markers associated with
preeclampsia. Hypertension 2004;44:708–14.
17 Dinh QN, Drummond GR, Sobey CG, et al. Roles of inflammation,
oxidative stress, and vascular dysfunction in hypertension. Biomed
Res Int 2014;2014:1–11.
18 De Falco S. The discovery of placenta growth factor and its
biological activity. Exp Mol Med 2012;44:1–9.
19 McElrath TF, Lim K- H, Pare E, et al. Longitudinal evaluation of
predictive value for preeclampsia of circulating angiogenic factors
through pregnancy. Am J Obstet Gynecol 2012;207:e1-7:407–407.
e7.
20 Powers RW, Roberts JM, Plymire DA, et al. Low placental growth
factor across pregnancy identifies a subset of women with preterm
preeclampsia: type 1 versus type 2 preeclampsia? Hypertension
2012;60:239–46.
21 Romero R, Nien JK, Espinoza J, et al. A longitudinal study of
angiogenic (placental growth factor) and anti- angiogenic (soluble endoglin and soluble vascular endothelial growth factor receptor-1) factors in normal pregnancy and patients destined to develop
preeclampsia and deliver a small for gestational age neonate. J
Matern Fetal Neonatal Med 2008;21:9–23.
22 Chaiworapongsa T, Romero R, Whitten AE, et al. The use of
angiogenic biomarkers in maternal blood to identify which SGA fetuses will require a preterm delivery and mothers who will develop
pre- eclampsia. J Matern Fetal Neonatal Med 2016;29:1214–28.
23 Nelson DB, Ziadie MS, McIntire DD, et al. Placental pathology
suggesting that preeclampsia is more than one disease. Am J Obstet
Gynecol 2014;210:e1-7:66–66.e7.
24 Burton GJ, Jauniaux E. Pathophysiology of placental- derived fetal
growth restriction. Am J Obstet Gynecol 2018;218:S745–61.
25 Steegers EAP, von Dadelszen P, Duvekot JJ, et al. Pre- Eclampsia.
The Lancet 2010;376:631–44.
26 Redman CW, Sargent IL, Staff AC. IFPA senior Award Lecture: making sense of pre- eclampsia – two placental causes of
preeclampsia? Placenta 2014;35:S20–5.
27 Ness RB, Roberts JM. Heterogeneous causes constituting the single
syndrome of preeclampsia: a hypothesis and its implications. Am J
Obstet Gynecol 1996;175:1365–70.
on September 22, 2020 by guest. Protected by copyright.