ISSN: 2146-4138 www.econjournals.com
99
The Effect of Environmental Regulations on Financial Performance in
Tanzania: A Survey of Manufacturing Companies Quoted on the Dar Es
Salaam Stock Exchange
Daniel Linus Naila
ST Augustine University of Tanzania, Tanzania. Email: mrawadaniel@yahoo.com
ABSTRACT: There has been environmental pollution across the globe. Environmental activists are condemning manufacturing companies of environmental pollution. This has led to the establishment of environmental regulations and standards by government authorities across the globe. In complying with environmental regulations companies have found themselves incurring additional cost when compared to those companies which do not comply. However, the effect of compliance to environmental regulations on the financial performance is not clear. This study explores the effects of environmental compliance on the financial performance for listed manufacturing companies in Tanzania. Five listed manufacturing companies were surveyed to obtain data used for the purpose of this study. Specifically, the study intended to establish: the relationship between environmental compliance and financial performance and the effect of environmental compliance on the financial performance. Regression analysis was done to establish the relationship between environmental compliance and financial performance. Findings suggest that there is no significant relationship between environmental compliance and financial performance among listed manufacturing firms in Tanzania. This study concludes that environmental compliance has no significant effect on the financial performance for listed manufacturing firms in Tanzania.
Keywords: Environmental regulations; Financial performance; Dar es Salaam stock exchange JEL Classifications: G; Q5
1. Introduction
1.1 Background to the problem
Environmental pollution across the globe has been increasing. For example, carbon dioxide (CO2) reached 2,900 million metric tones in 2004 and continues to rise as evidenced by increasing
concentration of CO2 in the atmosphere (UN, 2007c). In Northern Africa, emission more than doubled
between 1990 and 2004 increasing from 1.9 to 3.2 metric tons of CO2 per capita (Ibid, 2007).
Environmental activists have been accusing business organizations of environmental pollution. This has led to the establishment of environmental regulations by various countries across the globe1. Since financial performance is crucial to business organizations, it is important to know the effects of environmental compliance on financial performance. The effects of environmental compliance on financial performance can be understood by establishing a relationship between environmental compliance and financial performance.
Empirical studies reveal that, the relationship between environmental compliance and financial performance is not clear. Studies (Spicer, 1978; Waddock and Graves, 1997; Schnietz and Epstien, 2005; Wahba, 2008; Hart, 1997; Porter and Van der Linde, 1995; Reinhardt, 1999 and Dowel et al., 2000) suggest a positive relationship between environmental compliance and financial performance. On the other hand studies (Chen and Metcalf 1980; Jaggi and Freedman, 1992 and Wagner et al., 2002) suggest a negative relationship between environmental compliance and financial performance. More contradicting are studies (Mahapatra, 1984; Mc Williams and Siegel, 2000; Mill,
1
100 2006 and Murray et al., 2006) which suggest that there is no significant relationship between environmental compliance and financial performance.
1.1.2 Environmental pollution in Tanzania
Environmental pollution is also witnessed in Tanzania. Pollution from agriculture, Industry, mining and household is threatening Tanzania water resources (UNEP 2008). Business organization in form of industries plays a part in environmental pollution. Although the level of industrialization is low in United Republic of Tanzania, untreated industrial waste causes significant localized pollution (UNEP, 2008). About 80 percent of industries including agrochemical industries, breweries and steel manufacturing industries are located in the coastal Dar-es-salaam (UNEP, 2008). It has been estimated that almost 70 percent of the industries directly or indirectly pollute the Indian Ocean (Mgana and Mahogo, 2002).
1.2 Environmental regulations in Tanzania
Environmental regulations in Tanzania are directed under the Environmental Management Act 2004 (EMA2004). Local government authorities are required to ensure that industries located within respective areas of jurisdiction provide adequate space and facilities for managing all solid waste generated from such industries before they are collected for disposal at designated places. The Minister responsible for environment is entitled to make regulations prescribing the best methods for the treatment of hazardous and non-hazardous liquid waste from industries.2
Concerning gas pollution, EMA, 2004 explains about the location of industries which emit gases. The local government authorities in taking to consideration wind direction and environmental impact assessment recommendations should ensure that industries producing gas emission are located far away from residential areas3.
Failure to comply with environmental regulations, manufacturing companies operating in Tanzania will incur costs in terms of fines and penalties. EMA, 2004 states that individuals who fail to comply with environmental regulations will be subjected to fines and penalties.4
1.3 Statement of the problem
Empirical studies indicate that the relationship between environmental compliance and financial performance represents a perplexing issue. There are studies which suggest a positive relationship while other studies suggest negative relationship. Contrary to positive and negative relationship are studies which suggest that there is no significant relationship environmental regulations and financial performance. Review of literature suggests that majority of studies have been done in developed economies and little has been done in developing economies like Tanzania.
With EMA, 2004, manufacturing companies operating in Tanzania are subject to complying with environmental regulation. In complying with environmental regulations, manufacturing companies incur costs5. Whether these costs improve or reduces financial performance is the central question explored by this study.
The problem which motivates the conduct of this study is based on three arguments. First, empirical studies suggest that the effect of environmental regulations on financial performance is not clear. Second, few studies on the relationship between environmental regulations and financial performance has been done in developing countries. Third, establishment of EMA, 2004 add operating costs to manufacturing companies operating in Tanzania; whether these costs affect financial performance is not known.
Therefore, this study intends to investigate how environmental regulations affects financial performance and whether costs resulting from environmental regulations improves or reduces financial performance of listed manufacturing companies in Tanzania.
2
Environmental Management Act 2004 section 116(1)
3
Environmental Management Act 2004 section 128
4
Environmental Management Act 2004, section 184, 184(4) 187(2)
5
101 1.4 Research objectives
1.4.1 General objective
The main objective of this study is to find out whether environmental regulations affects financial performance of manufacturing companies listed on the Dar –es Salaam Stock Exchange (DSE).
1.4.2 Specific objectives
Specifically this study intends to accomplish the following objectives
i. To find out whether there is relationship between compliance to environmental regulations and financial performance for listed manufacturing companies in Tanzania.
ii. To find out the effect of environmental regulations on the financial performance of manufacturing companies listed on the Dar es Salaam Stock Exchange.
1.5 Research questions
This study seeks answers to the following questions:
i. What is the relationship between compliance to environmental regulations and financial performance?
ii. What is the effect of environmental regulations on the financial performance of listed manufacturing firms in Tanzania?
2. Literature Review
2.1 Empirical literature review
The relationship between environmental compliance and financial performance is important. Market analysts for example increasingly gather environmental compliance data as an indicator of future capital market return (Kiernan, 1998). Studies on the relationship between environmental regulations and financial performance do not provide similar results. There are studies which suggest a positive relationship, others negative relationship and even some of them suggest that there is no significant relationship.
In support of positive relationship, Hart (1997) argues that discretionary improvement in environmental compliance often provides financial benefits; this is because pollution reduction causes future cost savings by increasing efficiency, reducing compliance costs and minimizing future liabilities (Porters and Van der Linde, 1995 and Reinhardt, 1999). In the same line of argument, Dowel et al, (2000) argues that firms that adopt single stringent environmental standards worldwide have higher market valuations than firms that do not adopt such standards.
A positive relationship between environmental regulations and financial performance is further supported by other empirical studies. Spicer (1978) documented a positive correlation between pollution control records and profitability. Schneitz and Epstien (2005) documented less negative reaction from the stock market after environmental crises.
A negative relationship between environmental compliance and financial performance has also found support among prior research works. Jaggi and Freedman (1992) found a negative relationship between pollution performance index and financial performance index; they concluded that the market does not reward corporate environmental commitment. In similar view Chen and Metcalf (1980) found a negative relationship between firm environmental performance and financial performance.
As opposed to positive and negative relationship, there are studies which suggest that there is no significant relationship between environmental compliance and financial performance. McWilliams and Siegel (2001) argue that, the relationship between corporate environmental responsibility and profitability is expected to be neutral. This argument is supported by Mahapatra (1984) who argues that pollution control expenditure and firms profitability are not correlated. Similar results were observed by Murray et al., (2006) who found that share returns and environmental performance have no direct relationship.
102 2.2 Theoretical literature
Previous studies have used three main theories to explain the relationship between environmental compliance and firm’s financial performance. These are: Stakeholder theory, Agency theory and the theory of firm perspective.
2.2.1 Agency theory
According to the agency theory; the expected costs of firm’s social – environmental responsibility is likely to outweigh the resulting benefits and hence firm social performance is expected to have a negative impact on firm profitability [Freedman 1970]. Auperlle et al. (1985) explain this theory by arguing that; those firms that spend money on some pollution control instrument will incur costs that may affect their price and thus profitability whilst other competitors do not do this on the ,basis that it is the government’s responsibility. The main argument in agency theory as related to environmental regulations is that, corporate environmental responsibility can be explained as an agency problem between firm’s management and shareholders. In short the agency theory suggests that, compliance to environmental regulations should have negative effect on the financial performance
2.2.2 Theory of firm perspective
According to the theory of firm perspective; optimal level of investment in social environmental responsibility for a firm can be evaluated in the same way as any other investment by considering demand and supply sides (William and Siegel; 2001). The main argument of William and Siegel is that, the relationship between environmental compliance and financial performance should be neutral. They explained their position by arguing that; firms which do not incur costs to prevent environmental effect of their operation will, offer their products and services at lower price while those firms which incur environmental costs will, be able to offer their products and services at higher prices. According to this theory therefore, compliance to environmental regulations should not have any effect on the financial performance.
2.2.3 Stakeholder theory
Stakeholder’s theory suggests that every corporation has its unique stakeholders that influence and simultaneously are affected by its actions (Freeman; 1984). This theory also suggests that every corporation has predetermined contracts and commitments internally and extremely with different parties which need to be fulfilled (Wood; 1991). In particular this theory suggests that environmental compliance should be reflected positively in firm’s profitability. The stakeholder assumption can be explained by considering the inverse relationship between imp-licit and explicit costs of the firm. Waddock and Graves (1997) argued that, when the organization decide to bring down its implicit costs by acting in environmentally irresponsible manner by reducing costs of pollution prevention and protection, it will experience higher explicit costs as competitive edge will be exhausted.
2.3 Environmental regulations in Tanzania 2.3.1 Preliminaries
Legal issues concerning environmental management in Tanzania are provided in the Environmental management Act 2004 (EMA 2004). Every person living in Tanzania has a right to a clean and safe environment6. The right to clean, safe and health environment includes: the right of access by any citizen to the various public elements or segments of environment for recreational, health, spiritual, cultural and economic purposes.7 This implies that manufacturing companies operating in Tanzania should make sure that, their actions should not deny Tanzanians their right to clean environment. In trying to do so, these manufacturing companies operating in Tanzania will incur additional costs.
Every person living in Tanzania has the duty to make sure that environmental regulations are maintained. Section 6 of EMA, 2OO4 stipulates that it is the duty of every person living in Tanzania to safeguard and enhance the environment and to inform the relevant authority of any activity and phenomenon that may affect the environment significantly.
The represented by the minister responsible for environmental affairs should promote environmental awareness among its citizens. It is the duty of the minister in collaboration with other agencies, to promote cleaner production technologies and foster sustainable consumption of goods
6
Environmental Management Act 2004, section 4(1)
7
103 and services. The minister may describe guidelines relating to sustainable consumption and cleaner production8.
For the purpose of minimizing environmental damage, the director of the environment shall periodically prepare proposals on package of economic instrument financial incentives and forward the same to the minister9.
The minister may in consultation with the minister for finance make regulations and rules on economic instruments which prescribes how best to oblige individuals or firms when making decisions about production consumption and investment, to consider the environmental consequences. The EMA2004 defines an economic instrument as an instrument for environmental and natural resource management designed to influence behavior of economic agents in order to ensure sustainable use and perfection of biophysical resources and includes fiscal instruments, charge systems, property right, market creation, performance bonds and deposit refund systems. Liability systems, provision of information and financial instruments10.
2.3.2 Environmental impact assessment
According section 3 of EMA, 2004, Environmental impact assessment means a systematic examination conducted to determine whether or not a programme, activity or a project will have any adverse impacts on the environment.
The costs associated with environmental impact assessment are supposed to be borne by individuals assessed. Section 81(1) and (2) of EMA, 2004 indicates that, any person being a proponent or a developer of a project for which environmental impact assessment is required to be made by the law governing such project has to undertake or cause to be undertaken at his own cost, an environmental impact assessment study. In addition to that, the law requires environmental assessment study to be carried out prior to the commencement of the financing of a project.
After environmental impact assessment, the law entitles the proponent to be issued with environmental impact assessment certificate11. However this is done when all requirements for the certificate are made. The environmental impact assessment certificate may be transferred from one holder to another in the event the project change ownership and not otherwise within thirty days of transfer.
2.3.3 Waste management from industries
Local government authorities are required to ensure that industries located within respective areas of jurisdiction provide adequate space and facilities for managing all solid waste generated from such industries before they are collected for disposal at designated places12.
The minister responsible for the environment is entitled to make regulations prescribing the best methods for the treatment of hazardous and non-hazardous liquid waste from industries.
The law prescribes the location of industries which emits gases. It require local government authorities in taking to consideration wind direction and environmental impact assessment recommendations to ensure that industries producing gas emission are located far away from residential area13.
2.3.4 Offences and Penalties
It is necessary for manufacturing companies to consider how their operations affect the environment. Failure to comply with environmental regulations may cost the firm in term of fine penalties. The act is clear about penalties and fines concerning violation of environmental regulations. Penalties against a person violating the regulations relating to environmental impact assessment report are verified in the EMA 2004. Such person commits an offence and is liable on conviction to a fine of not less than five hundred thousands Tanzanian shillings but not exceeding ten million shillings or to imprisonment for a term of not less than two years but not exceeding seven years or both14.
8
Environmental Management Act 2004, section 79
9
Environmental Management Act 2004 ,section 80(1)
10
Environmental Management Act 2004 ,section 80(4)
11
Environmental Management Act 2004, section 81(3)
12
Environmental Management Act 2004, section 116(1)
13
Environmental Management Act 2004, section 128
14
104 Section 187(4) of the act prescribes penalties against a person which discharges dangerous materials and pollutants. It states that, such person commits an offence and is liable on conviction to a fine of not less than three million Tanzanian shillings but not exceeding fifty million Tanzanian shillings or to imprisonment for a term of not exceeding twelve years or both.
Cleaning of polluted environment is the responsibility of the person who has polluted environment. The law requires the person convicted to pay full costs of clearing up the polluted environment and removing the pollution or to clean up the polluted environment and remove the effects of pollution to satisfaction of the council15.
2.4 Conceptual framework
The conceptual framework used for the purpose of this study is based on previous studies and the situation in Tanzania. Figure 2.1 gives a diagrammatic summary of conceptual framework. The following functional model explains relationships among variables in the conceptual framework.
= ( , , , )
Where:
Fin per = financial performance measured by the Return on Investment (ROI)
ENVIC= Capital expenditure on pollution control technology. (Measure by the ratio of total capital cost incurred to acquire pollution control technology to the fixed assets).
ISO = Certification to ISO 14001 (Measured as; 1- a company is certified to ISO 14001 and 0- a company is not certified to ISO 14001)
CINT = Capital intensity (Measured by the ratio of fixed asset to total assets).
AGE = Firm age (Measured by the natural logarithm of number of years the firm has been in to operation)
This study adopts financial performance a dependent variable. Similar to Hart and Ahuja (1996) and Russo and Fouts (1997) Return on Investment (ROI) was used to measure financial performance. The calculation for ROI was done using the following formula:
=
Greater ROI implies greater asset utilization in generating profit which indicates better financial performance. Lower ROI implies lower asset utilization in generating profit which indicates poor financial performance.
ROI is preferred as a measure of financial performance because it factors in the asset utilization efficiency. This will make it possible to measure the efficiency of assets invested to comply with environmental regulations.
Basing on previous studies and availability of information in Tanzania the study used two independent variables. Similar to Spice (1978) and Nehrt (1996), capital expenditure on pollution control technology was used as the independent variable16. Notes to financial statements were analyzed to find out whether the amount spent to acquire assets for pollution control technology.
Figure 1 A conceptual model of the relationship between environmental performance and financial performance
15
Environmental Management Act 2004, section 187(2)
16
According to Spicer (1978) and Nehrt (1996), capital expenditure incurred in pollution control technology measures the extent to which capital is employed to comply with environmental standards.
As it will be explained in the next chapter, capital expenditure on pollution control technology will be measured as a percentage of total cost incurred to acquire and maintain pollution control technology.
INDEPENDENT VARIABLE
Environmental compliance
CONTROL VARIABLES
Capital intensity
Firm age
DEPENDENT VARIABLE
105 The second independent variable is ISO 14001 certification. ISO refers to Geneva based International Standards Organization, best known as author of the ISO 9000 series of quality standards. The ISO 14000 series standardizes environmental management on dimension ranging from an organization system for managing environmental impact assessment to labeling guidelines to lifecycle assessment (Tibor and Feldman, 1996). The ISO 14001 standard which refers to environmental management system was finalized in 1996 and thereafter globally. Certification to ISO 14001 requires an environmental management system. This implies that companies with ISO 14001 standard certification have environmental management system. Wahba (2008) used ISO 14001 certification to measure whether the market value corporate social environmental responsibility for Egyptian companies.
Literature suggests that there are other factors which affect the relationship between environmental performance and financial performance17. In order to avoid model misspecification two variables were controlled.
To eliminate the effect of capital on financial performance, capital intensity was controlled. Capital intensity was calculated by the ratio of fixed assets to total assets.18 Hanks et al (1993) emphasized the control for firm’s age. They argued that firm age reflects firm life cycle stage which affects profitability and managerial priorities. For the purpose of this study firm age was measured by the number of years the firm has been in to operation.
3. Methodology 3.1 Research design
This study is a survey of listed manufacturing companies listed on the Dar es Salaam Stock Exchange (DSE)19. Financial information for four years prior to and after the establishment of Environmental Management was examined. Regression analysis for the data set obtained for periods prior to and after the establishment of the EMA2004 was done to test relationship among variables. Listed manufacturing firms were selected for the purpose of this study due to three main reasons. First, manufacturing firms are more involved in environmental pollution than other listed firms. Second, financial information for listed manufacturing firms can be easily obtained because listed firms are required by the law to make their financial statements publicly available. Third, manufacturing firms are included in the second schedule of EMA 200420.
3.2 Data set and sample
Data was obtained from a survey of five manufacturing firms listed on the DSE.. The data set is for the period of eight years t-4-t0and t+1– t+4; where t0 is 2006 when EMA2004 came in to operation. 3.3 Data collection
Financial information for listed manufacturing firms were obtained from Tanzania capital and Securities Market Authority (CSMA) database and firms’ financial offices. Records of whether a company has been certified to ISO 14001 were obtained from financial statements disclosures. 3.4 Variables
The variables used for the purpose of this study were influenced by previous studies and availability of information in Tanzania. The dependent variable was financial performance measured by Return on investment. Independent variables were capital expenditure on pollution control technology and certification to ISO 14001. The control variables were capital intensity and firm’s age. 3.4 Regression model specification
The multiple regression equation was used due to the following reasons: First, it allows the testing of more than one independent variable where one dependent variable is affected. Second, it fits well the conceptual framework explored in chapter two. Third, majority of similar studies used multiple
17
See Wahba (2008) and King and Lenox (2001)
18
See Wahba (2008), King and Lenox 2001, Russo & Fouts (1997) and Konar and Kohen (2001).
19
Until 30th October 2010 only fifteen companies were listed in DSE. Six of the listed companies were manufacturing companies. One company was dropped due to the unavailability of information for most periods covered by the study.
20
106 regression models to find out the relationship between environmental compliance and financial performance.
The p-values were used to determine the significance of relationship between Return on Investment and measures of environmental performance. F-test was used to determine the strength and significant model used in the proposed study. Specifically the following regression model was used for the purpose of this study.
Fin per =π + β1ISO + β2ENVIC + β3CINT + β4AGE+ ε
Where:
Fin per = Financial performance
ENVIC = Capital expenditure on pollution control technology. ISO = Certification to ISO 14001
CINT = Capital intensity AGE = Firm age Ε = Error term Π = y intercept
Β = coefficients of variables
4. Presentation of Research Findings 4.1 Data analysis
4.1.1 Sample representation
Of the six listed manufacturing companies in the DSE only five companies were surveyed. One company was dropped due to unavailability of information for the period covered by the study. The data collected covered two periods of four years before and after the establishment of Environmental Management Act 2004 (EMA 2004) which came in to operation in the year 2006. The period before the act was comprised of year t-4 – t-1. The period after the act is comprised of year t+1 – t+4. Where t is the year 2006
when EMA 2004 came in to operation. 4.1.2 Descriptive statistics
In order to understand the general overview of the industry under study, discriptive statistics were used. Table 1 presents a summary of descriptive statistics for all the variables used in this particular study. From the table 1 below, it can be observed that, the mean value for ROI was 0.281. This suggests that the central tendency for ROI was 0.281. However the standard deviation indicates that values for ROI were either below or above 0.3298. The median indicates that half the values of ROI were equal or below 0.27, and another half of values were equal or above 0.27. The overall summary statistics for ROI implies that, the average ROI for listed manufacturing firms in Tanzania was 0.281.
For ENVIC, table 1 show that the observed mean was 0.001182. The standard deviation implies that values for ENVIC were either 0.002108 above or below their mean. The median implies that half the values were equal or less than zero and the other half of values were greater or equal to zero. These summary statistics for ENVIC implies that, the average ratio of capital expenditure on pollution control technology to fixed assets for listed manufacturing firms in Tanzania was 0.001182.
Table 1. Summary statistics for a combination of before and after EMA 2004
VARIABLE N Mean St-Dev Median
ROI 40 0.281000 0.329800 0.270000
ENVIC 40 0.001182 0.002108 0.000000
ISO 40 0.375000 0.490300 0.000000
CINT 40 0.565600 0.160300 0.584800
AGE 40 3.455000 0.655000 3.713000
107 This table shows the summary statistics including: number of observations, means, standard deviations and medians. ROI, ENVIC, ISO,CINT and AGE represents Return on Investment, Capital expenditure on pollution control technology, Certification to ISO 14001, Capital Intensity and age of the firm respectively. N and St-dev stands for number of observations and Standard deviation respectively. ROI was measured by the following formula: Profit/ Total asset. Capital expenditure on pollution control technology was calculated using the following formula: total cost incurred to acquire pollution control technology/ total fixed assets. ISO was measured as to whether a firm had been certified to ISO 14001 or not. 1 implies the firm had been certified and 0 implies the firm had not been certified. CINT has been obtained by the ratio of total assets to fixed assets. Age had been measured by number of years the firm had been in to operation.
For ISO table 1 shows that, the observed mean was 0.375. The standard deviation suggests that values for ISO were either 0.4903 above the mean or 0.4903 below the mean. The median suggests that half values for ISO were below or equal to zero and the other half of values were above or equal to zero.
The mean for CINT is 0.5656. The standard deviation suggests that, values for CINT were0.1603 below or above the mean. The median suggests that half the values for CINT were less or equal to 0.5848 and the values from the other half were equal or greater than 0.5848. These statistics for CINT implies that, on average listed manufacturing firms in Tanzania had a capital intensity of 0.56565.
The mean value for AGE is 3.455. This implies that, firms used in this study had an average of 3.455 as natural logarithm of their age. The standard deviation suggests that, natural logarithm of ages for firms used in this study were either below or above the mean by0.655. The median suggests that, half the natural logarithms of age for firms used in this study were less or equal to 3.713 and the other half of values were greater or equal to 3.713.
4.1.3 Pearson correlations
In order to determine multicolinearity among variables, Pearson’s correlation coefficients were calculated. Table 2 presents correlation coefficients among the variables.
Table 2. Pearson’s correlation coefficient after EMA 2004
** and *** for 1%, 5% and10% levels respectively. Source: Field data (2011)
This table presents Pearson’s correlation coefficients among variables. ROI, ENVIC, AGE, CINT and ISO represents Return on investment, capital expenditure on pollution control technology, age and Certification to ISO 14001 respectively. ROI was measured by the following formula: Profit/ Total asset. Capital expenditure on pollution control technology was calculated using the following formula: total cost incurred to acquire pollution control technology/ total fixed assets. ISO was measured as to whether a firm had been certified to ISO 14001 or not. 1 implies the firm had been certified and 0 implies the firm had not been certified. CINT has been obtained by the ratio of total assets to fixed assets. Age had been measured by natural logarithm of number of years the firm had been in to operation. The significance level of the coefficient is obtained using the p-values with *,
It can be observed from the table 2 that, there was high positive correlation coefficient between Return on investment (ROI) and age of the firm. This suggests that there was high positive linear relationship between ROI and age of the firm. In other words it can be argued that as the firm gets older its ROI improves. In most cases initial investment involves great amount of money. As a result of that, initial ROI will be low but as time goes it will improve – other factors remaining constant. Also table 2 shows that there was strong positive correlation between ISO 14001 certification and capital expenditure in pollution control technology. This suggests that, firms which are certified to ISO 14001 incur more expenditure on pollution control technology. The explanation
ENVIC AGE CINT ISO
ROI 0.176 0.827* -0.045** -0.200
ENVIC 1 0.245 -0.422 0.814*
AGE 1 0.108 0.371***
108 for this observation is that in order for the firm to be certified to ISO 14001, it must comply with certain standards. One of these standards is pollution control technology.
There was a weak positive correlation coefficient between age and certification to ISO 14001. This suggests that, there was weak linear relationship between ages of the firm and certification to ISO 14001. In other words it can be stated that, the older the firm the higher the chance that a firm is certified to ISO 14001.
For CINT and ISO, results in table 2 shows that there was weak negative correlation among them. This suggests that firms with high capital intensity are less likely to be certified to ISO 14001. However the correlation coefficient between Return on Investment and capital intensity was very weak though significant. This weakness of correlation coefficient makes it difficult to come in to any objective implication. Results also suggest that there was positive correlation between ROI and ENVIC and negative correlation between ROI and ISO. However these correlations were not significant.
4.2 Empirical findings
4.2.1 Relationship between environmental compliance and financial performance.
To establish the relationship between environmental compliance and financial performance, regression analysis was done. ROI was used as dependent variable to measure financial performance. ENVIC and ISO were used as independent variables to measure environmental compliance. CINT and AGE were used as control variables.
In this table 3; ENVIC, AGE, CINT and ISO represent capital expenditure on pollution control technology, age, capital intensity and certification to ISO 14001 respectively. ROI was measured by the following formula: Profit/ Total asset. Capital expenditure on pollution control technology was calculated using the following formula: total cost incurred to acquire pollution control technology/ total fixed assets. ISO was measured as to whether a firm had been certified to ISO 14001 or not. 1 implies the firm had been certified and 0 implies the firm had not been certified. CINT has been obtained by the ratio of total assets to fixed assets. Age has been measured by natural logarithm of the number of years the firm has been in to operation.R2- adjusted represents coefficient of determination. It measures the proportion of the variation in dependent variables that is explained by a set of independent variables. The significance of the coefficient is obtained using the p-values with * and ** for 1%, and10% significance levels respectively.
Table 3. Regression output
VARIABLE BEFORE 2006 AFTER 2006
Coefficients Coefficients
Intercept 0.561 2.74
ENVIC 9.06 -46.1
AGE 0.261** -0.757*
CINT -0.941* 0.445
ISO 0.0198 0.304
R2 (adj) 92.30% 65.30%
Durb-watson 2.03663 2.65693
P-value 0.00000 0.00000
F-value 57.95 9.93
Source: Field data (2011)
109 The p-values for both models are 0.00. The Durbin-Watson ratio is 2.03663 and 2.65693 for the period of before and after 2006 respectively. This implies that both models for before and after 2006 are significant.
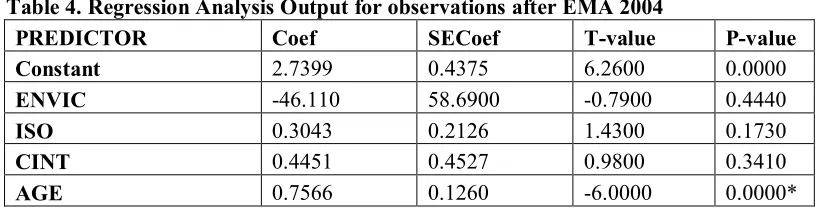
To understand the significance of coefficients p- values for each coefficient were calculated. Table 4 below presents coefficient for each variable with their respective p-values.
Table 4. Regression Analysis Output for observations after EMA 2004
PREDICTOR Coef SECoef T-value P-value
Constant 2.7399 0.4375 6.2600 0.0000
ENVIC -46.110 58.6900 -0.7900 0.4440
ISO 0.3043 0.2126 1.4300 0.1730
CINT 0.4451 0.4527 0.9800 0.3410
AGE 0.7566 0.1260 -6.0000 0.0000*
Note: * denotes significance at 1% significance level.
Source: Field data (2011)
This table represents regression analysis output for observations after the year2006 when the Environmental Management Act 2004 came in to operation. ENVIC, ISO, CINT and AGE represents Capital expenditure on pollution control technology, certification to ISO 14001, capital intensity and age of the firm respectively. ROI was measured by the following formula: Profit/ Total asset. Capital expenditure on pollution control technology was calculated using the following formula: total cost incurred to acquire pollution control technology/ total fixed assets. ISO was measured as to whether a firm had been certified to ISO 14001 or not. 1 implies the firm had been certified and 0 implies the firm had not been certified. CINT has been obtained by the ratio of total assets to fixed assets. Age had been measured by number of years the firm had been in to operation.
It can be observed that, there was a positive relationship between ROI and ISO, ROI and CINT, and ROI and AGE. There was also a negative relationship between ROI and ENVIC. However with exception of AGE, the relationship between ROI and other independent variables was not significant.
The p-value of 0.444 suggests that, there was no significant relationship between capital expenditure on pollution control technology and financial performance. This implies that efforts done by listed manufacturing firms in Tanzania to comply with environmental standards were not reflected in financial performance. These results are consistent with studies by Mc Williams & Siegel (2007), Mahapatra (1984) andMurray et al. (2006) which suggests that there is no significant relationship between environmental compliance and financial performance.
The p-value for ISO variable was 0.173, which means the variable was not significant. This implies that certification to ISO 14001 does not affect financial performance for listed manufacturing firms in Tanzania. These results are in consistent with studies (Mc Williams & Siegel; 2007, Mahapatra; 1984, Muray et al, 2006) which suggests that there is no significant relationship between environmental compliance and financial performance.
4.2.2The effect of environmental regulation on financial performance
To understand the effects of environmental compliance on the financial performance, regression outputs for the period before and after 2006 were compared. Table 5 below presents summarized outputs for the period before and after 2006.
110 been obtained by the ratio of total assets to fixed assets. Age had been measured by number of years the firm had been in to operation.
Table 5. Regression output for the periods of before and after EMA 2004
PREDICTOR Coef P-value
BEFORE EMA2004
AFTER EMA2004
BEFORE EMA2004
AFTER EMA2004
Constant 0.5614 2.7399 0.0000 0.0000
ENVIC 9.0610 -46.1100 0.2150 0.4440
ISO 0.0199 0.3043 0.6910 0.1730
CINT -0.9409 0.4451 0.2000 0.3410
AGE 0.0261 0.7566 0.0920** 0.0000*
Note: * and ** denotes significance at 1% and 10% significance level respectively. Source: Field data (2011)
Data from both periods indicates that, there was no significant relationship between dependent variable (financial performance) and independent variables (ENVIC and ISO). This implies that environmental compliance had no significance effect to the financial performance of listed manufacturing companies in Tanzania.
However, with respect to control variables; there was significant relationship between ROI and AGE for both periods. This implies that, with or without EMA 2004, AGE still has effect on financial performance of listed manufacturing firms in Tanzania.
5. Conclusion and Recommendations 5.1 Summary of the findings
This study was about the effect of environmental regulations on financial performance among the listed manufacturing companies in Tanzania. The conceptual framework was presented based on prior studies and the Tanzanian context. The key variables under investigation were measurers of environmental regulations (capital expenditure on pollution control technology and certification to ISO 14001) and financial performance measured by ROI.
The key findings from this study were (1) the extent of environmental compliance among listed manufacturing firms in Tanzania was not clear; (2) There was no significant relationship between environmental compliance and financial performance and (3) Environmental compliance had no significant effect on the financial performance for listed manufacturing firms in Tanzania.
5.2 Findings and implications and conclusions
The findings of this study indicate that, environmental compliance had no significant effect on the financial performance of the listed manufacturing firms in Tanzania. These findings were consistent with the theory of firm perspective which suggests that, the environmental compliance has no effect on the financial performance. Specifically, managers of listed manufacturing firms in Tanzania can neither decrease nor increase their financial performance by complying with environmental regulations. These findings are similar to studies (Mahapatra 1984; Mc Williams and Siegel 2000, Mull, 2006 and Murray et al., 2006) which suggest that there was no significant relationship between environmental compliance and financial performance. However the argument of no significance relationship is contrary to other studies. Studies (Spicer, 1978; Waddock and Graves, 1997, Schnietz and Epstein; 2005, Hart, 1997, Porter & Vander Linda, 1995, Reinhardt, 1999; Dowel et al; 2000 and King and Lenox, 2001) suggest a positive relationship between environmental compliance and financial performance; and studies (Chen and Metcalf; 1980, JaggiFeedman; 1992 and Wagner et al., (2000) which suggest a negative relationship between environmental compliance and financial performance.
111 The study has also provided scholars with areas of research. It will be interesting to do a research on the effect of environmental regulations on financial performance in other developing countries like Tanzania and find out if similar results will be observed.
With reference to control variables, the findings suggest two major issues. First, there was significant relationship between financial performance and age for listed manufacturing companies in Tanzania. This implies that the older the listed manufacturing company in Tanzania the better their financial performance. Second, there was significant negative relationship between financial performance and capital intensely for listed manufacturing firms in Tanzania. This implies that those listed manufacturing companies which invest heavily on the fixed assets will have poor financial performance (measured by ROI) in short run.
5.3 Recommendations
Based on the findings and implications presented in this study the following recommendations can be made. First, results suggest that environmental compliance has no significant effect on the financial performance for listed manufacturing firms in Tanzania; this implies that environmental compliance does not add financial value. Therefore it is advised that, manager of listed manufacturing firms in Tanzania should be careful when making decisions regarding to environmental compliance costs.
Secondly, the EMA 2004 indicates that, failure to comply with environmental regulations may cost the firms in term of fines and penalties. It is therefore advised that, listed manufacturing firms in Tanzania should comply with environmental standards.
Thirdly, for further researches, the following should be done :( 1) Further research of the relationship between environmental compliance and financial performance should be done in other developing countries like Tanzania. (2) Other studies should be done in Tanzania using other measures of financial performance and environmental compliance a part from measures used in this study. (3) Studies on the extent of environmental compliance and effectiveness of environmental regulations for developing countries should be done.
References
Aupperle, K., Carrol, A., Hatfield, J. (1985). An empirical examination of the relationship betweencorporate social responsibility and profitability. Academy of Management Journal, 28, 446-463.
Chen, K., Metcalf, R. (1980). The relationship between pollution control records and financial indicators revisited. Accounting Review, 55, 168-180.
Dowel, G., Hart, S., Yeung, B. (2000). Do corporate global environmental standards create or destroy market value?. Management Science, 46, 1059-1074.
Hanks, S., Watson, C., Hansen, E., Chandler, G. (1993). Tightening the life cycle construct. Entrepreneurship Theory and Practice, 18, 5-30.
Hart, S. (1997). Beyond greening strategic for sustainable world. Harvard Business Review, 75, 66. Hart, S., Ahuja, G. (1996). An empirical examination of the relationship between emission reduction
and firm's perfmance. Business Strategy and the Environment, 5, 30-37.
Jagg, B., Freedman, M. (1992). An examination of the impact of pollution performance on economic and market performance. Journal of Business Finance and Accounting, 19, 697-613.
Kierman, M. (1998). The eco-efficiency revolution. Investment horizon, April, 68-70.
King, A., Lenox, M. (2001). Does it really pay to be green? An empirical study of the firm's environmental and financial performance. Journal of Industrial Ecology, 5, 105-116.
Klassen, R., Laughing, C.M. (1996). The impact of environmental management on financial performane. Management Science, 42, 1199-1214.
Konar, S., Cohen, M. (1997). The effects of community rights to know laws on txic emission. Journal of environmental economic and management, 32, 109-124.
Mahapatra, S. (1981). Investors reaction to corporate social accounting. Journal of business finance ad accounting, 11, 29-40.
112 Mgana, S.S., Mahogo, S. (2002).strategic Action plan for Land based resources and activities affecting the marines, coastal and associated fresh water environmental in the eastern Africa region. A report of prepared by food and agriculture organization of the United Nations Project for the protection and management of the marine and coastal area of the eastern Africa region (EAF/S).
Mill, G. (2006). The financial performance of an socially responsible investment over time and possible link with corporate social responsibility. Journal of Business Ethics, 63, 131-148. Moughalu, M., Robinson, H., Glascock, J. (1990). Hazardous waste lawsuits, stockholder returns and
deterrence. Southern Economic Journal, 17, 535-547.
Murray, A., Sinclair, D., Power, D., Gray, R. (2006). Do market financial market care about social and environmental disclosure?. Auditing and accountability journal, 19, 228-255.
Nehrt, C. (1996). Timing and intensity of environmental investment. Strategic Management Journal, 17, 535-547.
Porter, M., der linde, C.V. (1995). Towards a new conception of the environmental competitiveness relationship. Journal of Economic Perspective, 9, 97-118.
Reinhardt, F. (199). Market failure and the environmental policies of firm. Journal of Industrial Ecology, 3, 9-21.
Russo, M., Fouts, P. (1997). A resource based perspective on corporate environmental performance and profitability. Academy of Management Journal, 9, 441-454.
Schnietz, K., Epstien, M. (2005). Exploring the financial value of reputation for corporate social responsibility. Corporate Reputation Review, 7, 327-345.
Spicer, B. (1978). Investors'corporate social performance and information disclosure. The Accounting Review, 33, 94-111.
UN (20077c). The millennium Developed Goals report. http://ww.un.org/millenium goal (Accessed September 18, 2007).
UNEP (2008) Africa; Atlas for our changing environment.United Nations Environmental Programme. Waddock, S., & Graves, S. (1977). The corporate social performance and financial performance link.
Strategic Management Journal, 18, 303-319.
Waddock, S., Graves, S. (1977). The corporate social performance and financial performance link.Strategic Management Journal, 18, 303-319.
Wagner, M., Vanphu, N., Azomahou, T., Wehrmeyer, W. (2002). The relationship between the environmental and economic performance for firms: an empirical analysis of european paper industry. Corporate Social Responsibility and Environmental Management, 9, 113-146.
Wahba, H. (2008). Does the market value corporate environmental responsibility? An empirical examination. Corporate Social Responsibility and Environmental Management, 15, 89-99. Williama, A. M., Siegel, D. (1984). Corporate social responsibility and financial performance.
Strategic Management Journal, 11, 29-40.